Abstract—In order to quantify non-linear behavior of
physiologic system such as the cardiovascular control system, we first used lobsters because we are invertebrate neurobiologists. As the results, we discovered that the lobsters display its emotion by changing the pattern of heart-beating. An exciting finding of lobster study was that the emotion was measurable by our technique through the heartbeat interval time series. And thus we extended the method to human: The heartbeat represents momently varying inner emotional tension. This psychological variations of the inner world was detectable and quantifiable using a long-time electrocardiogram (EKG). In the present study, in each investigation, we captured 2000 heartbeats without missing a single beat. For the analysis of the EKGs, we used “modified detrended fluctuation analysis (mDFA)” technique, which we have recently developed by our group. The mDFA calculates the scaling exponent (SI, scaling index) from the R-R interval time series. The mDFA can distinguish between a normal and an abnormal heart: a normal healthy heartbeat exhibits an SI of around 1.0. The heartbeat recorded from subjects who have stress and anxiety exhibited a lower SI. Arrhythmic heartbeats and extra-systolic heartbeats both also exhibited a low SI ~0.7, for example. The values of SI changed one right after the other when circumstances and atmospheres surrounding subjects were changed. We report that the mDFA technique is a useful computation method for checking the mind and health.
Index Terms—Anxiety, EKG, Electrocardiogram, Fear,
Heartbeat-interval time series, Modified detrended fluctuation analysis, mDFA, Quantitative measurement
I. INTRODUCTION
arious organs in living organisms are interconnected and exchange information each other. The exchangers are hormones and nerves. And in some case, a direct mechanical coupling works. Hence this body system is complex in functioning. Physiologists who have been studied life systems may need nonlinear approaches, together with the basic physiological methods.
The physiologists have been challenged also to another problems. The problems are that nonlinear regulatory systems for controlling the organs, such as the heart, are considered to be operating in the state far from equilibrium: maintaining constancy is not equivalent to maintaining
Manuscript received June 27, 2017; revised July 27, 2017. This work was supported in part by the JSPS Grant 17K01364 (sponsor and financial support acknowledgment goes here).
T. Y. Author is with Tokyo Metropolitan University, Biological Science, Hachioji, Tokyo, 192-0397 Japan (corresponding author phone: 81-9098053592; fax: 81-462392350; e-mail: [email protected]).
equilibrium. This means that physiologists need another theory instead of a classical homeostasis theory. Some researchers tried to characterize the fluctuation of the heartbeat by a scaling exponent to demonstrate that it was altered with disease and aging [1]. Goldberger et al. [1], Ivanov et al. [2] and Peng et al. [3] suggested that their method is applicable for the diagnosis of human heart disease, because they succeeded to show the difference between healthy and sick human subjects, although they did not study the transitory phenomena of subjects who were healthy in the past but are presently not healthy. Although conditions of patients were hard to manipulate for them, their success seems to be derived from what method they adopted. Demonstrating the detection of long-range correlation [2] and multi-fractal analysis [3], they eventually proposed that the scaling nature of heartbeat fluctuation is potentially usable for the diagnosis. However, for a practical application, for example, predicting when in the near future the heart stops its beating, more experimental approaches are necessary [4].
Our approach is to make an index system that can describe the condition of the cardio-vascular system by a quantitative way. It is believed that beat-to-beat variations of the heart rate reflect modulation of cardiac control center [5]. If one has such a quantitative description method in hand, he/she can predict forthcoming illness. We consider that we hope to find the way for distinguishing sick conditions from normal conditions, based on electro-physiological heart data, EKG. Not only in vertebrate animals like human, but also in invertebrates such as crustaceans, they have the heart. The human heart is composed of 4 chambers and the crustaceans have only one. As for the number of control command nerve fibers, running from the brain down to the heart, there are “so many” numbers of fibers in vertebrates. It is in turn countable number for the lobster; only three axons [6]. Thus, one may think that there are big differences between vertebrate and crustaceans in the anatomy of the cardio-vascular system. However, the heart is a pump that propels blood, and that is equipped with acceleration and breaking devises, the control of nerve fibers. The heart is composed of millions of protein molecules with various functions. Those are common features for both, in vertebrates and invertebrates. Therefore, fundamentally, all the cardio-vascular system operates in the same mode; ontogenetically designed as a pump equipped with positive and negative feedback controllers. Both vertebrates and
Anxiety, Worry, and Fear: Quantifying the Mind
Using EKG-mDFA Method
Toru Yazawa
invertebrates have a very complex cardio-vascular system in structure, function and regulation. Beneficial points for adopting invertebrates are; there are less-ethical problems and there exists a large amount of accumulated knowledge about the heart evolution, and all the hearts must have the same evolutional origin.
From above arguments we may conclude that there are common features between vertebrate (human) and invertebrate (lobster). This fact suggests that, in an early developmental stage, the basic plan in making tissue/organs of earth-based animals, is controlled by completely common blueprints, a specific DNA sequence. The heart could not be an exceptional organ for them. Basic architecture of the heart and of its control mechanism could be fundamentally identical for all ‘hearted’ animals. Crustaceans supply, thus good model specimens, for the research on neurodynamical control of the heart.
We have observed that a healthy-looking crustacean heart stop unpredictably resulting in a failure of heart’s pumping-blood function [6]. This can happen to a human. It would be the worst-case scenario for the cardio-vascular system. Generally, cardiac failure has a principal underlying aetiology of ischemic damage arising from vascular insufficiency [7].
Meanwhile, we know that our (human) heart function directly reflects psychology. The autonomic nerves can change heart function according to stimuli such as stress that we receive. Thus, such stimuli from environment cause dynamic changes of our internal world and changes the heart function as well.
This study is a challenge to quantify the internal world using long-time electrocardiogram (EKG, abbreviation after Willem Einthoven) recordings. We have recently made a novel method for EKG analysis, which is the modified detrended fluctuation analysis (mDFA) [6]. In the present study, we show that mental changes which occur internally can be measured with the combination of EKG and mDFA. Although mDFA is not a method well known to the public, we would like to introduce mDFA, which is helpful for checking health and the mind as we exemplify in the present paper.
II. HEARTBEAT RECORDING AND ETHICS
We used a Power Lab system (ADInstruments, Australia) to record heartbeats. For recording human EKG, we used a set of three ready-made silver/silver chloride disposable electrodes (positive, negative, and ground) (Vitrode V, Nihon Koden, Japan), which is commercially available. Wires from the EKG electrodes were connected to our lab-made amplifier [6], which is activated by two button batteries at the voltage of 3.0 volt. This equipment is only
used in the “university laboratory condition” with a certificate of consent written by all subjects. The EKG signals were passed to the Power Lab system. Finger pulse recordings were also used with the Power Lab system. Over 500 subjects have been tested so far, but no electrical accident has happened by the home-made amplifier recording.
The human heartbeats were recorded outside of a hospital, in for example university laboratories and convention halls (The Innovation Japan Exhibition). All subjects were treated as per the ethical control regulations of following universities (Tokyo Metropolitan University; Tokyo Women’s Medical University; Universitas Advent Indonesia, Bandung; Universitas Airlangga, Surabaya, Indonesia).
III. HEARTBEAT RECORDING AND ANALYSIS
A computation method mDFA [6] is: (A) Recording EKG at a sampling rate 1 kHz, obtaining 2,000 heartbeats without any missing heartbeat. (B) To avoid miss recording, an EKG amplifier mounted an in-put circuit with a short time-constant (tau); the ideal tau would be, τ < 0.22 s. (C) An appropriate box size for the mDFA was [30; 270] in beat per min (BPM), which means that mDFA computes a routine regression line from 30 BPM to 270 BPM. (see [6]). This automatic computation well distinguished two different heart conditions, an isolated heart and an intact heart of lobsters [6]. Human EKGs were taken at the sitting position for about 30 min, in the afternoon, from the volunteers.
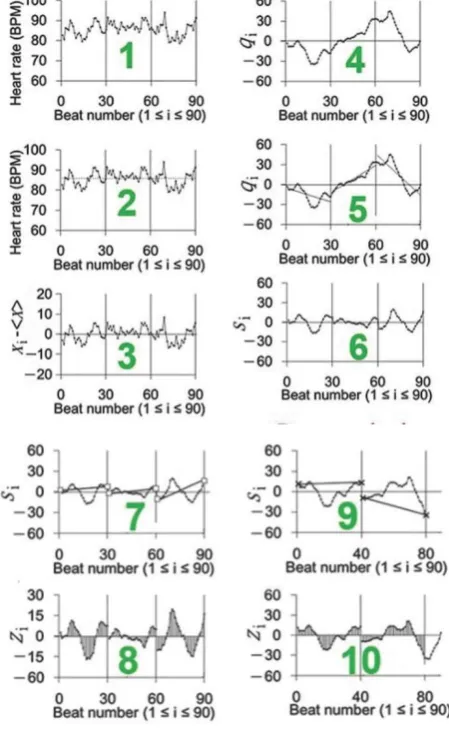
Fig. 1 shows the mDFA-computation. An interval time series {xi} was obtained (Graph 1 in Fig. 1). Graph 1 only shows 90 beats. Real data involved as 2,000 beats. An average interval time of the 2,000, <x>, was obtained (Graph 2 in Fig. 1, a dotted line). A computation of xi - <x> gave a time series that fluctuate around zero line (Graph 3 in Fig. 1). A computation of qi,
(1)
was conducted (Graph 4 in Fig. 1). This “random walk” like signal was cut into “box” (Graphs 4 and 5 in Fig. 1). Please note that, here, “box size” is 30 beat as an example. mDFA program repeats computation cyclically with changing box size from 10 to 1000 (see Fig. 3).
Within each box, a regression line was made by the least mean square method (Graph 5). In Graph 5, a linear regression line is shown. But, in the real mDFA, we use biquadratic regression line. Then, “difference” between the regression line and data were calculated (Si, Graph 6). This is “detrended” procedure that Peng et al. [8] have introduced for EKG analysis.
Peng et al.’s DFA and mDFA is thus different. Computational idea is thus totally different. Subsequent algorithm is the same as Peng’s (see [8). By changing box size, we can see the scale invariant property, i.e., a self-similar process at different scale.
[image:3.595.53.278.133.498.2]Fig. 1. Ten key procedures explaining mDFA computation (Graphs 1-10).
Fig. 2. mDFA box-size-range (a slope measurement from which box size to which box size).
Fig. 3. mDFA box-size at which we computed variance and mDFA.
IV. BOX SIZE IN ROUTINE MDFA
We always use a routine mDFA [6]. Our routine works include: (1) obtaining a baseline-stable EKG at 1KHz sampling rate, (2) detecting peaks of heartbeat, (3) measuring peak to peak interval (such as R-R peak interval of conventional EKG), (4) constructing inter-heartbeat interval time series, and (5) analyzing the time series using mDFA program.
mDFA uses a consecutively recorded ~2000 heartbeat data. The number 2000 could be ideal number of heartbeat if one wants to use mDFA. A 2000 beat length of EKG is corresponding to a time period for about 30 min. We tested a longer recording period, for example EKG for 2 hour. Long data is not adequate to use, because subjects are NEVER stable. Nobody can keep a steady state, i.e., keeping sitting posture for 2 hours. And more importantly, the heart seems NOT to keep staying at a stable condition for such a long period. Instead, the heart control by the brain is very variable and thus dynamic. We therefore fixed our data length for about 30 min or so, which is a period length for about 2000 beat. A ~2000 beat is key length of mDFA technology.
V. EKG-MDFA DEVICE
[image:3.595.55.285.573.711.2]Red and green end terminals are lab-made input terminals form the EKG electrodes (Fig. 4A). This system is commercially available but we modified the electrode attachment due to the inconvenience in precision recording of the heartbeat signal. Figure 4C shows an iPod (Apple, USA) which has a computation program, i.e., mDFA, that we made and was incorporated in it.
[image:4.595.314.544.207.457.2]Figure 5 shows a practical view of iPod touch screen. To start recording, an operator can touch the red button (Rec), and then after completing capture of 2000 beats, it automatically compute SI. As can be seen in the figure, it computes. SIs are computed from various box size ranges (see the reference [6] in detail), [10; 30], [30; 70], [70; 140], [130; 270], [51; 100], [30; 140], and [30; 270]. For the final SI-result, we use the last one, here it is 0.531390, as explained in the reference [6].
[image:4.595.48.284.263.533.2]Fig. 4. Electrocardiogram recorder and mDFA calculator.
Fig. 5. An example screen view of iPod (lab-made, not for sale).
VI. RESULTS
A. Case 1: Driving safely
A volunteer (a man age 66) drove a car from his home to a town 150 km away to see his mother-in-low who is hospitalized. He has been driving the road a number of time, thus he is familiar with the road conditions every corner. Furthermore, he drove safely as possible as he can by obeying the speed limit. We recorded his EKGs while driving, and computed the scaling exponents (Figs. 4 and 5).
Driver’s heart rate was monitored by a device commercially available (Fig. 4). Fig. 5 shows an example result of mDFA computation. Fig. 6B represents a 2000 beat recording. Fig. 6A shows an expanded time series of heart rate recording (see arrows). Interval signals were transferred
to an iPod and stored in it (Fig. 4). The iPod device has our mDFA program [the program is explained in the reference 6]. The program instantaneously computed the scaling exponent (SI) from the heart rate time series immediately after 2000 heart beats were captured (Figs. 5 and 6C). Fig. 6D shows a summary of the characteristics of the data {i.e., the file-name, 37 min and 0.2 sec recording in total-time for the 2000 beats, R-R interval value in the end of recording, and heart rate (beat per min, BPM) of the last heartbeat.} Fig. 6C indicates that it was proved that driving safely gives a perfect healthy scaling exponent near 1.0. Here, the SI is 0.99 (Fig. 6).
Figure 6. EKG monitoring and mDFA results.
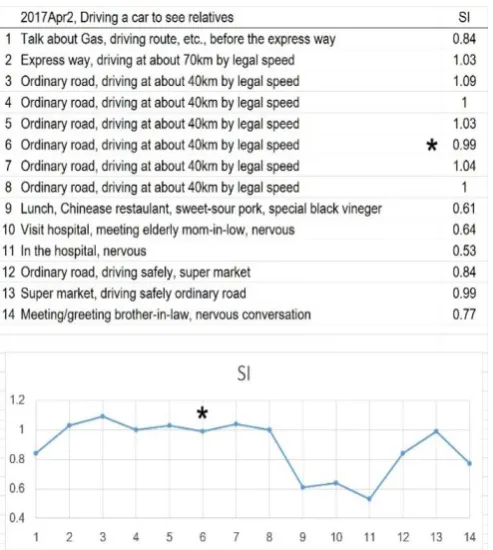
[image:4.595.46.285.396.530.2] [image:4.595.306.553.504.779.2]Fig. 7 shows an example of EKG-heart-rate monitor and the scaling exponent (SI) computation during the driving for many hours (see Method section and also [6] for detail). We confirmed that we can indeed quantify the mind of driver, or internal world of any human-subjects, such as the vehicle-driver, because we consider that the heartbeat reflects the mind or that the heart is the window of the brain [6, 9, 10].
In Fig. 7, when starting driving, SI showed a low value (SI=0.84, see Fig. 7, number 1). This can be explained that the driver handle many worries about fuel Gas, driving route and so force. When taking express way, the driver kept its speed limit 70 km and enjoyed blue sky of a spring morning day (SI=1.03, Fig. 7, number 2). Many vehicles over-took his car one right after the other although only some cars were followed his car. He continued driving safely (from 3 to 8). One can see that all of his safe-driving gave good SI, i.e., near 1.0 as can be seen the SI values from 2 to 8.
We found that eating lunch decreased the SI value (SI=0.61, Fig. 7, number 9). We can explain this results as followings: the mind (his brain function, i.e., autonomic nerve function) concentrated to enjoy foods, digesting them in the stomach and even pay less attention to environment, the condition of which is a kind of state loosing dynamic response of the brain that momentarily controls the heartbeats every second.
We also confirmed that mDFA can capture anxiety/worry of a subject (Fig. 7). In this record one can see that the subject who walked into the hospital and visited and stayed the room of his mother-in-law (see Fig. 7, comment number 10 and 11, SI=0.64 and 0.53, respectively). After the hospital, the person’s SI recovered during driving and shopping at the super market (see Fig. 7, comment number 12 and 13).
And most interestingly, when meeting a new person (the drivers brother-in-low) to greet him, the SI showed a very low value (Fig. 7, number 14, SI=0.77), which indicates that he is very nervous NOT to display an ungentlemanly attitude.
Fig. 8. Examples of iPod-mDFA. A, Fig. 7, record 10. B, Fig. 7 record 11 (corresponding results is shown in Fig. 7). Five min break of recording between A and B. Driving the car (d), walking into the hospital (e), sitting in the room of patient (f).
Fig. 8 shows two example results for “stressful” mDFA, which are corresponding to the descriptions shown in Fig. 7
[image:5.595.59.290.575.692.2]number 10 and 11, respectively. In Fig. 7, number 10, the subject entered hospital to see his mother-in-law, and met her finally. This behavior made his SI a lower value, SI=0.64, and SI=0.53, both of which were instantaneously computed by iPod-mDFA system as shown in Fig. 8.
Figure 9. mDFA results during 13 hours overseas flight.
B. Case 2: Overseas flight
Volunteer (a man 66) traveled from the Narita-Tokyo Airport to the Washington Dulles International Airport in order to attend a conference held in the USA. We recorded his EKGs, and computed the scaling exponents (Fig. 9).
Fig. 9).
In conclusion, happy life could fundamentally guarantee a healthy exponent. Anxiety and stress lowered the scaling exponent. mDFA might reflect psychological and physical internal bodily state. mDFA might look at internal state through the heart. The heart is the window of the mind.
VII. DISCUSSION
This study suggests that the scaling exponents computed by mDFA can quantify stress. Furthermore, mDFA results were intriguing: Cardiac muscle injury can be detected using mDFA. An ischemic heart has a high SI. Before the key finding, we already have proven in animal models that an injured crustacean hearts exhibited a high exponent [6].
Although we need much more comprehensive examples, we propose that mDFA is helpful computation tool in the research on emotion, particularly fear and anxiety disorders, understanding how emotion is encoded in the heartbeat time series, in animal models and humans.
If the body is tortured by stimuli from environment, and/or if some stimuli would harm us internally, which is invisible from outside, we would be upsetting for the nervous system, because we can realize that stimuli is distorting the autonomic nerve function, little of which has been understood by human being until today [4], although we spend everyday life under advanced science and technology. Using mDFA computation, we can numerically evaluate/quantify the state of our body, even it is invisible to us.
Although we (basic scientists, biologists) cannot make by ourselves, making a gadget is very rewarding. It is the right time to start making it. The gadget can work: (1) recording 2000 consecutive heartbeats without missing even a single pulse, (2) computing automatically the scaling exponent that can check the scaling exponent = 1.0, which is perfectly healthy state [6], and finally (3) the gadget would capture what is going on in front of, around, and inside our mind. It gives us health information, each time we use it, for example, on an everyday basis.
In the present paper, we would suggest that we have entered the world experiencing seeing inside without sight. Sometimes a new technology does not have to be supercomplicated. mDFA computation is a kind of high school level mathematics instead of sophisticated nonlinear measures and/or linear complex computation like the HRV, the heart rate variability. mDFA looks at how the brain communicate with the heart and also with the world. mDFA is a tool that enable us to explore previously uncharted territories.
REFERENCES
[1] A.L. Goldberger, L.A.N. Amaral, J.M. Hausdorff, P.C. Ivanov, C. - K. Peng, and H. E. Stanley. “Fractal dynamics in physiology: Alterations with disease and aging”, Proc. Natl. Acad. Sci.. Vol. 99, Suppl. 1, pp2466-2472
[2] P. C. Ivanov, L. A. N. Amaral, A. L. Goldberger, S. Havlin, M. G. Rosenblum, Z. R. Struzik, and H. E. Stanley. "Multifractality in human heartbeat dynamics", Nature. Vol. 399, 1999, pp. 461-465.
[3] C. -K. Peng, J. Mietus, J. M. Hausdorff, S. Havlin, H. E. Stanley, and A. L. Goldberger. "Long-range correlation and non-Gaussian behavior of the heartbeat", Physical Review Letters. Vol. 70, 1993, pp. 1343-1346. [4] K. Hu, P.C. Ivanov, M.F. Hilton, Z. Chen, R.T. Ayers, H.E. Stanley and
S.A. Shea. Proc. Natl. Acad. Sci.. Vol. 101, 2004, No. 52, pp18223-18227.
[5] J. P. Saul. "Beat-to-beat variations of heart rate reflect modulation of cardiac autonomic outflow", News In Physiological Sciences. Vol. 5, 1990, pp. 32-27.
[6] T. Yazawa, “Modified detrended fluctuation analysis, mDFA.” ASME
monograph, 2015
[7] Nicola Smart, Catherine A. Risebro, Athalie A. D. Melville, Kelvin Moses, Robert J. Schwartz, Kenneth R. Chien and Paul R. Riley, “Thymosin beta-4 induces adult epicardial progenitor mobilization and neovascularization.” Nature. Vol. 445, pp. 177–182 (11 January 2007) [8] Peng, C. –K. et al. “Quantification of scaling exponents and crossover
phenomena in nonstationary heartbeat time series.” Chaos. Vol. 5, 1995. pp. 82-87.
[9] T. Yazawa, “Invisible Emotion, Anxiety and Fear: Quantifying the Mind Using EKG with mDFA.” Proceedings of the 8th International
Multi-Conference on Complexity, Informatics and Cybernetics (IMCIC
2017), March, Orlando, FL, USA, pp. 201-205.
[10] T. Yazawa, “Quantification of stress: a case study using modified detrended fluctuation analysis (mDFA) of the heartbeat.” Proceedings of The 20th World Multi-Conference on Systemics, Cybernetics and