Findings of the WMT 2019 Shared Tasks on Quality Estimation
Erick FonsecaInstituto de Telecomunicac¸˜oes, Portugal [email protected]
Lisa Yankovskaya University of Tartu, Estonia [email protected]
Andr´e F. T. Martins Instituto de Telecomunicac¸˜oes
& Unbabel, Portugal
Mark Fishel
University of Tartu, Estonia [email protected]
Christian Federmann Microsoft, USA [email protected]
Abstract
We report the results of the WMT19 shared task on Quality Estimation, i.e. the task of predicting the quality of the output of machine translation systems given just the source text and the hypothesis translations. The task in-cludes estimation at three granularity levels: word, sentence and document. A novel ad-dition is evaluating sentence-level QE against human judgments: in other words, design-ing MT metrics that do not need a reference translation. This year we include three lan-guage pairs, produced solely by neural ma-chine translation systems. Participating teams from eleven institutions submitted a variety of systems to different task variants and language pairs.
1 Introduction
This shared task builds on its previous seven edi-tions to further examine automatic methods for es-timating the quality of machine translation (MT) output at run-time, without the use of reference translations. It includes the (sub)tasks of word-level, sentence-level and document-level estima-tion. In addition to advancing the state of the art at all prediction levels, our more specific goals in-clude to investigate the following:
• The predictability of missing words in the MT output. As in last year, our data include this annotation.
• The predictability of source words that lead to errors in the MT output, also as in last year.
• Quality prediction for documents based on errors annotated at word-level with added severity judgments. This is also like in last year.
• The predictability of individual errors within documents, which may depend on a larger
context. This is a novel task, building upon the existing document-level quality estima-tion.
• The reliability of quality estimation models as a proxy for metrics that depend on a refer-ence translation.
• The generalization ability of quality estima-tion models to different MT systems instead of a single ones
We present a simpler setup in comparison to last edition, which featured more language pairs, sta-tistical MT outputs alongside neural ones, and an additional task for phrase-based QE. This simpli-fication reflects a more realistic scenario, in which NMT systems have mostly replaced SMT ones, making phrase-level predictions harder.
We used both new data as well as some exist-ing data from the previous edition of this shared task. For word and sentence level, we reused the English-German dataset from last year, but also added a new English-Russian one. For document level, we reused last year’s English-French data for training and validation, but introduced a new test set from the same corpus. For QE as a met-ric we ran the evaluation jointly with the WMT19 metrics task, which meant applying the QE sys-tems to news translation submissions and evaluat-ing them against the human judgments collected this year.
2 Tasks
translation systems.1
2.1 Task 1
The aim of Task 1 is to estimate the amount of human post-editing work required in a given sen-tence. It is comprised of word-level and sentence-level subtasks, both of which annotated as in last year.
2.1.1 Word Level
At the word level, participants are required to pro-duce a sequence of tags for both the source and the translated sentences. For the source, tokens correctly translated should be tagged as OK, and the ones mistranslated or ignored as BAD. For the translated sentence, there should be tags both for words andgaps– we consider gaps between each two words, plus one in the beginning and another in the end of the sentence. Words correctly aligned with the source are tagged as OK, and BAD oth-erwise. If one or more words are missing in the translation, the gap where they should have been is tagged as BAD, and OK otherwise.
As in previous years, in order to obtain word level labels, first both the machine translated sentence and the source sentence are aligned with the post-edited version. Machine trans-lation and post-edited pairs are aligned us-ing the TERCOM tool (https://github. com/jhclark/tercom);2 source and post-edited use the IBM Model 2 alignments from fast align(Dyer et al.,2013).
Target word and gap labels Target tokens orig-inating from insertion or substitution errors were labeled as BAD (i.e., tokens absent in the post-edit sentence), and all other tokens were labeled as OK. Similarly to last year, we interleave these tar-get word labels withgaplabels: gaps were labeled as BAD in the presence of one or more deletion errors (i.e., a word from the source missing in the translation) and OK otherwise.
Source word labels For each token in the post-edited sentence deleted or substituted in the ma-chine translated text, the corresponding aligned
1This is true for tasks 1 and 2, since task 3 is based on the
MT systems submitted to WMT19 News Translation, which can potentially use any MT paradigm, including rule-based, statistical, neural and hybrid approaches.
2For back-compatibility with last year’s datasets, when
computing word-level labels, we disabled shifts in TER-COM; shifts were allowed for sentence-level label genera-tion.
source tokens were labeled as BAD. In this way, deletion errors also result in BAD tokens in the source, related to the missing words. All other words were labeled as OK.
Evaluation As in last year, systems are evalu-ated primarily by F1-Mult, the product of the F1 scores for OK and BAD tags. There are sepa-rate scores for source sentences and translated sen-tences, with the latter having word and gap tags interleaved. Systems are ranked according to their performance on the source side.
Additionally, we compute the Matthews corre-lation coefficient (MCC,Matthews 1975), a metric for binary classification problems particularly use-ful when classes are unbalanced. This is the case in QE, in which OK tags are much more common than BAD tags (see Table2for the statistics on this year’s data). It is computed as follows:
S= T P +F N
N
P = T P +F P
N
M CC =
T P N −SP
p
SP(1−S)(1−P),
(1)
where T P, T N, F P andF N stand for, respec-tively, true positives, true negatives, false positives and false negatives; andN is the total number of instances to be classified.
2.1.2 Sentence Level
At the sentence level, systems are expected to pro-duce the Human Translation Error Rate (HTER), which is the minimum ratio of edit operations (word insertions, deletions and replacements) needed to fix the translation to the number of its tokens, capped at maximum 1.
In order to obtain the number of necessary op-erations, we run TERCOM on the machine trans-lated and post-edit sentences, with a slightly dif-ferent parametrization (see footnote2).
Evaluation Also as in last year, systems are pri-marily evaluated by the Pearson correlation score with the gold annotations. Mean absolute error (MAE), rooted mean squared error (RMSE) and Spearman correlation are also computed.
2.2 Task 2
Gold annotation
Coup de sifflet Fox 40 CMG classique doigt
officiel Grip
System output
Coup de sifflet Fox 40 CMG classique doigt
[image:3.595.72.291.61.184.2]officiel Grip
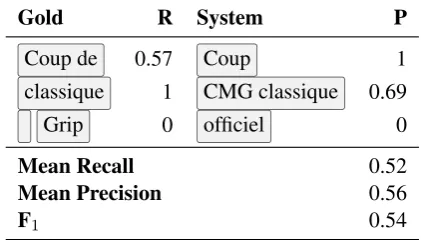
Figure 1: Example of fine-grained document annota-tion. Spans in the same color belong to the same an-notation. Error severity and type are not shown for brevity.
identifying which words and passages are incor-rect in the translation.
Each document contains zero or more errors, annotated according to the MQM taxonomy3, and may span one or more tokens, not necessarily con-tiguous. Errors have a label specifying their type, such as wrong word order, missing words, agree-ment, etc. They provide additional information, but do not need to be predicted by the systems. Additionally, there are three severity levels for er-rors: minor (if it is not misleading nor changes meaning),major(if it changes meaning), and crit-ical(if it changes meaning and carries any kind of implication, possibly offensive).
Figure1shows an example of fine-grained error annotations for a sentence, with the ground truth and a possible system prediction. Note that there is an annotation composed by two discontinuous spans: a whitespace and the tokenGrip— in this case, the annotation indicates wrong word order, andGripshould have been at the whitespace posi-tion.
The document-level scores, called MQM scores, are determined from the error annotations and their severity:
MQM = 1−nminor+ 5nmajor+ 10ncrit
n . (2)
Notice that the MQM score can be negative de-pending on the number and severity of errors; we truncate it to 0 in that case. Also notice that, while the MQM score can be obtained deterministically from the fine-grained annotations, participants are
3Multidimensional Quality Metrics; see
http://www.qt21.eu/mqm-definition/ definition-2015-12-30.htmlfor details.
Gold R System P
Coup de 0.57 Coup 1
classique 1 CMG classique 0.69
Grip 0 officiel 0
Mean Recall 0.52
Mean Precision 0.56
[image:3.595.310.521.64.184.2]F1 0.54
Table 1: Scores for the example system output shown in Figure1.Rstands for recall andPfor precision, and are computed based on character overlap.
allowed to produce answers for both subtasks in-consistent with each other, if they believe their systems to work better estimating a single score for the whole document.
MQM Evaluation MQM scores are evaluated in the same way as the document-level HTER scores: primarily with Pearson correlation with the gold values, and also with MAE, RMSE and Spearman’sρ.
Fine-grained Evaluation Fine-grained annota-tions are evaluated as follows. For each error annotation asi in the system output, we look for the gold annotationagj with the highest overlap in number of characters. The precision ofasi is de-fined by the ratio of the overlap size to the an-notation length; or 0 if there was no overlapping gold annotation. Conversely, we compute the re-call of each gold annotation agj considering the best matching annotationaskin the system output4, or 0 if there was no overlapping annotation. The document precision and recall are computed as the average of all annotation precisions in the corre-sponding system output and recalls in the gold out-put; and therewith we compute the document F1. The final score is the unweighted average of the F1for all documents. Table1shows the precision and recall for each annotation in the example from Figure1.
2.3 Task 3
Task 3 on applying QE as a metric had several pur-poses:
• To find out how well QE results correlate
4Notice that if a gold annotationag
jhas the highest
over-lap with a system annotationas
i, it does not necessarily mean
thatas
with general human judgments of MT qual-ity. This mainly means shifting the applica-tion focus of quality estimaapplica-tion from profes-sional translators (whose primary interest is the expected number of post-edits to perform, as estimated by the HTER score) to MT de-velopers and general users.
• To test the generalization ability of QE ap-proaches in a massive multi-system scenario, instead of learning to estimate the quality of just a single MT system
• To directly compare QE models to MT met-rics and see how far one can get without a reference translation, or in other words, how much does one gain from having a reference translation in terms of scoring MT outputs
As part of this task sentence-level QE systems were applied to pairs of source segments and trans-lation hypotheses submitted to the WMT19 news translation shared task. System-level results were also computed via averaging the sentence score over the whole test set.
Submission was handled jointly with the WMT19 metrics task. Two language pairs were highlighted as the focus of this task: English-Russian and English-German; however, the task was not restricted to these, and other news transla-tion task languages were also allowed.
Results of this task were evaluated in the same way as MT metrics, using Kendall rank corre-lation for sentence-level and Perason correcorre-lation for system-level evaluations (see (Graham et al., 2019) for precise details). The overall motiva-tion was to measure how often QE results agree or disagree with human judgments on the quality of translations, and whether references are needed at all to get a reliable estimate of it.
3 Datasets
3.1 Task 1
Two datasets were used in this task: an English-German, the same as in last year with texts from the IT domain; and a novel English-Russian dataset with interface messages present in Mi-crosoft applications. The same data are used for both word-level and sentence-level evaluations.
Table2shows statistics for the data. Both lan-guage pairs have nearly the same number of sen-tences, but EN-DE has substantially longer ones.
The ratio of BAD tokens in the word-level annota-tion is also similar in both datasets, as well as the mean HTER, with a increased standard deviation for EN-RU.
3.2 Task 2
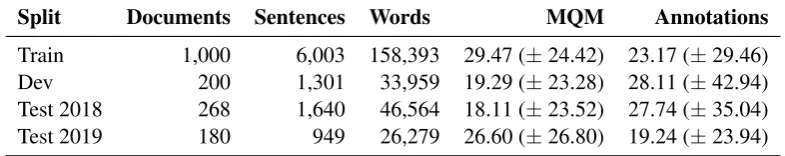
There is only one dataset for this task. It is the same one used in last year’s evaluation, but with a new unseen test set and some minor changes in the annotations; last year’s test set was made available as an additional development set. The documents are derived from the Amazon Product Reviews English-French dataset, a selection of Sports and Outdoors product titles and descriptions. The most popular products (those with more reviews) were chosen. This data poses interesting challenges for machine translation: titles and descriptions are of-ten short and not always a complete senof-tence. The data was annotated for translation errors by the Unbabel community of crowd-sourced annotators. Table3shows some statistics of the dataset. We see that the new test set has a mean MQM value higher than last year, but actually closer to the training data. On the other hand, the average num-ber of annotations per document is smaller.
3.3 Task 3
Task 3 did not use a specially prepared dataset, as evaluations were done via the human judgments collected in the manual evaluation phase of the news translation shared task.
Suggested training data included last years’ WMT translation system submissions and their collected human judgments (years 2016–2018), as well as any other additional resources including HTER-annotated QE data, monolingual and par-allel corpora.
4 Baselines
These are the baseline systems we used for each subtask.
4.1 Word Level
Split Pair Sentences Words BAD source BAD target HTER
Train EN-DE 13,442 234,725 28,549 (12.16%) 37,040 (7.06%) 0.15 (±0.19) EN-RU 15,089 148,551 15,599 (10.50%) 18,380 (6.15%) 0.13 (±0.24)
Dev EN-DE 1,000 17,669 2,113 (11.96%) 2,654 (6.73%) 0.15 (±0.19) EN-RU 1,000 9,710 1,055 (10.87%) 1,209 (6.17%) 0.13 (±0.23)
[image:5.595.91.507.64.180.2]Test EN-DE 1,023 17,649 2,415 (13.68%) 3,136 (8.04%) 0.17 (±0.19) EN-RU 1,023 7,778 1,049 (13.49%) 1,165 (7.46%) 0.17 (±0.28)
Table 2: Statistics of the datasets used in Task 1. Number of sentences is always the same in source and target; number of words refer to the source. Values shown for HTER are mean and standard deviation in parentheses.
Split Documents Sentences Words MQM Annotations
Train 1,000 6,003 158,393 29.47 (±24.42) 23.17 (±29.46) Dev 200 1,301 33,959 19.29 (±23.28) 28.11 (±42.94) Test 2018 268 1,640 46,564 18.11 (±23.52) 27.74 (±35.04) Test 2019 180 949 26,279 26.60 (±26.80) 19.24 (±23.94)
Table 3: Statistics of the datasets used in Task 2. The column Annotations shows the average number of annotations per document in the dataset. The values for MQM and Annotations are the mean with standard deviation in parentheses
and neighboring words. It then applies linear lay-ers and an RNN to the embedded vectors, out-putting a softmax over OK and BAD tags.
4.2 Sentence Level
The sentence-level baseline is a linear regressor trained on four features computed from word-level tags. At training time, it computes the features from the gold training data; at test time, it uses the output produced by the word-level baseline. We found this setup to work better than training the regressor with the automatically generated output. The features used are:
1. Number of BAD tags in the source;
2. number of BAD tags corresponding to words in the translation;
3. number of BAD tags corresponding to gaps in the translation;
4. number of tokens in the translation.
During training, we discarded all sentences with an HTER of 0, and during testing, we always an-swer 0 when there are no BAD tags in the in-put. This avoids a bias towards lower scores in the case of a high number of sentences with HTER 0, which is the case in the EN-RU data.5
5While in principle sentences with no BAD tags should
4.3 Document Level
For the document-level task, we first cast the prob-lem as word-level QE: tokens and gaps inside an error annotation are given BAD tags, and all oth-ers are given OK. Then, we train the same word-level estimator as in the baseline for Task 1. At test time, for the fine-grained subtask, we group consecutive BAD tags produced by the word-level baseline in a single error annotation and always give it severity major (the most common in the training data). As such, the baseline only produces error annotations with a single error span.
For the MQM score, we consider the ratio of bad tags to the document size:
MQM = 1−nbad
n (3)
This simple baseline contrasts with last year, which used QuEst++ (Specia et al., 2015), a QE tool based on training an SVR on features ex-tracted from the data. We found that the new base-line performed better than QuEst++ on the devel-opment data, and thus adopted it as the official baseline.
[image:5.595.102.495.228.306.2]4.4 QE as a Metric
The QE as a metric task included two baselines, both unsupervised. One relied on pre-trained vector representations and consisted of com-puting cross-lingual sentence embeddings (using LASER: Artetxe and Schwenk, 2018) for the source segment and the hypothesis translation and using their cosine similarity as the measure of sim-ilarity between them. Pre-trained LASER models were used and no other training or tuning was per-formed.
The second baseline consisted of using bilin-gually trained neural machine translation systems to calculate the score of the hypothesis transla-tion, when presented with the source segment as input. Thus, instead of decoding and looking for the best translation with the MT models, we com-puted the probability of each subword in the hy-pothesis translation and used these to compute the overall log-probability of the hypothesis under the respective MT model.
5 Participants
In total, there were eleven participants for all three tasks, though not all participated in all of them. Here we briefly describe their strategies and which sub-tasks they participated in.
5.1 MIPT
MIPT only participated in the word-level EN-DE task. They used a BiLSTM, BERT and a baseline hand designed-feature extractor to gen-erate word representations, followed by Condi-tional Random Fields (CRF) to output token la-bels. Their BiLISTM did not have any pre-training, unlike BERT, and combined the source and target vectors using a global attention mech-anism. Their submitted runs combining the base-line features with the BiLSTM and with BERT.
5.2 ETRI
ETRI participated in Task 1 only. They pretrained bilingual BERT (Devlin et al.,2019) models (one for EN-RU and another for EN-DE), and then fine-tuned them to predict all the outputs for each lan-guage pair, using different output weight matri-ces for each subtask (predicting source tags, target word tags, target gap tags, and the HTER score). Training the same model for both subtasks effec-tively enhanced the amount of training data.
5.3 CMU
CMU participated only in the sentence-level task. Their setup is similar to ETRI’s, but they pretrain a BiLSTM encoder to predict words in the target conditioned on the source. Then, a regressor is fed the concatenation of each encoded word vector in the target with the embeddings of its neighbours and a mismatch feature indicating the difference between the prediction score of the target word and the highest one in the vocabulary.
5.4 Unbabel
Unbabel participated in Tasks 1 and 2 for all lan-guage pairs. Their submissions were built upon theOpenKiwiframework: they combined linear, neural, and predictor-estimator systems (Chollam-patt and Ng,2018) with new transfer learning ap-proaches using BERT (Devlin et al., 2019) and XLM (Lample and Conneau, 2019) pre-trained models. They proposed new ensemble techniques for word and sentence-level predictions. For Task 2, they combined a predictor-estimator for word-level predictions with a simple technique for con-verting word labels into document-level predic-tions.
5.5 UTartu
UTartu participated in the sentence-level track of task 1 and in task 3. They combined BERT (De-vlin et al., 2019) and LASER (Artetxe and Schwenk,2018) embeddings to train a regression neural network model. The output objective was either HTER for task 1 or the direct assessment human annotations from WMT 2016–2018. In addition to pre-trained embeddings as input fea-tures they also used a log-probability score ob-tained from a neural MT system. Finally, their sys-tems were pre-trained on synthetic data, obtained by taking all of the WMT submissions from earlier years and using chrF (Popovi´c,2015) as the syn-thetic output. The approach is described in greater detail in (Yankovskaya et al.,2019).
5.6 NJUNLP
on their averaged output vectors.
5.7 BOUN
BOUN turned in a late submission. For word-level predictions, they used referential machine transla-tion models (RTM), which search the training set for instances close to test set examples, and try to determine labels according to them. For sen-tence level, they used different regressors trained on features generated by their word-level model. For document level, they treat the whole document as a single sentence and apply the same setup.
5.8 USAAR-DFKI
USAAR-DFKI participated only in the sentence-level EN-DE task, and used a CNN implementa-tion of the predictor-estimator based quality esti-mation model (Chollampatt and Ng, 2018). To train the predictor, they used WMT 2016 IT do-main translation task data, and to train the estima-tor, the WMT 2019 sentence level QE task data.
5.9 DCU
DCU submitted two unsupervised metrics to task 3, both based on the IBM1 word alignment model. The main idea is to align the source and hypothe-sis using a model trained on a parallel corpus, and then use the average alignment strength (average word pair probabilities) as the metric. The vari-eties and other details are described in (Popovi´c et al.,2011).
5.10 USFD
The two Sheffield submissions to the task 3 are based on the BiRNN sentence-level QE model from the deepQuest toolkit for neural-based QE (Ive et al., 2018). The BiRNN model uses two bi-directional recurrent neural networks (RNNs) as encoders to learn the representation of a ¡source,translation¿ sentence pair. The two en-coders are trained independently from each other, before being combined as the weighted sum of the two sentence representations, using an attention mechanism.
The first variant of our submission, ’USFD’, is a BiRNN model trained on Direct Assessment data from WMT’18. In this setting, the DA score is used as a sentence-level quality label. The sec-ond variant, ’USFD-TL’, is a BiRNN model pre-viously trained on submissions to the WMT News task from 2011 to 2017, with sent-BLEU as a qual-ity label. We only considered the best performing
submission, as well as one of the worst performing one. The model is then adapted to the downstream task of predicting DA score, using a transfer learn-ing and fine-tunlearn-ing approach.
5.11 NRC-CNRC
The submissions from NRC-CNRC (kiu Lo,2019) included two metrics submitted to task 3. They constitute a unified automatic semantic machine translation quality evaluation and estimation met-ric for languages with different levels of available resources. They use BERT (Devlin et al., 2019) and semantic role-labelling as additional sources of information.
6 Results
The results for Task 1 are shown in Tables 4, 5, 6 and 7. Systems are ranked according to their F1 on the target side. The evalua-tion scripts are available athttps://github. com/deep-spin/qe-evaluation.
We computed the statistical significance of the results, and considered as winning systems the ones which had significantly better scores than all the rest withp <0.05. For the word-level task, we used randomization tests (Yeh,2000) with Bonfer-roni correction6 (Abdi, 2007); for Pearson corre-lation scores used in the sentence-level and MQM scoring tasks, we used William’s test7.
In the word-level task, there is a big gap be-tween Unbabel’s winning submission and ETRI’s, which in turn also had significantly better results than MIPT and BOUN. Unfortunately, we can-not do a direct comparison with last year’s results, since i) we now evaluate a single score for target words and gaps, which were evaluated separately before, and ii) only two systems submitted results for source words last year.
The newly proposed metric, MCC, is very well correlated with the F1-Mult. If we ranked sys-tems based on their (target) MCC, the only differ-ence would be in the EN-RU task, in which BOUN would be above the baseline. Since this metric was conceived especially for unbalanced binary clas-sification problems, it seems reasonable to use it as the primary metric for the next editions of this shared task.
6We adapted the implementation from
https://gist.github.com/varvara-l/ d66450db8da44b8584c02f4b6c79745c
7We used the implementation fromhttps://github.
Target Source
Model F1 MCC F1 MCC
†UNBABEL Ensemble 0.4752 0.4585 0.4455 0.4094 UNBABEL Stacked 0.4621 0.4387 0.4284 0.3846 ETRI BERT Multitask A 0.4061 0.3778 0.3946 0.3426 ETRI BERT Multitask B 0.4047 0.3774 0.396 0.3446 MIPT Neural CRF Transformer 0.3285 0.2896 0.2662 0.1811 MIPT Neural CRF RNN 0.3025 0.2601 0.26 0.1748
Baseline 0.2974 0.2541 0.2908 0.2126
[image:8.595.140.462.84.238.2]BOUN RTM GLMd* 0.1846 0.1793 0.0957 0.0372
Table 4: Word-level results for EN-DE.†indicates the winning system.* indicates late submissions that were not considered in the official ranking.
Target Source
Model F1 MCC F1 MCC
†UNBABEL Ensemble 2 0.478 0.4577 0.4541 0.4212 †UNBABEL Ensemble 0.4629 0.4412 0.4174 0.3729 †ETRI BERT Multitask A 0.4515 0.4294 0.4202 0.3732 ETRI BERT Multitask B 0.43 0.4082 0.4114 0.3644
Baseline 0.2412 0.2145 0.2647 0.1887
[image:8.595.151.448.321.447.2]BOUN RTM GLMd* 0.1952 0.2271 0.0871 0.0698
Table 5: Word-level results for EN-RU.†indicates the winning systems. * indicates late submissions that were not considered in the official ranking.
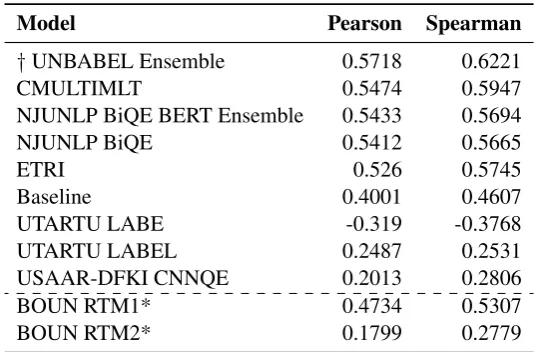
Model Pearson Spearman
†UNBABEL Ensemble 0.5718 0.6221
CMULTIMLT 0.5474 0.5947
NJUNLP BiQE BERT Ensemble 0.5433 0.5694
NJUNLP BiQE 0.5412 0.5665
ETRI 0.526 0.5745
Baseline 0.4001 0.4607
UTARTU LABE -0.319 -0.3768
UTARTU LABEL 0.2487 0.2531
USAAR-DFKI CNNQE 0.2013 0.2806
BOUN RTM1* 0.4734 0.5307
BOUN RTM2* 0.1799 0.2779
[image:8.595.164.434.531.707.2]Model Pearson Spearman
†UNBABEL Ensemble 2 0.5923 0.5388 †UNBABEL Ensemble 0.5889 0.5411
ETRI 0.5327 0.5222
CMULTIMLT 0.4575 0.4039
CMULTIMLT 2 0.4292 0.3628
UTARTU LABEL 0.4014 0.3364
Baseline 0.2601 0.2339
UTARTU LACLAS 0.0424 0.1735
BOUN RTM 1* 0.2817 0.2067
[image:9.595.183.420.63.223.2]BOUN RTM 2* 0.2314 0.1082
Table 7: Sentence-level results for EN-RU.†indicates the winning system. * indicates late submissions that were not considered in the official ranking.
Model F1
UNBABEL BERT 0.48
[image:9.595.119.246.279.331.2]Baseline 0.38
Table 8: Document-level fine grained annotation re-sults for EN-FR
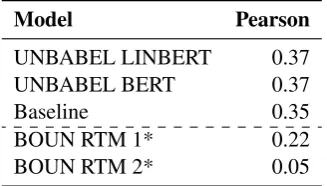
Model Pearson
UNBABEL LINBERT 0.37
UNBABEL BERT 0.37
Baseline 0.35
BOUN RTM 1* 0.22
BOUN RTM 2* 0.05
Table 9: Document-level MQM results for EN-FR. † indicates the winning system. * indicates late submis-sions.
In the sentence-level task, Unbabel achieved again the best scores, but with a tighter gap to the other participants. For EN-RU, their second sub-mission is statistically tied to ETRI’s first. Com-paring to last year’s results in EN-DE, in which the best system had a Pearson correlation of 0.51 and the median was 0.38, we see a great improvement overall. This is likely due to the more powerful pre-trained models, such as BERT and ELMo, that are common now.
In task 2 on document-level QE, Unbabel achieved the best scores again. Unbabel was also the only participant in the fine-grained annotation subtask, but surpassed the baseline by a large mar-gin. As for the MQM scoring, last year used a different test set, making results not directly
com-parable, but the best system achieved a Pearson correlation of 0.53. The test set this year is ar-guably easier because its mean MQM is closer to the training set (see Table3).
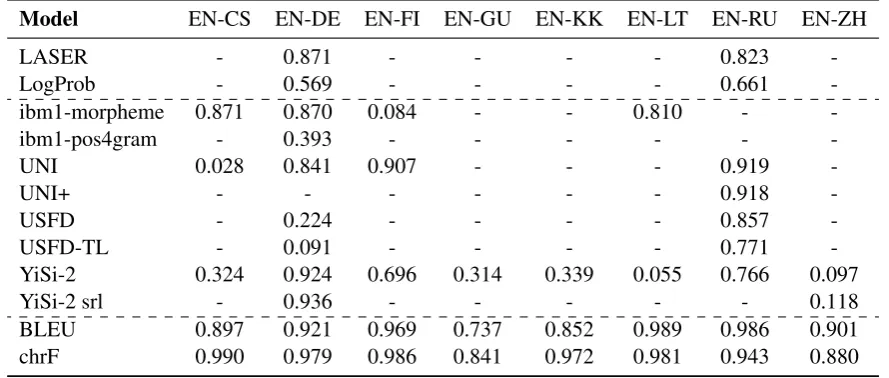
Results for Task 3 on QE as a metric and are presented in Tables10–15. These include system-level and segment-system-level evaluations; results for all language pairs of WMT19 News Translation are presented; full comparison between reference-based and referenceless metrics can be found in the metrics evaluation campaign (Graham et al., 2019).
On system-level UNI/UNI+ (UTartu) and YiSi-2/YiSi-2-srl (NRC-CNRC) show perfor-mance very close to reference-based BLEU and chrF, with the Pearson correlation even being marginally better than BLEU in single cases. The other metrics fall behind somewhat; the LASER and LogProb baselines mostly fall behind the sub-missions and reference-based metrics, especially for translations into English.
Segment-level results are much less optimistic, with most results into English being below 0.1 (practically no correlation) and 0.2 from En-glish. A notable exception is YiSi-2/YiSi-2-srl for English-German and German-Czech, where its Kendall τ correlation is very close to sentBLEU, but still behind chrF.
[image:9.595.100.264.382.475.2]Model DE-EN FI-EN GU-EN KK-EN LT-EN RU-EN ZH-EN
LASER 0.247 - - - - 0.310
-LogProb 0.474 - - - - 0.488
-ibm1-morpheme 0.345 0.740 - - 0.487 -
-ibm1-pos4gram 0.339 - - -
-UNI 0.846 0.930 - - - 0.805
-UNI+ 0.850 0.924 - - - 0.808
-YiSi-2 0.796 0.642 0.566 0.324 0.442 0.339 0.940
YiSi-2 srl 0.804 - - - 0.947
BLEU 0.849 0.982 0.834 0.946 0.961 0.879 0.899
[image:10.595.102.498.69.229.2]chrF 0.917 0.992 0.955 0.978 0.940 0.945 0.956
Table 10: Results of task 3: system-level Pearson correlations between the submitted metrics and human judgments on all translation directions into English. LASER and LogProb are the baselines. The reference-based BLEU and chrF metrics are provided for comparison.
Model EN-CS EN-DE EN-FI EN-GU EN-KK EN-LT EN-RU EN-ZH
LASER - 0.871 - - - - 0.823
-LogProb - 0.569 - - - - 0.661
-ibm1-morpheme 0.871 0.870 0.084 - - 0.810 -
-ibm1-pos4gram - 0.393 - - -
-UNI 0.028 0.841 0.907 - - - 0.919
-UNI+ - - - 0.918
-USFD - 0.224 - - - - 0.857
-USFD-TL - 0.091 - - - - 0.771
-YiSi-2 0.324 0.924 0.696 0.314 0.339 0.055 0.766 0.097
YiSi-2 srl - 0.936 - - - 0.118
BLEU 0.897 0.921 0.969 0.737 0.852 0.989 0.986 0.901
[image:10.595.77.522.296.485.2]chrF 0.990 0.979 0.986 0.841 0.972 0.981 0.943 0.880
Table 11: Results of task 3: system-level Pearson correlations between the submitted metrics and human judgments on all translation directions from English. LASER and LogProb are the baselines. The reference-based BLEU and chrF metrics are provided for comparison.
Model DE-EN FI-EN GU-EN KK-EN LT-EN RU-EN ZH-EN
LASER -0.024 - - - - 0.022
-LogProb -0.096 - - - - -0.035
-ibm1-morpheme -0.074 0.009 - - 0.069 -
-ibm1-pos4gram -0.153 - - -
-UNI 0.022 0.202 - - - 0.084
-UNI+ 0.015 0.211 - - - 0.089
-YiSi-2 0.068 0.126 -0.001 0.096 0.075 0.053 0.253
YiSi-2 srl 0.068 - - - 0.246
sentBLEU 0.056 0.233 0.188 0.377 0.262 0.125 0.323
chrF 0.122 0.286 0.256 0.389 0.301 0.180 0.371
[image:10.595.102.496.548.711.2]Model EN-CS EN-DE EN-FI EN-GU EN-KK EN-LT EN-RU EN-ZH
LASER - 0.147 - - - - -0.24
-LogProb - -0.119 - - - - -0.158
-ibm1-morpheme -0.135 -0.003 -0.005 - - -0.165 -
-ibm1-pos4gram - -0.123 - - -
-UNI 0.060 0.129 0.351 - - - 0.226
-UNI+ - - - 0.222
-USFD - -0.029 - - - - 0.136
-USFD-TL - -0.037 - - - - 0.191
-YiSi-2 0.069 0.212 0.239 0.147 0.187 0.003 -0.155 0.044
YiSi-2 srl - 0.236 - - - 0.034
sentBLEU 0.367 0.248 0.396 0.465 0.392 0.334 0.469 0.270
[image:11.595.80.521.64.252.2]chrF 0.455 0.326 0.514 0.534 0.479 0.446 0.539 0.301
Table 13: Results of task 3: segment-level Kendall τ correlations between the submitted metrics and human judgments on all translation directions from English. LASER and LogProb are the baselines. The reference-based sentBLEU and chrF metrics are provided for comparison.
Model DE-CS DE-FR FR-DE
ibm1-morpheme 0.355 0.509 0.625 ibm1-pos4gram - 0.085 0.478
YiSi-2 0.606 0.721 0.530
BLEU 0.941 0.891 0.864
[image:11.595.73.290.560.653.2]chrF 0.974 0.931 0.864
Table 14: Results of task 3: system-level Pearson cor-relations between the submitted metrics and human judgments on all translation directions without English involved. The LASER and LogProb baselines were not computed for these language pairs. The reference-based BLEU and chrF metrics are provided for com-parison.
Model DE-CS DE-FR FR-DE
ibm1-morpheme 0.048 -0.013 -0.053 ibm1-pos4gram - -0.074 -0.097
YiSi-2 0.199 0.186 0.066
sentBLEU 0.203 0.235 0.179
chrF 0.326 0.284 0.275
Table 15: Results of task 3: segment-level Kendallτ correlations between the submitted metrics and human judgments on all translation directions without English involved. The LASER and LogProb baselines were not computed for these language pairs. The reference-based sentBLEU and chrF metrics are provided for comparison.
7 Conclusions
We presented our findings in this year’s shared task on translation quality estimation. This year, the main novelties were a new task that assesses quality estimation as a metric (Task 3), a new sub-task related to document-level quality estimation (Task 2) where the goal is to predict error anno-tations and their severities, and a new dataset for English-Russian used in Task 1.
Following similar trends in other NLP tasks, a common choice from the participants this year was the usage of contextual and pre-trained embedding models such as BERT and XLM along with trans-fer learning, which includes the systems that ob-tained the best results. In the future, we plan to implement some strategies to reduce the gap for participants to enter Task 2, as this year we only had two participants. One possibility is to make available pre-processed data or word-level predic-tions, so that participants can focus more easily on document-level details.
Acknowledgments
organizers on performing the joint evaluation with our Task 3.
This work was partly funded by the European Research Council (ERC StG DeepSPIN 758969), the European Union’s Horizon 2020 research and innovation programme under grant agreement No. 825303 (project Bergamot), the Estonian Research Council grant no. 1226 and by the Fundac¸˜ao para a Ciˆencia e Tecnologia through contract UID/EEA/50008/2019.
References
H. Abdi. 2007. Bonferroni and ˇSid´ak corrections for multiple comparisons. In N. J. Salkind, editor, Ency-clopedia of Measurement and Statistics, pages 103– 107. Sage, Thousand Oaks, CA.
Mikel Artetxe and Holger Schwenk. 2018. Mas-sively multilingual sentence embeddings for
zero-shot cross-lingual transfer and beyond. CoRR,
abs/1812.10464.
Shamil Chollampatt and Hwee Tou Ng. 2018. Neural quality estimation of grammatical error correction. InProceedings of the 2018 Conference on Empirical Methods in Natural Language Processing, Brussels, Belgium.
Jacob Devlin, Ming-Wei Chang, Kenton Lee, and Kristina Toutanova. 2019. Bert: Pre-training of Deep Bidirectional Transformers for Language Un-derstanding. InProceedings of NAACL.
Chris Dyer, Victor Chahuneau, and Noah A. Smith. 2013. A simple, fast, and effective reparameteriza-tion of IBM model 2. InProceedings of NAACL.
Yvette Graham, Qingsong Ma, Johnny Tian-Zheng Wei, and Ondˇrej Bojar. 2019. Results of the WMT19 Metrics Shared Task. InProceedings of the Fourth Conference on Machine Translation (WMT), Florence, Italy.
Julia Ive, Fr´ed´eric Blain, and Lucia Specia. 2018. Deepquest: a framework for neural-based quality es-timation. InProceedings of the 27th International Conference on Computational Linguistics, pages 3146–3157.
F´abio Kepler, Jonay Tr´enous, Marcos Treviso, Miguel Vera, and Andr´e F. T. Martins. 2019. OpenKiwi: An open source framework for quality estimation. In Proceedings of ACL 2019 System Demonstrations.
Guillaume Lample and Alexis Conneau. 2019. Cross-lingual Language Model Pretraining. arXiv preprint arXiv:1901.07291.
Chi kiu Lo. 2019. YiSi - A unified semantic MT quality evaluation and estimation metric for languages with
different levels of available resources. In Proceed-ings of the Fourth Conference on Machine Transla-tion (WMT), Florence, Italy.
Andr´e F. T. Martins, Marcin Junczys-Dowmunt, Fabio N. Kepler, Ram´on Astudillo, Chris Hokamp, and Roman Grundkiewicz. 2017. Pushing the Lim-its of Translation Quality Estimation. Transactions of the Association for Computational Linguistics, 5:205–218.
B.W. Matthews. 1975. Comparison of the pre-dicted and observed secondary structure of t4 phage
lysozyme. Biochimica et Biophysica Acta (BBA)
-Protein Structure, 405(2):442 – 451.
Maja Popovi´c. 2015. chrf: character n-gram f-score for automatic mt evaluation. InProceedings of the Tenth Workshop on Statistical Machine Translation, pages 392–395, Lisbon, Portugal.
Maja Popovi´c, David Vilar, Eleftherios Avramidis, and Aljoscha Burchardt. 2011. Evaluation without ref-erences: Ibm1 scores as evaluation metrics. In Pro-ceedings of the Sixth Workshop on Statistical Ma-chine Translation, pages 99–103, Edinburgh, Scot-land. Association for Computational Linguistics.
Lucia Specia, Gustavo Paetzold, and Carolina Scar-ton. 2015. Multi-level translation quality
predic-tion with quest++. InProceedings of ACL-IJCNLP
2015 System Demonstrations, pages 115–120, Bei-jing, China. Association for Computational Linguis-tics and The Asian Federation of Natural Language Processing.
Lisa Yankovskaya, Andre T¨attar, and Mark Fishel. 2019. Quality Estimation and Translation Metrics via Pre-trained Word and Sentence Embeddings. In Proceedings of the Fourth Conference on Machine Translation (WMT), Florence, Italy.