Abstract—Structural health monitoring refers to the process of monitoring structural damage or degradation, which analyzes the characteristics of structural systems by using non-destructive sensor technology. Since the structural failure sensor data available is little and there is no evaluation index to classify them in most cases, unsupervised data mining methods are supposed to be employed. As part of efforts in applying structural health monitoring to the ShenNong Creek Bridge, we propose a unified data standardization and cluster-based approach to detect abnormal or damaged structures by grouping monitoring sites with similar behavior on the bridge. Data standardization includes two data projection algorithms, namely principal component analysis (PCA) and whitening, which are adopted for data dimensionality reduction and removal of data correlation. The proposed hybrid clustering method is a combi-nation of ISODATA and hierarchical clustering algorithm, which is applied to classify the feature data of structural damage detection. The experimental results prove that the proposed approach can effectively identify the bridge damage and improve the accuracy of using ISODATA clustering strategy alone.
Index Terms—Bridge health monitoring, Damage detection, Unsupervised learning, ISODATA, hierarchical clustering
I. INTRODUCTION
N recent years, structural health monitoring (SHM) has increasingly been applied for aging and structural damage identification strategies in transport infrastructure[1, 2].
Regarding the bridges monitoring data, it is not clear how to evaluate them in most cases due to the lack of a clear classification mark. Therefore, the clustering techniques are applied to obtain data distribution information by generating different data clusters. By observing the characteristics of clusters, the specific cluster is further analyzed to obtain the required information.
Bridge health monitoring is based on a use of statistical pattern of normal data sequences to find outliers. The clustering model trains the data monitored under normal
The manuscript was received on July 30, 2018; the study was funded by the National Natural Science Foundation of China, the Natural Science Foundation of Hubei Province and the Natural Science Foundation of Hubei Province.
Aiping Guo is with The School of Computer Science and Technology, Wuhan University of Technology, Wuhan (phone:86-13307113195, e-mail: [email protected].)
Ajuan Jiang is with The School of Computer Science and Technology, Wuhan University of Technology, Wuhan (phone:86-18107279010, E-mail: [email protected].)
Zhangyu Cheng (Corresponding author), School of Computer Science and Technology, Wuhan University of Technology (phone: 86-18375311086, Email: [email protected])
conditions to form clusters and then test the new batch of bridge data. Since the data recorded by the sensors fluctuates as the bridge structure or environmental parameters fluctuate, the outliers can be detected through the clustering model which further results in the detection of the location of the abnormal changes in bridge structure. If the cluster offset is large or the importance of the variables contributed to the model changes significantly, the structure of the bridge may change.
There are many algorithms for data clustering analysis. Alberto Diez et al. pro-posed a method based on K-Means to detect abnormal or damaged structures in bridges. In K-means, the value of K needs to be manually determined in advance and cannot be changed during the entire algorithm. When encountering high-dimensional and massive data, it is often difficult to accurately estimate the size of K, and the results are easily local optimal. Based on the K-means, the ISODATA algorithm in-creases the "merge" and "split" operations of the clustering results. While ISODATA has the disadvantage of requiring many parameters to be set, it is difficult to set reasonable parameter values at one time to cluster the desired results.
To address the above issues, we propose a combination of ISODATA and hierarchical clustering algorithms and compare its performance with ISODATA alone in bridge health monitoring data. The several advantages of the proposed approach are as follows:
1) The Initial clustering of ISODATA can adapt to changing environments. It can dynamically adjust the number of cluster centers according to the actual conditions of the samples included in each class during the clustering process.
2) The final use of hierarchical clustering can group the input data into any number we want.
3) It can be effectively applied to the clustering of big data and has high time efficiency.
The remainder of this paper is organized as follows. Section II reviews current research on bridge health monitoring. In section III, we outline the proposed hybrid clustering method, including the data preprocessing methods that will be used, ISODATA and hierarchical clustering. Section IV shows the experiments conducted to demonstrate the feasibility of our proposal, while conclusions are drawn in Section V.
II. RELATED WORK
In the process of bridge health monitoring, it is not clear that how to evaluate and classify sensor data. If only the current data is processed visually, a large amount of data resources will be wasted since they cannot be used effectively.
A Hybrid Clustering Method for Bridge
Structure Health Monitoring
Aiping Guo, Ajuan Jiang, Zhangyu Cheng
In this context, clustering and unsupervised learning methods based on SHM damage detection[3, 4] are proposed.
Cho S et al. [5] used the hierarchical clustering algorithm to
analyze the acceleration data of cable-stayed bridges, which is based on the similarity of the parameters involved in the process. Fuzzy C-means (FCM) clustering method was used to detect structural damage. Several feature extraction techniques are applied, such as data projection algorithms, principal component analysis (PCA) and kernel principal component analysis (KPCA) [6]. K-means, Gaussian Mixture
Model (GMM), Support Vector Clustering (SVC) and Self-Organizing Map (SOM) are typical clustering-based algorithms for statistical modeling and feature classification in SHM[7]. The Gaussian mixture model (GMM) combining
with novelty detection was proposed to classify different modal parameters into clusters and eliminate the effect of ambient temperature on the bridge vibration frequency to detect bridge damage[8].Diez A et al. [1] proposed a method
based on K-means to group similar joints on a bridge and then detect abnormal or damaged joints. In[9], Alamdari MM et al.
used spectrum-driven features based on the Spectral Moments (SMs) to determine the response of jack arches to traffic inputs and applied modified K-means clustering algorithm to identify jack arches with anomalous responses. The Adaptive Core Spectral Clustering (AKSC) proposed in [10] is
initialized and calibrated at the undamaged stage, and it can automatically identify new mechanisms that may be related to failures. Silva M et al. proposed a novel cluster-based method named as agglomerative concentric hypersphere (ACH), to detect the structural damage in the engineering structure by automatically discovering the optimal number of clusters through a direct clustering process[11].
III. PROPOSED HYBRID CLUSTERING METHOD This section describes the proposed clustering approach for SHM of bridges. The approach is a combination of PCA whitening for feature extraction, ISODATA for initial clustering, and hierarchical clustering algorithm to get result. The feature dimension of the bridge monitoring data is relatively high, whose numerical range is also very different. It is difficult to use it directly. Therefore, PCA and whitening techniques are applied to feature ex-traction, as can be seen in Sec 3.1. Then, a hybrid clustering technique based on ISODATA and hierarchical clustering is employed to train models from available data that can characterize normal structural behavior. These two methods are explained in detail in Sec 3.2 and 3.3. After the model training is completed, the new bridge monitoring data sample will be input into the model and calculate its distance from the cluster centers, which is the key to determine whether the data is abnormal.
A. Data Preprocessing for Feature Extraction
The main bridge of ShenNong Creek Bridge is the monitoring object in this paper. In the health monitoring system, various feature data such as beidou, cracks, and azimuth displacements recorded by many sensors are stored. Since the data come from a direct measurement of the sensor, they may contain missing or invalid values, which will be supplemented with previous historical data. After that, we will
perform two important preprocessing operations on the raw data.
a. PCA for Dimensionality Reduction
The characteristic dimension of bridge monitoring data is relatively high, which will greatly affect the results of cluster analysis. To speed up data processing, PCA is employed to reduce the dimensionality of the high-dimensional variable space. By transforming the original data into a set of linearly independent representations of each dimension through linear transformation, PCA can optimally simplify the multivariate data table while maintaining the mini-mum loss of data information.
Suppose the input dataset is represented as . First, calculate the covariance matrix using formula (1):
(1)
Then, the eigenvector U of Σ can be computed and arranged in columns as follows:
.
(2)Here, is the main feature vector, which corresponds to the largest feature value. And, is a sub-feature vector. In addition, is the corresponding characteristic value (decrease in value).
Let ,which represents the first
k eigenvectors taken. Finally, the k-dimensional data obtained after dimension reduction can be calculated by the following formula (3):
.
(3)b. Whitening for Correlation Removal
The range of values of bridge monitoring data of different features varies greatly, which will affect the results of data analysis. The whitened data satisfies two conditions: 1) the correlation between different features is the smallest, close to 0; 2) all the features have the same variance. Since the first operation of PCA whitening is to reduce the PCA of the data, it has already been completed in the previous step. Here only the second step is needed to normalize the data variance. Calculated as follows:
(4)
B. ISODATA for Initial Clustering
adjust the number of cluster centers by setting initial parameters and using the merge and split mechanisms. The detailed algorithm process is as follows.
The procedure of ISODATA algorithm
Step1: Select samples randomly from the dataset as the
initial cluster center .
Step 2: For each sample in the dataset, calculate its distance to cluster centers and classify it into the cluster center corresponding to the smallest distance.
Step 3: Determine whether the number of elements in each of the above clusters is less than . If the elements number of a cluster is less than , then the cluster needs to be discarded. Let , and redistribute the samples in this cluster to the cluster with the smallest distance in the rest of clusters.
Step 4: Recalculate its cluster center for each cluster : .
Step5: If the current , it indicates that the current clusters number is too small to perform a split operation. If the current , indicating that the current clusters number is too much to perform a merge operation.
Step6: Terminate the experiment if the maximum number of iterations is reached, otherwise return to step 2 to continue it.
C. Hierarchical Clustering
Hierarchical clustering is a kind of clustering algorithm. It creates a hierarchical nested clustering tree by calculating the similarity between different data points. In the cluster tree, different clusters of raw data points are the lowest levels of the tree, and the top level of the tree is the root node of a cluster. We can crop at any height of the tree to get the desired number of clusters. Fig. 1 is a simple clustering tree visualization. The bottom of the hierarchy is the seven data points of the original A to G. According to the similarity between seven data points, it is divided into the second layer (A, F), (B, C), (D, E) and G of the cluster tree, and so on.
Fig 1. A simple hierarchical clustering tree.
Hierarchical clustering applies Euclidean distances to calculate the distance (similarity) between data points of different clusters, whose formula is as follows:
. (5)
Due to the principle of hierarchical clustering algorithm, it will generate a high dimensional distance matrix when dealing with a large amount of data, leading to a decrease in
time efficiency. Thus, it is not suitable for clustering with massive data. The proposed algorithm model applies ISODATA to perform initial clustering on a large amount of data, which solves the above problems and further uses hierarchical clustering to improve the ISODATA clustering effect.
IV. EXPERIMENTS
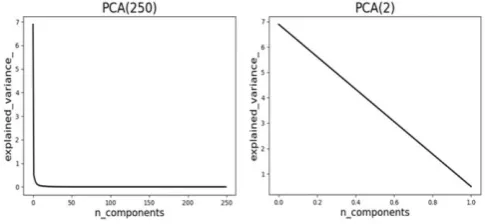
Our experimental dataset comes from monitoring data collected from 17:00:00 on May 29, 2017 to March 24, 2018. Since the frequency of sensor recording at each position of the bridge is not consistent, we use the value of the previous time to supplement the missing data at intervals of one hour. Then, PCA and whitening are per-formed on the completed data. For the determination of the feature dimension in dimension reduction, we performed two different treatments, namely reducing the original data to 250 dimensions and 2 dimensions, respectively. The results are shown in Fig. 2 We will compare the clustering effects of these two PCA datasets later.
Fig 2. (Left) 250-dimensions data and (Right) 2-dimensions data.
At the clustering stage, we conducted comparative experiments using only ISODATA and using the proposed method. Calinski-Harabasz index is applied to describe the clustering effect of the algorithm. As an indicator of the evaluation model, the higher the Calinski-Harabasz index indicates that the samples between each cluster are as close as possible, and the distances between the samples of different clusters are as far apart as possible, which also means that the better the clustering effect is.
A. Results of Only ISODATA
[image:3.595.304.547.314.426.2]Fig 3. (Left) the clustering result of 250-dimensions dataset. (Right) the clustering result of 2-dimensions dataset.
Table Ⅰ shows the corresponding Calinski-Harabasz values. The experimental results show that reducing the original data to 2 dimensions can be better used for clustering. The existence of too many columns with the same attributes in the original data is not conducive to accurate clustering. In the next section, only dataset with two dimensions is considered.
Table Ⅰ The Clustering Effect
Algorithm Calinski-Harabasz Index
PCA (250) PCA (2)
ISODATA 26.3 13836.9
B. Results of The Proposed Method
In this section, the proposed hybrid clustering algorithm is applied to train the clustering model on the 2-dimensions dataset. We started with an initial cluster using ISODATA.
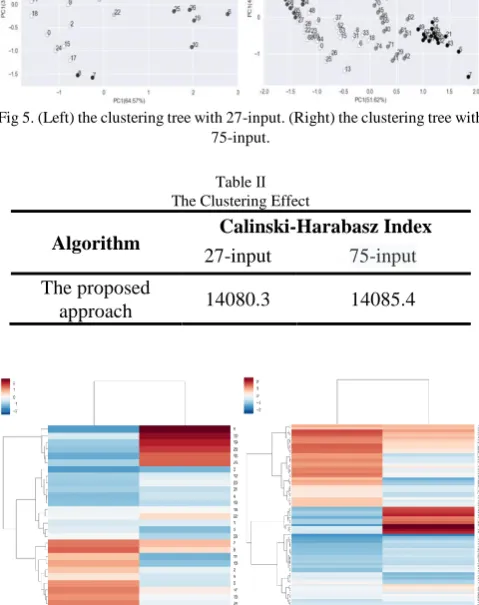
After multiple parameters adjustment experiments, we selected the cluster numbers 27 and 75. Then the cluster centers are input into the hierarchical clustering algorithm for further clustering. The resulting hierarchical clustering trees are shown in Fig 4.
Fig 4. (Left) the clustering tree with 27-input. (Right) the clustering tree with 75-input.
The tree diagram in Fig 3 shows the intermediate process of hierarchical clustering. We can crop at the specified position on the y-axis to get the desired number of clusters. In this paper, the number of clusters is set to 5. To visualize the clustering results, we apply PCA to find the scatter coordinates that occupy the two dimensions with the largest variance, and then plot the results.
Fig 5 show that one cluster is obviously farther from the other four clusters, which implies that the corresponding original sample data might have problems that should be detected. Since we do not have a priori knowledge of the existence of abnormal data, we can only try to separate outliers from the normal data that are dominant in quantity.
Further, the heatmaps of the input data to the hierarchical clustering process have been drawn, as in Fig 6. The redder the color the higher the difference between data.
[image:4.595.51.286.51.173.2]Fig 5. (Left) the clustering tree with 27-input. (Right) the clustering tree with 75-input.
Table Ⅱ The Clustering Effect
Algorithm Calinski-Harabasz Index
27-input 75-input The proposed
approach 14080.3 14085.4
Fig 6. (Left) the heatmap with 27-input. (Right) the heatmap with 75-input.
Similarly, we use Calinski-Harabasz index to evaluate the clustering effect of the proposed method. It can be seen from Table Ⅱ that the combined algorithm of ISODATA and hierarchical clustering has higher scores for bridge monitoring data, which means that it has better clustering performance than ISODATA alone.
C. Online Damage Detection
After the training is completed, the positions of the clusters center are determined and a preliminary cluster analysis model is thus obtained. For the newly-introduced bridge monitoring data, after the data preprocessing is performed, the distances be-tween it and the centers of the model clusters are calculated. If the distances are far from the normality, which can be considered as potential damage data.
V. CONCLUSIONS
[image:4.595.306.548.102.197.2] [image:4.595.306.546.149.452.2] [image:4.595.46.289.498.610.2]and whitening techniques were employed to reduce the dimensionality and correlation of bridge monitoring data. Based on the 250-dimensions and 2-dimensions datasets obtained after preprocessing, we conducted a comparative clustering experiment to select the most appropriate dataset. To verify the advantages of the proposed approach, we also conducted comparative experiments with only ISODATA. This work applies the Calinski-Harabasz index to evaluate the clustering results. The results show that our method has improved by more than 400 points on the same dataset, which is proved to be more efficient for clustering. Finally, the trained model successfully detected abnormal samples, which proved the validity of the proposed method for bridge damage detection.
REFERENCES
[1] Diez A, Khoa NLD, Alamdari MM, Wang Y, Chen F, Runcie P. A clustering approach for structural health monitoring on bridges[J]. Journal of Civil Structural Health Monitoring. 2016,6(3):429-45. [2] CR F, K W. An introduction to structural health monitoring[J].
Philosophical Transactions: Mathematical, Physical and Engineering Sciences. 2007,365(1851):303-15.
[3] Fugate ML, Sohn H, Farrar CR, editors. Unsupervised learning methods for vibration-based damage detection. Proceedings of 18th International Modal Analysis Conference–IMAC; 2000.
[4] Deraemaeker A, Worden K. A comparison of linear approaches to filter out environmental effects in structural health monitoring[J]. Mechanical Systems & Signal Processing. 2018,105:1-15.
[5] Cho S, Jo H, Jang S, Park J, Jung H-J, Yun C-B, et al. Structural health monitoring of a cable-stayed bridge using wireless smart sensor technology: data analyses[J]. Smart Structures and Systems. 2010,6(5-6):461-80.
[6] Yu L, Zhu J-h, Yu L-l. Structural damage detection in a truss bridge model using fuzzy clustering and measured FRF data reduced by principal component projection[J]. Advances in Structural Engineering. 2013,16(1):207-17.
[7] Santos A, Figueiredo E, Costa J. Clustering studies for damage detection in bridges: A comparison study[J]. Structural Health Monitoring 2015. 2015.
[8] Yang C, Liu Y, Sun Y. Damage Detection of Bridges Considering Environmental Temperature Effect by Using Cluster Analysis ☆[J]. Procedia Engineering. 2016,161:577-82.
[9] Alamdari MM, Rakotoarivelo T, Khoa NLD. A spectral-based clustering for structural health monitoring of the Sydney Harbour Bridge[J]. Mechanical Systems & Signal Processing. 2017,87:384-400.
[10] Langone R, Reynders E, Mehrkanoon S, Suykens JA. Automated structural health monitoring based on adaptive kernel spectral clustering[J]. Mechanical Systems and Signal Processing. 2017,90:64-78.