Common variants at 12q14 and 12q24 are associated with
hippocampal volume
Joshua C. Bis1, Charles DeCarli2, Albert Vernon Smith3,4, Fedde van der Lijn5,6, Fabrice Crivello7,8,9, Myriam Fornage10,11, Stephanie Debette12,13,14, Joshua M. Shulman15,16, Helena Schmidt17, Velandai Srikanth18,19, Maaike Schuur20,21, Lei Yu22, Seung-Hoan Choi23, Sigurdur Sigurdsson3, Benjamin F.J. Verhaaren6,24, Anita L. DeStefano23,25,26, Jean-Charles Lambert27,28,29, Clifford R. Jack Jr.30, Maksim Struchalin20, Jim
Stankovich19, Carla A. Ibrahim-Verbaas20,21, Debra Fleischman22,31,32, Alex Zijdenbos33, Tom den Heijer21,24,34, Bernard Mazoyer7,8,9, Laura H. Coker35, Christian Enzinger36, Patrick Danoy37, Najaf Amin20, Konstantinos Arfanakis22,38, Mark A. van Buchem39, Renée F.A.G. de Bruijn21,24, Alexa Beiser23,25,26, Carole Dufouil12, Juebin Huang40, Margherita Cavalieri36, Russell Thomson19, Wiro J. Niessen5,6,41, Lori B. Chibnik15,16, Gauti K. Gislason3, Albert Hofman24,42, Aleksandra Pikula25, Philippe Amouyel27,28,29,43, Kevin B. Freeman44, Thanh G. Phan18, Ben A. Oostra20,45, Jason L. Stein46, Sarah E.
Medland47,48,49, Alejandro Arias Vasquez50,51, Derrek P. Hibar46, Margaret J. Wright47, Barbara Franke50,51, Nicholas G. Martin47, Paul M. Thompson46 for the ENIGMA Consortium, Michael A. Nalls52, Andre G. Uitterlinden42,53, Rhoda Au25,26, Alexis Elbaz12,54, Richard J. Beare18,55, John C. van Swieten21, Oscar Lopez56,57,58, Tamara B. Harris59, Vincent Chouraki27,28,29, Monique M.B. Breteler60,61,62, Philip L. De Jager15,16,63, James T. Becker56,57,58, Meike W. Vernooij6,24, David Knopman64, Franz Fazekas36, Philip A. Wolf25,26, Aad van der Lugt6, Vilmundur Gudnason3,4, W.T. Longstreth Jr.65,66, Mathew A. Brown67, David A. Bennett22, Cornelia M. van Duijn20,42,68, Thomas H. Mosley40,69,
Joshua C. Bis, Charles DeCarli, Albert Vernon Smith, Fedde van der Lijn, Fabrice Crivello, Myriam Fornage and Stephanie Debette contributed equally as first authors.
Cornelia M. van Duijn, Thomas H. Mosley, Reinhold Schmidt, Christophe Tzourio, Lenore J. Launer, M. Arfan Ikram and Sudha Seshadri contributed equally as last authors.
Jason L. Stein, Sarah E. Medland, Alejandro Arias Vasquez, Derrek P. Hibar, Margaret J. Wright, Barbara Franke, Nicholas G. Martin and Paul M. Thompson represent the ENIGMA consortium.
Author Contributions: Study concept and design:
J.C.B., C.De., M.A.v.B., C.Du., P.A., A.G.U., M.M.B.B., F.F., M.A.B., C.M.v.D., T.H.M., C.T., L.J.L., M.A.I., S.Se.
Acquisition of the data:
F.v.d.L., F.C., H.S., V.S., M.Sc., S.Si., B.F.J.V., J.L., C.R.J.J., J.S., D.F., T.d.H., B.M., L.H.C., C.E., P.D., K.A., M.A.v.B., A.B., C.Du., J.H., W.J.N., G.K.G., P.A., K.B.F., T.G.P., B.A.O., A.G.U., R.A., A.E., R.J.B., J.C.v.S., M.M.B.B., M.W.V., P.A.W., A.v.d.L., V.G., M.A.B., D.A.B., C.M.v.D., T.H.M., R.S., C.T., L.J.L., M.A.I., S.Se.
Statistical analysis and interpretation of the data:
J.C.B., C.De., A.V.S., F.v.d.L., M.F., S.D., J.M.S., H.S., V.S., M.Sc., L.Y., S.C., B.F.J.V., A.L.D., M.St., J.S., C.A.I.V., N.A., R.F.d.B., M.C., R.T., L.B.C., G.K.G., P.A., A.E., R.J.B., P.L.D.J., M.A.B., D.A.B., R.S., L.J.L., M.A.I.
Drafting the manuscript:
J.C.B., C.De., J.M.S., H.S., M.Sc., B.M., P.L.D.J., L.J.L., S.Se.
Critical revision of the manuscript:
J.C.B., C.De., F.v.d.L., M.F., S.D., J.M.S., H.S., V.S., S.C., S.Si., A.L.D., J.L., J.S., C.A.I.V., A.Z., T.d.H., L.H.C., C.E., P.D., C.Du., M.C., R.T., W.J.N., L.B.C., A.H., A.P., K.B.F., T.G.P., J.L.S., S.E.M., A.A.V., D.P.H., M.J.W., B.F., N.G.M., P.M.T., M.A.N., A.G.U., A.E., R.J.B., O.L., T.B.H., V.C., M.M.B.B., J.T.B., M.W.V., D.K., F.F., P.A.W., A.v.d.L., V.G., W.L.J., M.A.B., C.M.v.D., T.H.M., R.S., C.T., L.J.L., M.A.I., S.Se.
Obtained funding:
M.F., H.S., V.S., C.Du., W.J.N., A.H., B.A.O., A.G.U., J.C.v.S., T.B.H., V.C., M.M.B.B., F.F., P.A.W., A.v.d.L., V.G., D.A.B., C.M.v.D., T.H.M., R.S., C.T., L.J.L., S.Se.
NIH Public Access
Author Manuscript
Nat Genet
. Author manuscript; available in PMC 2012 November 01.Published in final edited form as:
Nat Genet. ; 44(5): 545–551. doi:10.1038/ng.2237.
NIH-PA Author Manuscript
NIH-PA Author Manuscript
Reinhold Schmidt36, Christophe Tzourio70,71, Lenore J. Launer51, M. Arfan Ikram6,24,42, and Sudha Seshadri25,26for the CHARGE Consortium
1Cardiovascular Health Research Unit, Department of Medicine, University of Washington,
Seattle, WA, USA 2Department of Neurology and Center of Neuroscience, University of California
at Davis, Sacramento, CA, USA 3Icelandic Heart Association, Kopavogur, Iceland 4University of
Iceland, Faculty of Medicine, Reykjavik, Iceland 5Department of Medical Informatics, Erasmus
MC University Medical Center, Rotterdam, The Netherlands 6Department of Radiology, Erasmus
MC University Medical Center, Rotterdam, The Netherlands 7Univ. Bordeaux, Neurofunctional
Imaging Group, UMR 5296, F-33000 Bordeaux, France 8Centre National de la Recherche
Scientifique (CNRS), Neurofunctional Imaging Group, UMR 5296, F-33000 Bordeaux, France
9Commissariat à l’Energie Atomique (CEA), Neurofunctional Imaging Group, UMR 5296, F-33000
Bordeaux, France 10Brown Foundation Institute of Molecular Medicine, The University of Texas
Health Sciences Center at Houston, Houston, TX, USA 11Human Genetics Center School of
Public Health, The University of Texas Health Sciences Center at Houston, Houston, TX, USA
12INSERM, U708, Neuroepidemiology, F-75013, Paris, France 13Department of Epidemiology,
University of Versailles St-Quentin-en-Yvelines, France 14Department of Neurology, Boston
University School of Medicine, Boston, MA, USA 15Program in Translational NeuroPsychiatric
Genomics, Institute for the Neurosciences, Department of Neurology, Brigham and Women’s Hospital, Boston, MA, USA 16Program in Medical and Population Genetics, Broad Institute,
Cambridge, MA, USA 17Institute of Molecular Biology and Biochemistry, Medical University Graz,
Austria 18Stroke and Ageing Research Centre, Southern Clinical School, Department of Medicine,
Monash University, Melbourne, Australia 19Menzies Research Institute Tasmania, University of
Tasmania, Hobart, Australia 20Genetic Epidemiology Unit, Department of Epidemiology, Erasmus
MC University Medical Center, Rotterdam, The Netherlands 21Department of Neurology, Erasmus
MC University Medical Center, Rotterdam, The Netherlands 22Rush Alzheimer’s Disease Center,
Rush University Medical Center, Chicago, IL, USA 23Department of Biostatistics, Boston
University School of Public Health, Boston, MA, USA 24Department of Epidemiology, Erasmus
MC University Medical Center, Rotterdam, The Netherlands 25Department of Neurology, Boston
University School of Medicine, Boston, MA, USA 26The National, Heart, Lung and Blood
Institute’s Framingham Heart Study, Framingham, MA, USA 27INSERM Unit 744, Lille, France 28Institut Pasteur de Lille, Lille, France 29Université Lille Nord de France, Lille, France
30Department of Radiology, Mayo Clinic, Rochester, MN, USA 31Department of Neurological
Sciences, Rush University Medical Center, Chicago, IL, USA 32Department of Behavioral
Sciences, Rush University Medical Center, Chicago, IL, USA 33Biospective Inc., Montreal,
Canada 34Department of Neurology, Sint Franciscus Gasthuis, Rotterdam, the Netherlands 35Division of Public Health Sciences, Wake Forest School of Medicine, Winston-Salem, NC, USA 36Department of Neurology, Medical University Graz, Austria 37University of Queensland,
Diamantina Institute, Princess Alexandra Hospital, Brisbane, Australia 38Department of
Biomedical Engineering, Illinois Institute of Technology, Chicago, IL, USA 39Department of
Radiology, Leiden University Medical Center, Leiden, the Netherlands 40Department of
Neurology, University of Mississippi Medical Center, Jackson, MS, USA 41Faculty of Applied
Sciences, Delft University of Technology, Delft, the Netherlands 42Netherlands Consortium for
Healthy Ageing, Leiden, the Netherlands 43Centre Hospitalier Régional Universitaire de Lille, Lille,
France 44Department of Psychiatry and Human Behavior, University of Mississippi Medical
Center, Jackson, MS, USA 45Department of Clinical Genetics, Erasmus MC University Medical
Center, Rotterdam, The Netherlands 46Laboratory of Neuro Imaging, David Geffen School of
Medicine, UCLA, Los Angeles, CA, USA 47Genetic Epidemiology Laboratory, Queensland
Institute of Medical Research, Brisbane, Australia 48Quantitative Genetics, Queensland Institute
of Medical Research, Brisbane, Australia 49Broad Institute of Harvard and MIT, Cambridge, MA,
USA 50Department of Human Genetics, Radboud University Nijmegen Medical Centre, Nijmegen,
The Netherlands 51Department of Psychiatry, Donders Institute for Brain, Cognition and
NIH-PA Author Manuscript
NIH-PA Author Manuscript
Behaviour, Radboud University Nijmegen Medical Centre, Nijmegen, The Netherlands
52Laboratory of Neurogenetics, Intramural Research Program, National Institute of Aging, NIH,
Bethesda, MD, USA 53Department of Internal Medicine, Erasmus MC University Medical Center,
Rotterdam, the Netherlands 54UPMC Univ Paris 06 UMR_S708, Neuroepidemiology, FY75005,
Paris, France 55Developmental Imaging Group, Murdoch Childrens Research Institute, The Royal
Children’s Hospital, Flemington Rd, Parkville, Victoria, Australia 56Department of Neurology,
University of Pittsburgh School of Medicine, Pittsburgh, PA, USA 57Department of Psychiatry,
University of Pittsburgh School of Medicine, Pittsburgh, PA, USA 58Department of Psychology,
University of Pittsburgh School of Medicine, Pittsburgh, PA, USA 59Laboratory of Epidemiology,
Demography, and Biometry, National Institute of Health, Bethesda, MD, USA 60Population Health
Sciences, German Center for Neurdegenerative Diseases (DZNE), Bonn, Germany 61Population
Health Sciences, University of Bonn, Bonn, Germany 62Department of Epidemiology, Harvard
School of Public Health, Harvard University, Boston, MA, USA 63Harvard Medical School, Boston,
MA, USA 64Department of Neurology, Mayo Clinic, Rochester, MN, USA 65Department of
Neurology, University of Washington, Seattle, WA, USA 66Department of Epidemiology,
University of Washington, Seattle, WA, USA 67University of Queensland Diamantina Institute,
Princess Alexandra Hospital, Woolloongabba, Brisbane, Australia 68Center for Medical Systems
Biology, Netherlands Genomics Initiative, Leiden University Medical Center, Leiden, The Netherlands 69Department of Medicine (Geriatrics), University of Mississippi Medical Center,
Jackson, MS, USA 70Univ. Bordeaux, U708, F-33000 Bordeaux, France 71INSERM,
Neuroepidemiology U708, F-33000, Bordeaux, France
Abstract
Aging is associated with reductions in hippocampal volume (HV) that are accelerated by Alzheimer’s disease and vascular risk factors. Our genome-wide association study of dementia-free persons (n=9,232) identified 46 SNPs at four loci with p-values <4.0×10⁻⁷. Two additional samples (n=2,318) replicated associations at 12q24 within MSRB3/WIF1 (discovery + replication, rs17178006; p=5.3×10⁻¹¹) and at 12q14 near HRK/FBXW8 (rs7294919; p=2.9×10⁻¹¹). Remaining associations included one 2q24 SNP within DPP4 (rs6741949; p=2.9×10⁻⁷) and nine 9p33 SNPs within ASTN2 (rs7852872; p=1.0×10⁻⁷) that were also associated with HV (p<0.05) in a third younger, more heterogeneous sample (n=7,794). The ASTN2 SNP was also associated with decline in cognition in a largely independent sample (n=1,563). These associations implicate genes related to apoptosis (HRK), development (WIF1), oxidative stress (MSR3B), ubiquitination (FBXW8), enzymes targeted by new diabetes medications (DPP4), and neuronal migration (ASTN2), indicating novel genetic influences that influence hippocampal size and possibly the risk of cognitive decline and dementia.
Differences in hippocampal volume (HV) that appear with advancing age represent
cumulative effects of early life factors, life-course events, and disease. Hippocampal atrophy is a recognized biological marker of Alzheimer’s disease (AD)1,2; however, it is influenced by various vascular and metabolic factors3,4. Because HV is a heritable5 widely measurable trait that exhibits meaningful detectable changes throughout the lifespan, it is a suitable endophenotype for aging-related physiological processes and presymptomatic diseases, improving power to detect genetic associations.
We explored genetic influences on HV by conducting a cross-sectional genome-wide association analysis in the Cohorts for Heart and Aging Research in Genomic Epidemiology (CHARGE) Consortium6 among 9,232 dementia-free persons from eight community-based studies whose mean age ranged from 56 to 84 years (weighted average, 67.1 years). Each study imputed to a common set of Phase II HapMap CEU SNPs using genotype data from
NIH-PA Author Manuscript
NIH-PA Author Manuscript
Illumina or Affymetrix arrays; fit additive genetic models associating total hippocampal volume and genotype dosage with adjustment for age, sex, and familial relationships (if applicable, see Supplementary Note); and applied genomic control. Study-specific results were combined in an inverse-variance weighted meta-analysis.
We then conducted in-silico replication of our genome-wide significant associations and sought additional evidence for suggestive associations in a second-stage targeted meta-analysis of 2,318 subjects from two community-based studies: the Three City study and an independent sample from the third expansion of the Rotterdam study. Characteristics of the discovery and replication samples are shown in Supplementary Table 1.
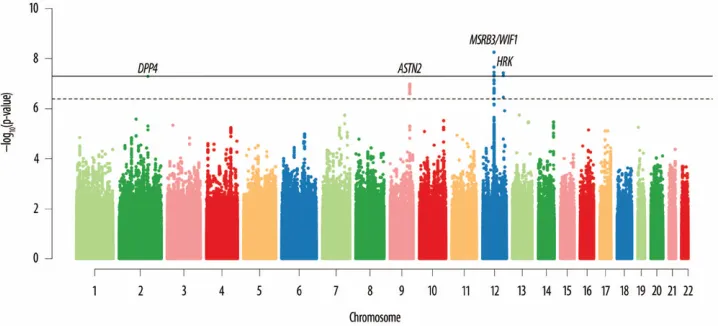
Figure 1 provides a Manhattan plot of -log10(values) from the discovery analysis, where p-values for 46 SNPs at four loci (Supplementary Table 2) surpassed our replication threshold of p<4.0×10⁻⁷ —corresponding to one expected false positive. Of these, 18 SNPs at 2 loci surpassed a genome-wide significant threshold of p<5.0×10⁻⁸: 12q14, which included WIF1, LEMD3, and MSRB3, and 12q24, which included HRK and FBXW8. We found evidence of replication (p<0.01) for both associations. The remaining suggestive associations included SNPs on 2q24 within DPP4 and on 9p33 within ASTN2, which had consistent directions of association in the replication phase, but did not attain genome-wide significance in a combined analysis. Estimates for each stage are shown in Table 1; discovery GWAS results for the each signal’s surrounding region annotated with recombination rates and known genes are shown in Figure 2; and study-specific findings appear in Figure 3.
Below, we present association estimates for a meta-analysis combining the discovery and replication results for these four loci. To contextualize the magnitude of a SNP’s association with HV, we divided the regression coefficient for the allele by the mean decrease in HV for each year of chronological age (-27.4 mm3 per year, estimated within the Framingham Heart Study).
The strongest association was for rs7294919, located on 12q24 between HRK and FBXW8, where each copy of the T allele (allele frequency [AF] = 0.91) was associated with lower HV (β=−107.8 mm3, p=2.9×10⁻¹¹), equivalent to 3.9 years of aging.
HRK is expressed throughout the brain with highest levels in the amygdala, entorhinal cortex, and hippocampus7. It acts as a key regulator of apoptosis8, a complex pathway associated with aging, ischemia, and AD9 through its interaction with death-repressor proteins Bcl-2 and Bcl-X(L)10. In rat neuronal cell cultures, a homologous protein, DP5 (72% identity), is induced during Aβ-mediated cytotoxicity, withdrawal of nerve growth factor (NGF)11, and induced global ischemia12. While treatment strategies aimed at modifying the apoptotic pathway have yet to achieve success13, our findings suggest this area of therapeutics might remain promising.
FBXW8 encodes the substrate-recognition component of an SCF (skip1, cullin1, F-box) E3 ubiquitin ligase found in the golgi apparatus of neurons. Different E3 ligase complexes target specific substrates for polyubiquitination leading to proteosome degradation14, suggesting a role in clearing abnormal and potentially toxic protein aggregates, particularly hyperphosphorylated tau15. Its role in presynaptic development16, synapse formation, neurotransmitter release, and promotion of dendrite growth in hippocampal neurons makes a genetic association with HV plausible17. Whether one or both HRK and FBXW8 are involved in determining HV is unclear since rs7294919 is an eSNP associated with changes in both18-21.
At the 12q14 locus, the G allele for rs17178006, intronic within MSRB3 (AF=0.10), was associated with decreased HV (β=−123.8 mm3, p=5.3×10⁻¹¹) equivalent to 4.5 years of
NIH-PA Author Manuscript
NIH-PA Author Manuscript
aging. MSRB3 catalyzes the reduction of methionine R-sulfoxide residues in proteins and requires zinc or selenium as a cofactor. Thus, the association of lower selenium levels with elevated plasma homocysteine, which in turn has been associated with an increased risk of AD and hippocampal atrophy 22-24, may be mediated by suppression of MsrB in various organs including the brain25. Several SNPs in low linkage disequilibrium (r2=0.2) with rs17178006 were also associated with decreased HV, including rs6581612 (AF=0.27, β= −63.3 mm3, p=7.2×10⁻¹¹) between WIF1 and LEMD3. WIF1 inhibits extracellular signaling Wnt proteins, which play a role in embryonic development—along with β-catenin—and hippocampal aging26. Changes in Wnt signaling mimic the effects of environmental enrichment increasing hippocampal synaptic densities27. LEMD3 is a transforming growth factor-beta antagonist expressed in the hippocampus and upregulated protectively during ischemia and epileptogenesis28-30. Further, it interacts with progerin, the abnormal form of laminin A responsible for premature aging in progeria (Hutchinson-Gilford syndrome)31.
When testing for independent effects of these two SNPs in conditional models, both associations were attenuated, but only rs17178006 remained significant (p<0.05,
Supplementary Figure 1), suggesting that the SNPs mark a single locus. Whereas MSRB3 may be most influential, it remains possible that more than one gene in this region is associated with HV. For example, 8 eSNPs in the vicinity of this locus (Supplementary Table 3) were associated with HV at a p-value ≤5.3×10⁻⁴ and have been reported to modify LEMD3 expression.
In addition to the strong findings discussed above, SNPs at two additional loci showed suggestive evidence for association, but did not reach genome-wide significance in our combined meta-analysis. The first was rs6741949 in a DPP4 intron on chromosome 2q24, where the G allele (AF=0.53) was associated with smaller hippocampal volume (β=−52.8 mm3, p=2.9×10⁻⁷). Many bioactive peptides whose levels are altered in AD and vascular brain injury are substrates for DPP432, and DPP4 reduces extracellular β-amyloid deposition in mouse models of AD33. Further, DPP4 is an intrinsic membrane glycoprotein and a widely expressed serine exopeptidase34. It is also an adipokine over expressed in visceral adipose tissue of obese persons and those with diabetes35, conditions associated with smaller HV3,36. A novel class of antidiabetic medications (sitagliptin, and related incretin
compounds) inhibits DPP4 to improve insulin sensitivity and glucose tolerance through increased levels of glucagon like proteins-1 and 2 (GLP-1, -2). Interestingly, endogenous incretin GLP-1 is also heavily expressed in some hippocampal neurons and has
neuroprotective properties37-39.
The second suggestive association was for rs7852872, located in an ASTN2 intron on chromosome 9 where the C allele (AF=0.63) was associated with lower hippocampal volume (β=−47.7 mm3, p= 1.0×10⁻⁷). ASTN2 is a cell adhesion molecule expressed in neurons, including those in the dentate gyrus and hypothesized to function in glial-guided neuronal migration40, 41.
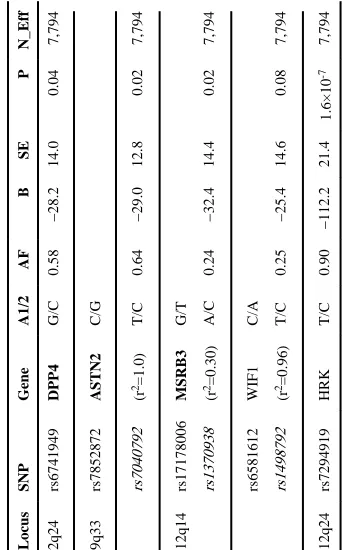
We sought additional replication of our significant and suggestive associations by testing the lead (or proxy) SNP from each locus in the Enhancing Neuro Imaging Genetics through Meta Analysis (ENIGMA) consortium. Briefly, this group (n=7,794, mean age 39.9 years) combined multiple studies including normal older individuals, a developmental sample, and cases symptomatic for cognitive or affective diseases. Among the ENIGMA sample, we observed a consistent direction of association for all cross-study comparisons. For the loci where the lead SNP was available in ENIGMA, replication was strongest at HRK/FBXW8 (rs7294919, p=1.6×10⁻⁷) and nominal at DPP4 (rs6741949, p=0.04). While the lead SNPs were not available at the other loci, one proxy SNP in weak (r2 = 0.3) linkage disequilibrium
NIH-PA Author Manuscript
NIH-PA Author Manuscript
with rs17178006 (MSRB3) and another in strong LD with rs7852872 (ASTN2) both had p-values< 0.05 in ENIGMA (Table 2).
Because the ENIGMA and CHARGE samples differed in two key aspects—ENIGMA’s inclusion of younger adults (8 of 13 studies had no participants older than 65 years) and of some persons with cognitive impairment and dementia (13% of the sample)—we examined the top loci in subsamples of healthy persons (n=5,775, mean age 34.8 years) and of cognitively intact older persons (n=816, mean age 67.2 years). Association estimates, were generally similar to those of the full sample (Supplementary Table 4).
Given the established relationship between hippocampal atrophy and AD, we investigated whether SNPs from published AD GWAS42-46 were associated with HV in our discovery meta-analysis (Supplementary Table 5). We found nominal associations of risk alleles in four AD genes with smaller HV: APOE (p=0.005), BIN1 (p=0.02), MS4A4E (p=0.001) and TOMM40 (p=0.01). However, in aggregate, various known AD SNPs explained less than 1% of the observed variance in HV.
We also examined our five lead SNPs for associations with cognitive decline among 1,593 participants (mean age 78.6 years) in the Religious Orders Study and Rush Memory and Aging Project47 (described in Supplementary Table 6) and found that rs7852872 (ASTN2 locus) was associated with an accelerated rate of global cognitive decline (p=0.009) and an accelerated rate of memory loss (p=0.01) (Supplementary Figure 2 and Supplementary Table 7). The magnitude of effect was comparable to that noted previously for a CR1 SNP (rs6656401) in the same sample 28, providing evidence for the potential importance of this region.
The strengths of the current study include the large population-based sample. In the discovery sample, our power to detect genome-wide significant associations on the order of 0.2 standard deviations in HV (~128 mm3, in the largest single sample: the
AGES_Reykjavik study) was modest for rare variants (68% for 0.05 MAF) and strong for more common variants (>99% for 0.10 MAF). Additional power estimates are shown in Supplementary Figure 3. The concordance of these associations in ENIGMA provides additional biological validation in a population that included younger persons, suggesting that these genes are developmentally important and may be related to maximal adult HV. ENIGMA also has a substantial proportion of persons with dementia, which indicates that these genes may remain important in regulating response to injury. The ability to explore the association of our lead SNPs with cognitive decline provided further context to our findings. Finally, we demonstrated modest associations between previously described Alzheimer’s disease risk SNPs and smaller HV in our samples.
The study also has limitations. A single cross-sectional assessment was used in all studies and MRI and reading protocols varied across participating studies: some studies used manually-traced boundaries (the gold standard) whereas others used computerized algorithms. Although correlation between these two methods is good (Pearson’s r=0.7)48, the heterogeneity of measurement techniques may have compromised our ability to detect small associations. Although our sample size was reasonably large, we may have missed associations with small effect sizes as well as rare variants not covered by commercial genotyping arrays.
Prior studies have suggested that cognitive, neuropathological, and MRI endophenotypes of AD might be early and more sensitive markers of genetic risk than clinical dementia. Hence, it could be argued that genes associated with AD risk should also be associated with HV, even in our dementia-free sample. Although four AD genes were associated with HV, several were not; so in this study HV was not a more sensitive measure than clinical AD. It
NIH-PA Author Manuscript
NIH-PA Author Manuscript
is clear that genetic analysis of MRI endophenotypes within a healthy older community-based cohort study is not an ideal study design to identify all the genes associated with clinical AD. Our aim, however, was to identify genetic influences on hippocampal development and response to aging and not AD per se.
In summary, we detected four genetic loci associated with HV in a large, population-based, dementia-free sample. Two of these loci replicated in independent community-based samples as well as in ENIGMA, a mixed age sample that included some participants with cognitive impairment indicating that these loci may have broad implications for determining the integrity of the hippocampus across a range of ages and cognitive capacities. Findings from this study identified a series of relevant and potentially important genes associated with HV during development, with aging, and in the presence of Alzheimer’s disease.
Exploration of these genomic regions with dense genotyping, expression, and translational studies will be required to understand the role of these genes in determining HV.
Online Methods
Participating studies
Our analyses were performed among dementia-free participants within the setting of the Cohorts for Heart and Aging Research in Genomic Epidemiology (CHARGE) consortium.6 The ten discovery samples included the Aging Gene-Environment Susceptibility—
Reykjavik Study (AGES), the Atherosclerosis Risk in Communities Study (ARIC), the Austrian Stroke Prevention Study (ASPS), the Erasmus Ruchphen Family study (ERF), the Framingham Heart Study (FHS), the Religious Order Study & Rush Memory and Aging Project (RUSH), three independent phases of the Rotterdam Study (RS I, RS II, RS III), and the Tasmanian Study of Cognition and Gait (TASCOG). The two second stage replication samples included the Three City Study (3C) and another independent sample of the third expansion of the Rotterdam Study (RS R). Details on the discovery samples and second stage studies can be found in the Supplementary Note. Each study has an Institutional Review Board that approved the consent procedures, examination components, data security processes, genotyping protocols and current study design. All participants gave written informed consent for study participation and for use of DNA for genetic research.
Hippocampal Volume Phenotypes
Each study evaluated the total hippocampal volume using 1T, 1.5T or 3T MRI and either operator-defined, manually traced boundaries drawn on serial coronal sections or automated methods according to previously described reading protocols. For these analyses, we used data from the baseline examination or the first examination in which an MRI measurement was obtained. Specific details for each study’s MRI protocol are provided in the
Supplementary Note.
Genotyping and imputation
The studies in these analyses used commercial genotyping platforms available from Illumina or Affymetrix. Each study performed genotyping quality control checks and imputed the approximately 2.5 million polymorphic autosomal SNPs described in the HapMap CEU population for each participant using available imputation methods. Details of per-study genotyping, imputation, and quality control procedures are available in Supplementary Note.
Statistical analysis within studies
Each study independently implemented a predefined GWAS analysis plan. For the continuous measure of hippocampal volume, we evaluated cross-sectional associations of hippocampal volume and genetic variation using linear regression models (or linear mixed
NIH-PA Author Manuscript
NIH-PA Author Manuscript
effects models, in FHS and ERF to account for family relatedness). For each of the 2.5 million SNPs, each study fit additive genetic models, regressing trait on genotype dosage (0 to 2 copies of the variant allele). In our primary analyses, all studies adjusted for age and sex. Some studies made additional adjustments including study site, familial structure, or for whether the DNA had been whole genome amplified. Additional details of the statistical analyses are available in the Supplementary Note.
Discovery meta-analysis
We conducted a meta-analysis of regression estimates and standard errors using an inverse-variance weighting approach as implemented in METAL49. After verification of strand alignment across studies, QC, filtering, and imputation within each study, we restricted our meta-analysis to autosomal SNPs that were reported in at least 2 studies and that had an average minor allele frequency of at least 1%. Prior to meta-analysis, we calculated a genomic inflation factor (λgc) for each study to screen for cryptic population substructure or undiagnosed irregularities that might have inflated the test statistics. Inflation was low, with
λgc below 1.05 in all studies. We applied “genomic control” to each study whose genomic inflation factor was greater than 1.00 by multiplying all of the standard errors by the square root of the study-specific λgc. We express the association of each SNP and hippocampal volume as the regression slope (β), its standard error [SE(β)] and a corresponding p-value. Standardized gene and SNP annotations were created using a PERL program.50
For follow up, we decided a priori on a significance threshold of p < 4×10⁻⁷, which corresponds to not more than one expected false positive finding over 2.5 million tests.
Replication meta-analysis
Replication samples were drawn from external studies with available genetic data and measures of hippocampal volume. We provided each collaborating second stage study a list of signal SNPs that attained a p-value of p < 4×10⁻⁷ and combined the results from these studies using a fixed-effects meta-analysis as described above.
Combined meta-analysis
Finally, we combined results from the discovery and second stage analyses using inverse variance weighting, as described above, and considered SNPs with a p-value < 5×10⁻⁸ as genome-wide significant.
External Validation
We sought external replication for our significant and suggestive loci in the ENIGMA consortium, details can be found in the companion paper. The international ENIGMA consortium comprises a wide variety of studies that all have GWAS and hippocampal volume measures (http://enigma.loni.ucla.edu). The sample includes case-control studies of AD and depression, family-based and sib-pair samples as well as population based samples of varying ages and ethnicities (European, African and Hispanic). ENIGMA assesses brain volumes using Freesurfer/FSL-FIRST protocols in most samples but also uses other protocols in a few samples. Hence we chose to compare the results from ENIGMA and CHARGE in a qualitative manner as these two studies vary in the composition of the study sample participants as well as in the methods used to assess HV. We considered replication as a p-value of < 0.05 and consistent direction of association.
Exploration of loci for eQTLs and functional variants
We examined the 4 loci identified as associated with HV for the presence of cis-eQTL associations using the website http://eqtl.uchicago.edu/cgi-bin/gbrowse/eqtl/eQTL. We also
NIH-PA Author Manuscript
NIH-PA Author Manuscript
searched for functional SNPs in LD with the 5 index SNPs. We identified over 70 SNPs with an r2 >0.4 that were within 500kb of each index SNP using the SNAP proxy tool (http://www.broadinstitute.org/mpg/snap/) and annotated these SNPs using GeneCruiser (http://genecruiser.broadinstitute.org/genecruiser3/); none of these SNPs were exonic, non-synonymous coding SNPs.
Supplementary Material
Refer to Web version on PubMed Central for supplementary material.
Acknowledgments
Aging Gene-Environment Susceptibility-Reykjavik Study: The research has been funded by NIA contract
N01-AG-12100 with contributions from NEI, NIDCD and NHLBI, the NIA Intramural Research Program, Hjartavernd (the Icelandic Heart Association), and the Althingi (the Icelandic Parliament).
The Atherosclerosis Risk in Communities Study: The research is carried out as a collaborative study supported
by National Heart, Lung, and Blood Institute contracts (HHSN268201100005C, HHSN268201100006C, HHSN268201100007C, HHSN268201100008C, HHSN268201100009C, HHSN268201100010C, HHSN268201100011C, and HHSN268201100012C), R01HL087641, R01HL59367 and R01HL086694 and R01HL7825; National Human Genome Research Institute contract U01HG004402; and National Institutes of Health contract HHSN268200625226C. The authors thank the staff and participants of the ARIC study for their important contributions. Infrastructure was partly supported by Grant Number UL1RR025005, a component of the National Institutes of Health and NIH Roadmap for Medical Research. This project was also supported by grant HL093029 (M.F.).
The Cardiovascular Health Study: co-authors were supported in part by NHLBI grants HL087652 and
HL105756 (J.C.B., W.L.) as well as NIA grant AG20098 and AG05133 (J.T.B.).
The Austrian Stroke Prevention Study: The research reported in this article was funded by the Austrian Science
Fond (FWF) grant number P20545-P05 and P13180. The Medical University of Graz supports the databank of the ASPS. The authors thank the staff and the participants of the ASPS for their valuable contributions. We thank Birgit Reinhart for her long-term administrative commitment and Ing Johann Semmler for the technical assistance at creating the DNA-bank.
Erasmus Rucphen Family Study:This study is financially supported by the Netherlands Organization for
Scientific Research (NWO), the Internationale Stichting Alzheimer Onderzoek (ISAO), the Hersenstichting Nederland (HSN), and the Centre for Medical Systems Biology (CMSB *1 and 2*) in the framework of the Netherlands Genomics Initiative (NGI). We thank the participants from the Genetic Research in Isolated Populations, Erasmus Rucphen Family, who made this work possible.
Framingham Heart Study: From the Framingham Heart Study of the National Heart Lung and Blood Institute of
the National Institutes of Health and Boston University School of Medicine. This work was supported by the National Heart, Lung and Blood Institute’s Framingham Heart Study (Contract No. N01-HC-25195) and its contract with Affymetrix, Inc for genotyping services (Contract No. N02-HL-6-4278). A portion of this research utilized the Linux Cluster for Genetic Analysis (LinGA-II) funded by the Robert Dawson Evans Endowment of the Department of Medicine at Boston University School of Medicine and Boston Medical Center. Analyses reflect intellectual input and resource development from the Framingham Heart Study investigators participating in the SNP Health Association Resource (SHARe) project. This study was also supported by grants from the National Institute of Neurological Disorders and Stroke (NS17950) and the National Institute of Aging (AG08122, AG16495, AG033193, AG031287).
The Religious Order Study (ROS) and Rush Memory and Aging Project (R-MAP): The R-MAP and ROS data
used in this article was supported by National Institute on Aging grants P30AG10161, R01AG17917, and R01AG15819, the Illinois Department of Public Health, the Rush Clinical Translational Science Consortium, and a gift from Ms. Marsha Dowd.
The Rotterdam Study:The generation and management of GWAS genotype data for the Rotterdam Study is
supported by the Netherlands Organisation of Scientific Research NWO Investments (nr. 175.010.2005.011, 911-03-012). This study is funded by the Research Institute for Diseases in the Elderly (014-93-015; RIDE2), the Netherlands Genomics Initiative (NGI)/Netherlands Organisation for Scientific Research (NWO) project nr. 050-060-810. We thank Pascal Arp, Mila Jhamai, Marijn Verkerk, Lizbeth Herrera and Marjolein Peters for their
NIH-PA Author Manuscript
NIH-PA Author Manuscript
help in creating the GWAS database, and Karol Estrada and Maksim V. Struchalin for their support in creation and analysis of imputed data.
The Rotterdam Study is funded by Erasmus Medical Center and Erasmus University, Rotterdam, Netherlands Organization for the Health Research and Development (ZonMw), the Research Institute for Diseases in the Elderly (RIDE), the Ministry of Education, Culture and Science, the Ministry for Health, Welfare and Sports, the European Commission (DG XII), and the Municipality of Rotterdam. The Rotterdam Scan Study is supported by the Netherlands Organization of Scientific Research (NWO) project nrs. 918-46-615; 904-61-096; 904-61-133; 948-00-010; and Nederlandse Hartstichting 2009B102; and Internationaal Parkinson Fonds. The authors are grateful to the study participants, the staff from the Rotterdam Study and the participating general practitioners and pharmacists.
The Tasmanian Study of Gait and Cognition (TASCOG) is supported by Project Grants from the National
Health and Medical Research Council (NHMRC IDs 403000, 491109, 606543), and a grant from the Wicking Dementia Education and Research Centre, Hobart. Velandai Srikanth is supported by an NHMRC/National Heart Foundation Career Development Fellowship (ID 606544). Matthew Brown is supported by an NHMRC Principal Research Fellowship.
Three City Study (3C): We thank the staff and the participants of the 3C Study for their important contributions.
The 3C Study is conducted under a partnership agreement between the Institut National de la Santé et de la Recherche Médicale (INSERM), the Victor Segalen–Bordeaux II University, and Sanofi-Aventis. The Fondation pour la Recherche Médicale funded the preparation and initiation of the study. The 3C Study is also supported by the Caisse Nationale Maladie des Travailleurs Salariés, Direction Générale de la Santé, Mutuelle Générale de l’Education Nationale (MGEN), Institut de la Longévité, Conseils Régionaux of Aquitaine and Bourgogne, Fondation de France, and Ministry of Research–INSERM Programme “Cohortes et collections de données biologiques.” Lille Génopôle received an unconditional grant from Eisai. We thank A. Boland (Centre National de Génotypage) for her technical help in preparing the DNA samples for analyses. This work was supported by the National Foundation for Alzheimer’s Disease and Related Disorders, the Institut Pasteur de Lille and the Centre National de Génotypage.
References
1. Ridha BH, et al. Tracking atrophy progression in familial Alzheimer’s disease: a serial MRI study. Lancet Neurol. 2006; 5:828–34. [PubMed: 16987729]
2. Small GW. Use of neuroimaging to detect early brain changes in people at genetic risk for Alzheimer’s disease. Adv Drug Deliv Rev. 2002; 54:1561–6. [PubMed: 12453673]
3. den Heijer T, et al. Type 2 diabetes and atrophy of medial temporal lobe structures on brain MRI. Diabetologia. 2003; 46:1604–10. [PubMed: 14595538]
4. Seshadri S, et al. Association of plasma total homocysteine levels with subclinical brain injury: cerebral volumes, white matter hyperintensity, and silent brain infarcts at volumetric magnetic resonance imaging in the Framingham Offspring Study. Arch Neurol. 2008; 65:642–9. [PubMed: 18474741]
5. Sullivan EV, Pfefferbaum A, Swan GE, Carmelli D. Heritability of hippocampal size in elderly twin men: equivalent influence from genes and environment. Hippocampus. 2001; 11:754–62. [PubMed: 11811670]
6. Psaty BM, et al. Cohorts for Heart and Aging Research in Genomic Epidemiology (CHARGE) Consortium: Design of Prospective Meta-Analyses of Genome-Wide Association Studies From 5 Cohorts. Circ Cardiovasc Genet. 2009; 2:73–80. [PubMed: 20031568]
7. Zapala MA, et al. Adult mouse brain gene expression patterns bear an embryologic imprint. Proc Natl Acad Sci U S A. 2005; 102:10357–62. [PubMed: 16002470]
8. Sborgi L, Barrera-Vilarmau S, Obregon P, de Alba E. Characterization of a novel interaction between Bcl-2 members Diva and Harakiri. PLoS One. 2010; 5:e15575. [PubMed: 21209886] 9. Lukiw WJ, Bazan NG. Inflammatory, apoptotic, and survival gene signaling in Alzheimer’s disease.
A review on the bioactivity of neuroprotectin D1 and apoptosis. Mol Neurobiol. 2010; 42:10–6. [PubMed: 20414817]
10. Inohara N, Ding L, Chen S, Nunez G. harakiri, a novel regulator of cell death, encodes a protein that activates apoptosis and interacts selectively with survival-promoting proteins 2 and Bcl-X(L). EMBO J. 1997; 16:1686–94. [PubMed: 9130713]
NIH-PA Author Manuscript
NIH-PA Author Manuscript
11. Imaizumi K, et al. The cell death-promoting gene DP5, which interacts with the BCL2 family, is induced during neuronal apoptosis following exposure to amyloid beta protein. J Biol Chem. 1999; 274:7975–81. [PubMed: 10075695]
12. Guan QH, Pei DS, Xu TL, Zhang GY. Brain ischemia/reperfusion-induced expression of DP5 and its interaction with Bcl-2, thus freeing Bax from Bcl-2/Bax dimmers are mediated by c-Jun N-terminal kinase (JNK) pathway. Neurosci Lett. 2006; 393:226–30. [PubMed: 16243436] 13. Rohn TT. The role of caspases in Alzheimer’s disease; potential novel therapeutic opportunities.
Apoptosis. 2010; 15:1403–9. [PubMed: 20127416]
14. Segref A, Hoppe T. Think locally: control of ubiquitin-dependent protein degradation in neurons. EMBO Rep. 2009; 10:44–50. [PubMed: 19079132]
15. Riederer BM, Leuba G, Vernay A, Riederer IM. The role of the ubiquitin proteasome system in Alzheimer’s disease. Exp Biol Med (Maywood). 2011; 236:268–76. [PubMed: 21383047] 16. Liao EH, Hung W, Abrams B, Zhen M. An SCF-like ubiquitin ligase complex that controls
presynaptic differentiation. Nature. 2004; 430:345–50. [PubMed: 15208641]
17. Litterman N, et al. An OBSL1-Cul7Fbxw8 ubiquitin ligase signaling mechanism regulates Golgi morphology and dendrite patterning. PLoS Biol. 2011; 9:e1001060. [PubMed: 21572988] 18. Veyrieras JB, et al. High-resolution mapping of expression-QTLs yields insight into human gene
regulation. PLoS Genet. 2008; 4:e1000214. [PubMed: 18846210]
19. Schadt EE, et al. Mapping the genetic architecture of gene expression in human liver. PLoS Biol. 2008; 6:e107. [PubMed: 18462017]
20. Myers AJ, et al. A survey of genetic human cortical gene expression. Nat Genet. 2007; 39:1494–9. [PubMed: 17982457]
21. Stranger BE, et al. Genome-wide associations of gene expression variation in humans. PLoS Genet. 2005; 1:e78. [PubMed: 16362079]
22. Kalmijn S, et al. Total homocysteine and cognitive decline in a community-based sample of elderly subjects: the Rotterdam Study. American Journal of Epidemiology. 1999; 150:283–9. [PubMed: 10430233]
23. Prins ND, et al. Homocysteine and cognitive function in the elderly: the Rotterdam Scan Study. Neurology. 2002; 59:1375–80. [PubMed: 12427887]
24. den Heijer T, et al. Homocysteine and brain atrophy on MRI of non-demented elderly. Brain. 2003; 126:170–5. [PubMed: 12477704]
25. Gonzalez S, et al. Serum selenium is associated with plasma homocysteine concentrations in elderly humans. J Nutr. 2004; 134:1736–40. [PubMed: 15226462]
26. Kim H, et al. Downregulation of Wnt/beta-catenin signaling causes degeneration of hippocampal neurons in vivo. Neurobiol Aging. 2010
27. Gogolla N, Galimberti I, Deguchi Y, Caroni P. Wnt signaling mediates experience-related regulation of synapse numbers and mossy fiber connectivities in the adult hippocampus. Neuron. 2009; 62:510–25. [PubMed: 19477153]
28. Chibnik LB, et al. CR1 is associated with amyloid plaque burden and age-related cognitive decline. Ann Neurol. 2011; 69:560–9. [PubMed: 21391232]
29. Okamoto OK, et al. Whole transcriptome analysis of the hippocampus: toward a molecular portrait of epileptogenesis. BMC Genomics. 2010; 11:230. [PubMed: 20377889]
30. Henrich-Noack P, Prehn JH, Krieglstein J. TGF-beta 1 protects hippocampal neurons against degeneration caused by transient global ischemia. Dose-response relationship and potential neuroprotective mechanisms. Stroke. 1996; 27:1609–14. discussion 1615. [PubMed: 8784137] 31. Kubben N, et al. Identification of differential protein interactors of lamin A and progerin. Nucleus.
2010; 1:513–525. [PubMed: 21327095]
32. Mentlein R. Dipeptidyl-peptidase IV (CD26)--role in the inactivation of regulatory peptides. Regul Pept. 1999; 85:9–24. [PubMed: 10588446]
33. Gault VA, Holscher C. GLP-1 agonists facilitate hippocampal LTP and reverse the impairment of LTP induced by beta-amyloid. Eur J Pharmacol. 2008; 587:112–7. [PubMed: 18466898]
NIH-PA Author Manuscript
NIH-PA Author Manuscript
34. Bernstein HG, Schon E, Ansorge S, Rose I, Dorn A. Immunolocalization of dipeptidyl aminopeptidase (DAP IV) in the developing human brain. Int J Dev Neurosci. 1987; 5:237–42. [PubMed: 2902740]
35. Lamers D, et al. Dipeptidyl peptidase 4 is a novel adipokine potentially linking obesity to the metabolic syndrome. Diabetes. 2011; 60:1917–25. [PubMed: 21593202]
36. Jagust W, Harvey D, Mungas D, Haan M. Central obesity and the aging brain. Arch Neurol. 2005; 62:1545–8. [PubMed: 16216937]
37. Hamilton A, Patterson S, Porter D, Gault VA, Holscher C. Novel GLP-1 mimetics developed to treat type 2 diabetes promote progenitor cell proliferation in the brain. J Neurosci Res. 2011; 89:481–9. [PubMed: 21312223]
38. Hamilton A, Holscher C. Receptors for the incretin glucagon-like peptide-1 are expressed on neurons in the central nervous system. Neuroreport. 2009; 20:1161–6. [PubMed: 19617854] 39. During MJ, et al. Glucagon-like peptide-1 receptor is involved in learning and neuroprotection. Nat
Med. 2003; 9:1173–9. [PubMed: 12925848]
40. Wilson PM, Fryer RH, Fang Y, Hatten ME. Astn2, a novel member of the astrotactin gene family, regulates the trafficking of ASTN1 during glial-guided neuronal migration. J Neurosci. 2010; 30:8529–40. [PubMed: 20573900]
41. Gasser UE, Hatten ME. Neuron-glia interactions of rat hippocampal cells in vitro: glial-guided neuronal migration and neuronal regulation of glial differentiation. J Neurosci. 1990; 10:1276–85. [PubMed: 2329376]
42. Lambert JC, et al. Genome-wide association study identifies variants at CLU and CR1 associated with Alzheimer’s disease. Nat Genet. 2009; 41:1094–9. [PubMed: 19734903]
43. Harold D, et al. Genome-wide association study identifies variants at CLU and PICALM associated with Alzheimer’s disease. Nat Genet. 2009; 41:1088–93. [PubMed: 19734902] 44. Hollingworth P, et al. Common variants at ABCA7, MS4A6A/MS4A4E, EPHA1, CD33 and
CD2AP are associated with Alzheimer’s disease. Nat Genet. 2011; 43:429–35. [PubMed: 21460840]
45. Naj AC, et al. Common variants at MS4A4/MS4A6E, CD2AP, CD33 and EPHA1 are associated with late-onset Alzheimer’s disease. Nat Genet. 2011; 43:436–41. [PubMed: 21460841]
46. Seshadri S, et al. Genome-wide analysis of genetic loci associated with Alzheimer disease. JAMA. 2010; 303:1832–40. [PubMed: 20460622]
47. Corneveaux JJ, et al. Association of CR1, CLU and PICALM with Alzheimer’s disease in a cohort of clinically characterized and neuropathologically verified individuals. Hum Mol Genet. 2010; 19:3295–301. [PubMed: 20534741]
48. van der Lijn F, den Heijer T, Breteler MM, Niessen WJ. Hippocampus segmentation in MR images using atlas registration, voxel classification, and graph cuts. Neuroimage. 2008; 43:708–20. [PubMed: 18761411]
49. Willer CJ, Li Y, Abecasis GR. METAL: fast and efficient meta-analysis of genomewide association scans. Bioinformatics. 2010; 26:2190–1. [PubMed: 20616382]
50. Johnson AD, O’Donnell CJ. An open access database of genome-wide association results. BMC Med Genet. 2009; 10:6. [PubMed: 19161620]
NIH-PA Author Manuscript
NIH-PA Author Manuscript
Figure 1. Genome-wide Manhattan plot for hippocampal volume
The plot shows the individual p-values (based on discovery meta-analysis) against their genomic position for hippocampal volume. Within each chromosome, shown on the x-axis, the results are plotted left to right from the p-terminal end. The dashed line indicates the threshold for follow-up, p<4 ×10⁻⁷ and the solid line indicates the threshold for genome-wide significance, p<5×10⁻⁸. The nearest genes are indicated above points that surpassed our significance threshold for follow-up.
NIH-PA Author Manuscript
NIH-PA Author Manuscript
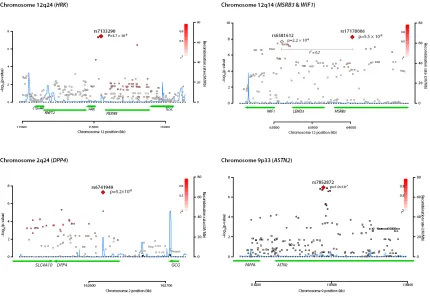
Figure 2. Regional plots for hippocampal volume SNPs
Plots are centered on the most significant SNP at a given locus along with the meta-analysis results for SNPs in a region surrounding it (typically ± 100kb). All SNPs are plotted with their discovery meta-analysis p-values against their genomic position, with the most significant SNP in the region indicated as a diamond and other SNPs shaded according to their pairwise correlation (r2) with the signal SNP. The light blue line represents the estimated recombination rates. Gene annotations are shown as dark green lines.
NIH-PA Author Manuscript
NIH-PA Author Manuscript
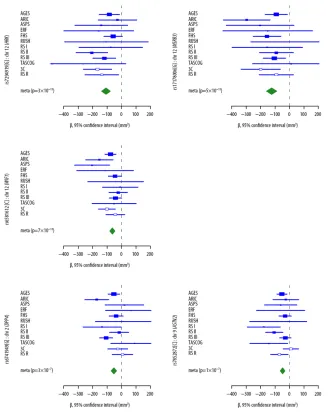
Figure 3. Forest plots for hippocampal volume SNP associations
Plots show the study-specific association estimates (β) and 95% confidence intervals for the discovery and replication stage studies, presented as rectangles and bars. Arrowheads indicate confidence intervals that span beyond the x-axis. Study specific results are indicated by: AGES, Aging Gene-Environment Susceptibility—Reykjavik Study; ARIC,
Atherosclerosis Risk in Communities Study, ASPS, Austrian Stroke Prevention Study; ERF, Erasmus Ruchphen Family study; FHS, Framingham Heart Study; RUSH, Religious Order Study & Rush Memory and Aging Project; RS I, RS II, RS III, RS R, independent phases of the Rotterdam Study; TASCOG, Tasmanian Study of Cognition and Gait; 3C, Three City Study. Estimates from the replication phase (3C, RS R) are indicated by open rectangles. The scale is mm3. The association estimate and confidence interval for the meta-analysis combining discovery and second stage results is presented as a diamond. Blank spaces indicate occasions in which a particular study was not able to provide results for a given SNP.
NIH-PA Author Manuscript
NIH-PA Author Manuscript
NIH-PA Author Manuscript
NIH-PA Author Manuscript
[image:16.612.92.207.188.680.2]NIH-PA Author Manuscript
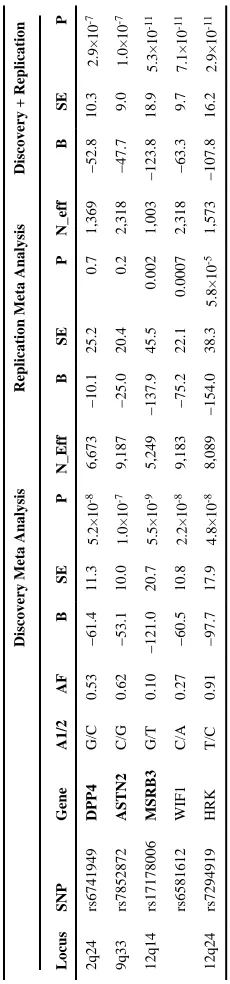
Table 1
Discovery, Replication, and Combined Meta-analysis
Discovery Meta Analysis
Replication Meta Analysis
Discovery + Replication
Locus SNP Gene A1/2 AF B SE P N_Eff B SE P N_eff B SE P 2q24 rs6741949 DPP4 G/C 0.53 −61.4 11.3 5.2×10 -8 6,673 −10.1 25.2 0.7 1,369 −52.8 10.3 2.9×10 -7 9q33 rs7852872 ASTN2 C/G 0.62 −53.1 10.0 1.0×10 -7 9,187 −25.0 20.4 0.2 2,318 −47.7 9.0 1.0×10 -7 12q14 rs17178006 MSRB3 G/T 0.10 −121.0 20.7 5.5×10 -9 5,249 −137.9 45.5 0.002 1,003 −123.8 18.9 5.3×10 -11 rs6581612 WIF1 C/A 0.27 −60.5 10.8 2.2×10 -8 9,183 −75.2 22.1 0.0007 2,318 −63.3 9.7 7.1×10 -11 12q24 rs7294919 HRK T/C 0.91 −97.7 17.9 4.8×10 -8 8,089 −154.0 38.3 5.8×10 -5 1,573 −107.8 16.2 2.9×10 -11
A1/2 indicates coded (risk)/non-coded allele; B=association estimate, in mm
3; SE=standard error, P=p-value, N_eff indicates effective sample size:
Σ
(imputation quality×N).
Bolded
gene names indicate
NIH-PA Author Manuscript
NIH-PA Author Manuscript
[image:17.612.90.261.398.673.2]NIH-PA Author Manuscript
Table 2
Replication results in ENIGMA Locus
SNP Gene A1/2 AF B SE P N_Eff 2q24 rs6741949 DPP4 G/C 0.58 −28.2 14.0 0.04 7,794 9q33 rs7852872 ASTN2 C/G rs7040792 (r 2=1.0) T/C 0.64 −29.0 12.8 0.02 7,794 12q14 rs17178006 MSRB3 G/T rs1370938 (r 2=0.30) A/C 0.24 −32.4 14.4 0.02 7,794 rs6581612 WIF1 C/A rs1498792 (r 2=0.96) T/C 0.25 −25.4 14.6 0.08 7,794 12q24 rs7294919 HRK T/C 0.90 −112.2 21.4 1.6×10 -7 7,794
A1/2 indicates coded (risk)/non-coded allele; B=association estimate, in mm
3; SE=standard error, P=p-value, N_eff indicates effective sample size.
Bolded
gene names indicate that a SNP is within the
gene. Proxy SNPs are indicated in (italics); r