Figure Legends
1. The geometry of the model RyR pore. In the experiments and calculations, the lumen of the sarcoplasmic reticulum (SR) is electrically grounded. The circle around each labeled amino acid in meant to illustrate the range of the motion of the terminal carboxyl group. Aspartates (solid circles) are given a radius of 5 Å and glutamates (dashed circles) 7 Å. Only the amino acids of one of the four identical RyR subunits is shown. Asp-4945, Asp-4938, Asp-4899, Glu-4900, and Glu-4902 are the only amino acids explicitly modeled in the theory. The GGGIG sequence (4894-4898 in the numbering) at the cytosolic end of the selectivity filter is only a reference point for readers familiar with the RyR sequence.
2. Experimental verification of the AMFE predicted by the theory. The lines are the theory and the symbols are the experimental data with standard error bars and the number of experiments in parentheses. The solid line and symbols are the addition of Ca2+ to Na+ and the dashed line and open symbols are the addition of Ca2+ to Cs+. In all cases, the monovalent-chloride concentration was 150 mM in both cytosolic and lumenal baths and the indicated amount Ca2+ was added to the lumenal bath. The current at –20 mV is shown.
3. The partitioning coefficient of K+ (panel A) and Ca2+ (panel B) plotted logarithmically. [K+] = 150 mM and the indicated [Ca2+] is in both baths.
4. The electrostatic component of partitioning z ei φ( ) /x kT of K+ (panel A) and Ca2+ (panel B) in the pore. [K+] = 150 mM and the indicated [Ca2+] is in both baths. 5. The screening component of partitioning SC( ) /
i x kT
μ
Δ of K+ (solid lines) and Ca2+ (dashed lines) in the pore. [K+] = 150 mM and [Ca2+] is changed from 1 μM to 50 mM. Because the curves are so close together, [Ca2+] is not indicated.
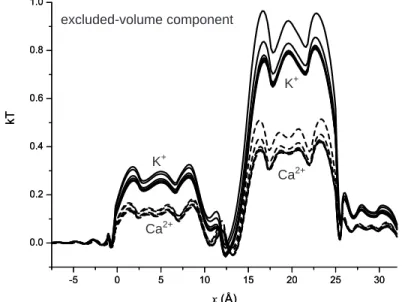
6. The excluded-volume (hard-sphere) component of partitioning HS
( ) /
i x kT
μ
Δ of K+
(solid lines) and Ca2+ (dashed lines) in the pore. [K+] = 150 mM and [Ca2+] is changed from 1 μM to 50 mM. Because the curves are so close together, [Ca2+] is not indicated.
7. Components of the binding selectivity from Eq. (6) in the selectivity filter at x = 20 Å in Fig. 1. [K+] = 150 mM and the indicated [Ca2+] is in both baths. The horizontal-hatched bar is the number advantage, the diagonal-hatched bar is the mean electrostatic advantage, the cross-hatched bar is the screening advantage, and the solid bar is the excluded-volume advantage. The horizontal line is the binding selectivity of Eq. (6) (i.e., the sum of all the terms). A positive term favors the binding of Ca2+ while a negative term favors K+.
8. Concentration profiles in the pore of the monovalent cation (panel A) and Ca2+ (panel B). For each indicated monovalent cation X+, [X+] = 150 mM and [Ca2+] = 1 mM in both baths.
horizontal line is the binding selectivity of Eq. (6) (i.e., the sum of all the terms). A positive term favors the binding of Ca2+ while a negative term favors K+.
10. Concentration profiles in the pore for the mutations D4899N (panels A and B) and D4938N (panels C and D) for K+ (panels A and C) and Ca2+ (panels B and D). The profiles for native (WT) channel are the solid lines and for the mutations the dashed lines. [K+] = 150 mM and [Ca2+] = 1 mM in both baths. In the model, the mutation is created by “turning off” the charge on the four Asp-4899 or the four Asp-4939. The mutation site is the region from which the charge has been removed.
11. Profiles of the binding selectivity from Eq. (6) (panel A) and its components (excluded volume, panel B; mean electrostatic, panel C; screening, panel D) for the native (WT) channel (solid line) and the mutation D4899N (dashed line). The conditions are those described in Fig. 10.
12. Profiles of the binding selectivity from Eq. (6) (panel A) and its components (excluded volume, panel B; mean electrostatic, panel C; screening, panel D) for the native (WT) channel (solid line) and the mutation D4938N (dashed line). The conditions are those described in Fig. 10.
13. Current/voltage curves in KCl (A-H). (I) The conductance at reversal potential with cytosolic [K+] is held at 250 mM and lumenal [K+] is varied. Comparing panel I and Fig. 16B of Ref. 20 summarizes the improvements due to the new RyR model; in general the computed current/voltage curves are more linear and the conductances are significantly closer to experimental values, especially in cases where the lumenal concentration is low. For both experiment and theory the current/voltage was fitted with a line and the slope is plotted. In this and the following figures, concentrations are listed as cytosolic | lumenal. The solid lines are the model and symbols are the experimental data.
14. Current/voltage curves of (A) native (WT) RyR (×) and the mutants D4899N (■) and E4900Q (□) and (B) the D4938N mutant in 250 mM symmetric KCl.
15. Current/voltage curves in LiCl. The dashed line is the model result for 250 mM cytosolic and 25 mM lumenal bath concentrations (Δ). Compared to the previous model, the dashed line reproduces the data much better.
16. Current/voltage curves in NaCl. Compared to the previous model, the current/voltage curves are more linear and reproduce the data better.
17. Current/voltage curves in RbCl. Compared to the previous model, the current/voltage curves are more linear and reproduce the data better.
18. Current/voltage curves in CsCl. Compared to the previous model, the current/voltage curves are more linear and reproduce the data better.
19. Mole fraction experiments at 250 mM total cation concentration in symmetric solutions. (A) NaCl and CsCl mixtures. The experimental point at mole fraction 0.6 is statistically significantly different than the point at mole fraction 1 (p < 0.05). The number of experiments is shown in parentheses. (B) LiCl and KCl mixtures.
20. Current/voltage curves in bi-ionic conditions.
21. Current/voltage curves with divalent and monovalent cations. (A) KCl and CaCl2.
(B) NaCl and CaCl2. (C) CsCl and CaCl2. (D) KCl and MgCl2. In both baths are
mM (▲) divalent-Cl2 or the baths contain 250 mM cytosolic monovant-Cl and 25
mM lumenal divalent-Cl2 (Δ). Current/voltage curves of (E) the D4899N (■) and
D 4938 D
4945
D 4899 4900E
E 4902
GGGIG
x (Å)
p
o
re
r
a
d
iu
s
(
Å
)
GGGIG
cytosol lumenSR
10-5 10-4 10-3 10-2 10-6
Fig. 2 Na+ with added Ca2+
partitioning of K+ partitioning of Ca2+
A B
1 µM
0.1 mM
1 mM
3 mM
10 mM
50 mM 1 µM
0.1 mM
1 mM
3 mM
10 mM
50 mM
mean electrostatic potential K+
mean electrostatic potential Ca2+
A B
Fig. 4 1 µM 0.1 mM
1 mM 3 mM 10 mM 50 mM
1 µM 0.1 mM
Fig. 5 Ca2+
K+
Fig. 6 Ca2+
K+
n u m b e r a d v a n ta g e m e a n e le c tr o s ta ti c a d v a n ta g e s c re e n in g a d v a n ta g e e x c lu d e -v o lu m e a d v a n ta g e binding selectivity k T
1 µM 0.1 mM 1 mM 3 mM 10 mM 50 mM
A B
monovalent concentration Ca2+ concentration
m e a n e le c tr o s ta ti c a d v a n ta g e n u m b e r a d v a n ta g e s c re e n in g a d v a n ta g e e x c lu d e -v o lu m e a d v a n ta g e k
T Li+ Na+ K+ Cs+
binding advantage
A B
K+ concentration D4899N Ca2+ concentration
mutation site
D4899N mutation site
Fig. 10 D4938N
mutation site
C K+ concentration
D4938N mutation site
D Ca
D4899N mutation site D4899N
mutation site
D4899N mutation site
D4899N mutation site
A B
C D
D4938N mutation site
D4938N mutation site
D4938N mutation site
D4938N mutation site
A B
C D
A B C
D E F
G H I
A B
A B C
A B
A B C
A B
A B C
D E F
G
A B
C D
E F