Effect of the composition of starter diet fed
in the rearing phase on the performance and certain
physiological parameters of Holstein calves
Szandra Tóth
1*, Melinda Kovács
1,2, Brigitta Bóta
2, Judit Szabó-Fodor
2,
Gábor Bakos
3, Hedvig Fébel
41Faculty of Agricultural and Environmental Sciences, Kaposvár University, Kaposvár, Hungary 2Mycotoxins in the Food Chain Research Group, Kaposvár University, Hungarian Academy
of Sciences, Kaposvár, Hungary
3BOS-FRUCHT Agricultural Production, Processing and Sales Co-operative, Kazsok, Hungary 4Research Institute for Animal Breeding, Nutrition and Meat Science, National Agricultural
Research and Innovation Centre, Herceghalom, Hungary *Corresponding author: [email protected]
Citation: Tóth Sz., Kovács M., Bóta B., Szabó-Fodor J., Bakos G., Fébel H.(2019):Effect of the composition of starter diet fed in the rearing phase on the performance and certain physiological parameters of Holstein calves. Czech J. Anim. Sci., 64, 367–376.
Abstract: The objective of this study was to compare the effects of calf starters of different starch and fibre content on the growth, blood and rumen parameters of Holstein female calves during the pre-weaning period. A total of 60 calves were divided into two groups. Group A/B was fed according to a two-phase calf nutrition system: the calves received calf starter “A” (28.5% starch content, 16% neutral detergent fibre (NDF), 9.2% acid detergent fibre (ADF)) in days 7–45 and then calf starter “B” (14.2% starch content, 32.4% NDF, 14.3% ADF) in days 46–70. Calves of group B received calf starter “B” throughout the experimental period. The calves were weaned between 52 and 61 days of life. The data on body weight, weight gain, starter feed intake, blood metabolites and rumen fermentation parameters were collected individually. In the first phase of experiment, the starter feed consumption of A/B group was higher than that of B group (P < 0.05), but it did not manifest in differences in body weight at weaning time. At some of the sampling times, the different composition of starter diets significantly (P < 0.05) influenced the plasma urea, albu-min, glucose and triglyceride concentrations. The consumption of diet with different starch and NDF content had no significant effect either on the composition of the rumen microbiota or on the ruminal concentration of volatile fatty acids (VFA) and ammonia. In some cases significant correlations (–0.83 and –0.93; 0.82 and 0.90) were found between the composition of rumen microbiota and ruminal VFA concentration. Feeding a diet of higher starch con-tent (28.5 vs 14.2%) in the first 45 days of life did not affect rumen fermentation, rumen microbiota and the most important blood metabolites, apart from a few exceptions. The production parameters of calves, including total feed intake and body weight gain, were similar in the experiment.
Keywords: two-phase feeding; dairy calf; rumen fermentation; blood metabolites
Inexpensive and loss-free rearing of the offspring is the most important objective in the husbandry of all livestock species. Obtaining healthy progeny that meet the breeding objectives is especially
former, the digestibility of the feed. The transition from “pseudo-monogastric” digestion to ruminant digestion is a delicate process for the young calves (Baldwin et al. 2004). For successful early weaning, the development of the rumen must be supported by the use of appropriate technologies. This makes it possible to change from milk replacer feeding to the exclusive use of solid feeds as soon as pos-sible. However, this switch-over should not impair performance and the basic physiological processes. Before weaning, the calf must be able to successfully prepare for the intake of adequate amounts of dry matter and should have a sufficiently mature rumen to allow the efficient utilisation of feed. In farming practice it has often been observed that weight gain after the end of milk provision is reduced in some calves most likely because the intake of dry food is not yet sufficient at the time milk provi-sion is stopped (Roth et al. 2009). A higher intake of solid feed, especially of concentrate of higher starch content, supports the development of the rumen microbiota and volatile fatty acid (VFA) production, and consequently the maturation of the rumen (Suarez et al. 2007). Terre et al. (2013) reported a better feed conversion ratio in calves fed a starter diet of lower fibre content. At the same time, adequate fibre sources are indispensable for the healthy development and functioning of the rumen. Meale et al. (2017) described the period from birth to weaning like the biggest challenges for gastrointestinal tract (GIT) development. Most research on the transformation of the calf GIT fo-cuses on rumen maturation, which is believed to be initiated by the consumption of solid feed. The production and absorption of resulting fermenta-tion end products (i.e., VFA) stimulate ruminal papillae development (Baldwin et al. 2004; Meale et al. 2017).
Scientific research evaluating the effects of dif-ferent carbohydrate sources (starch or hemicel-lulose) in the calf starter on the solid feed intake, body weight gain, metabolic response and rumen microbial community is limited. The objective of this study was to compare the effects of calf start-ers of different starch and fibre content on the growth and some blood and rumen parameters of female Holstein calves during the preweaning period. It was hypothesized that a higher dietary starch content will increase the molar proportion of ruminal propionic acid, affecting the feed intake of calves, with final benefits on weight gain.
MATERIAL AND METHODS
Ethics of experimentation.The experiment was carried out in a common dairy farm (Bos-Frucht Agricultural Production, Processing and Marketing Co-operative) with operating permit number SOI/31/752-2/2014 (Food Chain Safety and Veterinary Office, Hungary). All experimen-tal procedures were reviewed and approved by the Ethics Committee on the Use of Animals in Research, Kaposvár University, Hungary.
Experimental animals and housing.A total of 60 Holstein heifer calves (30 calves per group, birth weight: 33–46 kg) were selected for the study. Between 12 and 24 h after birth the calves were housed in Calf-Tel calf hutches (432 × 122 cm) suitable for individual keeping. The floor of the hutches was made of crushed gravel covered with a layer of straw bedding both outside and inside the hutches to ensure the dry keeping conditions. The calves assigned to the two experimental groups were evenly distributed on the given area. Fol-lowing their weaning from milk feeding (around 60 days of age) the calves remained in the indi-vidual hutches for further 7 days in order to reduce the stress associated with weaning. During that period, drinking water and starter were available ad libitum. At about 67 days of age the calves were weighed and transferred to the grower unit, where the calves of the two groups were kept in pens accommodating 15 animals each, where the diet was available ad libitum.
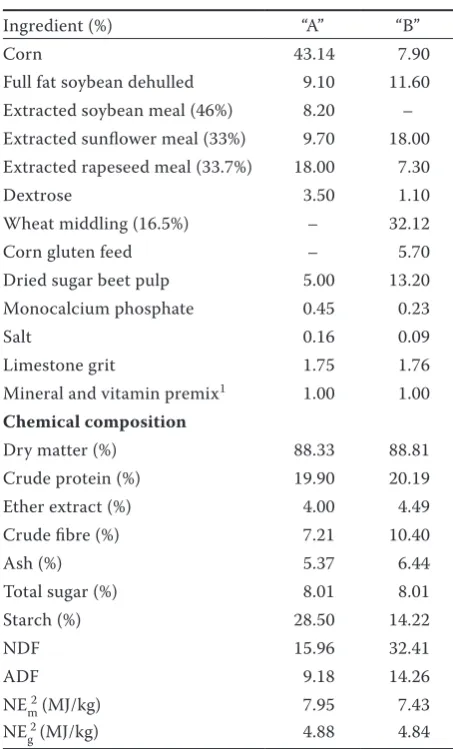
Treatments and feeding. The animals were divided into two groups for the study. Calves of group A/B were fed according to a two-phase calf nutrition system: the calves received calf starter “A” (28.5% starch content, 16% neutral detergent fibre (NDF), 9.2% acid detergent fibre (ADF)) from day 0 to 45 and then calf starter “B” (14.2% starch content, 32.4% NDF, 14.3% ADF) between days 46 and 70. Calves of group B were fed according to a one-phase feeding system, receiving calf starter “B” throughout the experimental period lasting to 70 days of age.
only milk replacer (in 1 : 8 dilution) and then since 21 days of age they were fed a mixture consisting of 75% milk replacer and 25% pasteurised whole milk (“milk juice”) from a bucket, twice daily (at 7:00 and 19:00 h), in the following dose: 2 × 2.5 l (625 g milk replacer/day) between day 0 and 14, 2 × 3.5 l (875 g milk replacer/day) between days 14 and 21, and 2 × 4.5 l (750 g milk replacer/day) from day 21 to the week before weaning (day 53). In the 7 days before weaning the calves were given 4.5 l of “milk juice” (375 g milk replacer/day) only in the morning (at 7:00 h). The calves were weaned between 58 and 60 days of age. Calves were pro-vided free access to drinking water from day 1 and to calf starter from day 7.
The nutrient content of the calf milk replacer (Sprayfo Yellow, SlotenGroep B.V., the Netherlands) is presented in Table 1, while the composition of experimental diets A and B (UBM Feed Ltd., Hungary) is shown in Table 2.
Samplings and measured parameters.As the experiment was conducted at a commercial dairy cattle operation of 1800 cows, the schedule of data collection had to be adjusted to the farm manage-ment. Accordingly, we could record the individual feed intake from Monday to Friday, between 9:00 and 11:00 h every day. The recorded feed intake values of individual calves were averaged for the periods of days 7–45, days 46–67, and for the entire period of study.
The calves were weighed individually at birth and on the day of their transferring to the grower unit (day 67 of age), and their individual body weight
gain for the whole period of study was calculated from these data.
For the determination of certain clinical chem-istry parameters, blood samples were collected from the tail vein into EDTA-containing tubes from 10 calves per group on days 14, 28, 42, 56 and 70. Blood samples were always taken from the same animals, 2–3 h after the morning feeding.
[image:3.595.304.531.122.497.2]At day 45 of age ruminal contents were collect-ed from 6 calves per group approximately 5–6 h post-feeding using oesophageal tube. Rumen fluid samples were subjected to microbiological tests, ammonia and VFA analysis.
Table 1. Chemical composition (as-fed basis) of milk replacer1
Composition
Energy (MJ/kg) 17.7
Dry matter (%) 97.5
Crude protein (%) 21.5 Ether extract (%) 17.5
Lactose (%) 46.0
Ash (%) 9.0
Crude fibre (%) 0.0
Calcium (%) 0.8
Phosphorus (%) 0.75
Sodium (%) 0.9
1Sprayfo Yellow (SlotenGroep B.V., the Netherlands). Values
[image:3.595.63.292.566.726.2]are concentrations declared by manufacturer
Table 2. Ingredients and chemical composition (as-fed basis) of different calf starters (“A” and “B”)
Ingredient (%) “A” “B”
Corn 43.14 7.90
Full fat soybean dehulled 9.10 11.60 Extracted soybean meal (46%) 8.20 – Extracted sunflower meal (33%) 9.70 18.00 Extracted rapeseed meal (33.7%) 18.00 7.30
Dextrose 3.50 1.10
Wheat middling (16.5%) – 32.12 Corn gluten feed – 5.70 Dried sugar beet pulp 5.00 13.20 Monocalcium phosphate 0.45 0.23
Salt 0.16 0.09
Limestone grit 1.75 1.76 Mineral and vitamin premix1 1.00 1.00
Chemical composition
Dry matter (%) 88.33 88.81 Crude protein (%) 19.90 20.19 Ether extract (%) 4.00 4.49 Crude fibre (%) 7.21 10.40
Ash (%) 5.37 6.44
Total sugar (%) 8.01 8.01 Starch (%) 28.50 14.22
NDF 15.96 32.41
ADF 9.18 14.26
NEm2 (MJ/kg) 7.95 7.43
NE 2 g(MJ/kg) 4.88 4.84
1provided per kg of calf starter: Co 1 mg, Cu 10 mg,
I 2 mg, Mn 40 mg, S 0.18%, Se 0.3 mg, Zn 40 mg, vitamin A 15 000 IU, vitamin D 3000 IU, vitamin E 35 mg, vitamin B2
1.6 mg, vitamin B3 2 mg, pantothenate 0.8 mg
2net energy for maintenance and net energy for gain were
Clinical chemistry parameters.The clinical chemistry tests containing the most important metabolic parameters (glucose, triglycerides, urea, total protein, total cholesterol, aspartate amino-transferase (AST), gamma-glutamylamino-transferase (GGT), creatinine) were performed by Vet-Med Laboratory (Budapest, Hungary) using a Roche Hitachi 912 chemistry analyzer (Hitachi, Japan) and commercially available reagents (Diagnosti-cum, Hungary).
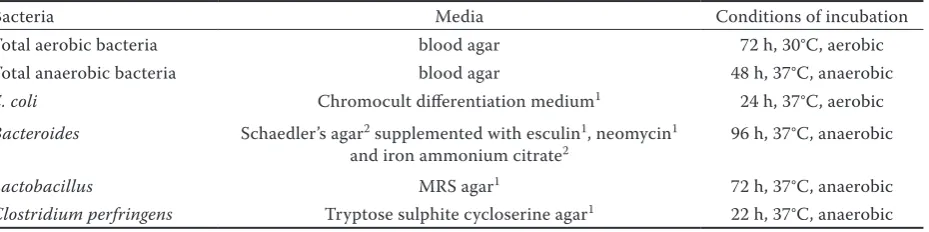
Microbiological examinations. From 1 g of ruminal content, serial dilutions with 0.9% NaCl were made immediately after sampling, and used for microbiological determination. The condi-tions of culturing are summarised in Table 3. An-aerobic conditions were ensured with the help of Anaerocult® culture dishes and Anaerocult® A
(both Merck, Germany) gas-producing bags. The samples were incubated in an LP 104 type thermo-stat (LMIM, Hungary). After the incubation time had elapsed, the colonies were counted with an Acolyte colony counter (Aqua-Terra Lab, Hungary). The colony counts were expressed in log10 colony forming units (CFU) related to 1 g of sample.
Volatile fatty acid and ammonia content of the rumen fluid.Ruminal fluid samples were strained through four layers of gauze and then centrifuged (5000 rpm, 15 min). The supernatant fraction of the rumen fluid was analysed for VFAs and ammonia. For the preparation of samples for VFA analysis, 2.5 ml of filtered rumen fluid were added to 0.5 ml of 25% HPO3. The acidified fluid was centrifuged and the supernatant was stored at –65°C until ana-lysed. Ruminal VFAs were separated and quanti-fied by gas chromatography (Shimadzu GCMS-QP 2010SE, Japan) using a ZB-WAX plus column (30 m, 0.25 mm i.d., 0.25 m film thickness) (Phenomenex Inc., USA). The ammonia concentration of ruminal
samples was determined using a phenol hypochlorite assay (Broderick and Kang 1980).
Statistical analysis.Statistical analysis was done using the R Commander (Version 3.4.1, 1991). The recorded data on body weight, daily weight gain, feed intake, rumen microbiota, rumen fermentation parameters and blood metabolites were evaluated by a two-tailed t-test after having been tested for normality by the Shapiro–Wilk method. Arithmetic means, standard deviation (SD), standard error of the mean (SEM) and residuals standard deviation (RSD) for each evaluated variable group were cal-culated using descriptive statistical procedures. All of these values are presented in the tables of the results section. Group × time × treatment interac-tions for the blood clinical chemistry parameters were determined by Repeated Measures ANOVA, while the correlations between the microbiota and the molar ratios of VFAs by the correlation test of the program. Differences were considered significant at P < 0.05.
RESULTS
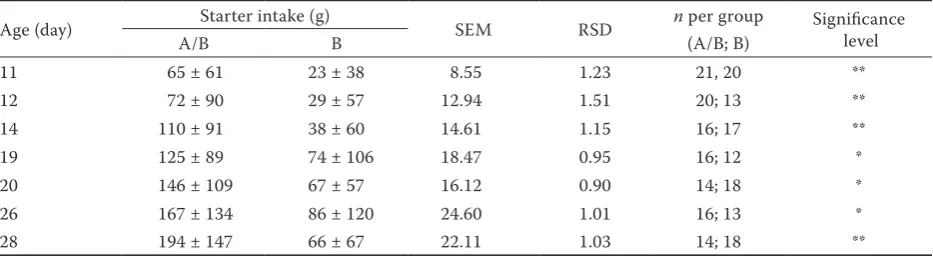
[image:4.595.69.534.113.229.2]Feed intake, body weight, body weight gain. The mean calf starter intake, the body weight and the body weight gain are presented in Table 4. The differences in the carbohydrate content of the diet influenced the feed intake of the calves between days 7 and 45 (P < 0.05). This significant effect was not detected in the second period or in the entire experimental period. Daily analyses of the data revealed that significant differences in feed intake were found on seven days during the experi-ment (Table 5). In the first phase of experiexperi-ment, starter feed consumption of A/B group was higher than that of B group (P < 0.05). The occasionally Table 3. Methodology of microbial culture
Bacteria Media Conditions of incubation
Total aerobic bacteria blood agar 72 h, 30°C, aerobic Total anaerobic bacteria blood agar 48 h, 37°C, anaerobic
E. coli Chromocult differentiation medium1 24 h, 37°C, aerobic Bacteroides Schaedler’s agar2 supplemented with esculin1, neomycin1
and iron ammonium citrate2 96 h, 37°C, anaerobic
Lactobacillus MRS agar1 72 h, 37°C, anaerobic
Clostridium perfringens Tryptose sulphite cycloserine agar1 22 h, 37°C, anaerobic
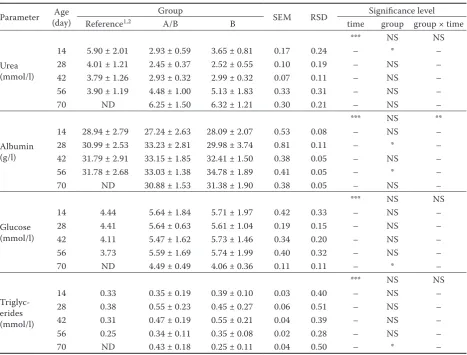
measured higher feed intake did not manifest itself in higher body weight gain by the time of wean-ing, and the daily body weight gain was identical (539 and 537 g/day) in the two groups (Table 4). Blood clinical chemistry parameters.At some of the sampling times, different composition of calf starter diets significantly (P < 0.05) influenced the plasma urea, albumin, glucose and triglyceride con-centrations (Table 6). The effect of this treatment on the other parameters tested was not significant (data not shown). A statistically significant differ-ence (P < 0.05) between the two groups in blood urea level was found only at the first sampling (on day 14), when a lower blood urea level was found in calves fed calf starter “A”. Subsequently the urea levels of the two groups changed at the same rate and in the same direction. Greater concentration of albumin was noticed in calves fed diet “A” on day 28 than in those fed calf starter “B” of higher NDF content. Blood albumin level was increased in calves fed starter diet “B” with their age up to day 56 and exceeded the blood albumin level of the
other group (A/B) on day 56 of life. Blood glucose concentration and blood triglyceride concentra-tion were significantly higher in group A/B on day 70. Blood triglyceride level was the highest at 28 days of age in the group fed the starter diet of higher starch content and at 42 days of age in calves of group B. Age had a significant effect on the plasma concentrations of all clinical chemistry parameters measured. A significant interaction between the dietary treatment and the time was found for albumin (P < 0.01).
[image:5.595.64.533.113.225.2]Composition of the rumen microbiota and ru-men ferru-mentation.The consumption of starter diets of different starch and NDF content had no significant effect either on the composition of the rumen microbiota or on the ruminal ammo-nia content, total VFA concentration and molar percentage of VFAs (Tables 7 and 8). The counts of the tested rumen bacteria (aerobic and anaero-bic bacteria, E. coli, Bacteroides, Lactobacillus, Clostridium perfringens) were nearly the same in the two groups on day 45 (Table 7).
Table 5. Age (in days) when the difference in starter intake between groups is significant (means ± SD)
Age (day) Starter intake (g) SEM RSD n per group Significance level
A/B B (A/B; B)
11 65 ± 61 23 ± 38 8.55 1.23 21, 20 **
12 72 ± 90 29 ± 57 12.94 1.51 20; 13 **
14 110 ± 91 38 ± 60 14.61 1.15 16; 17 **
19 125 ± 89 74 ± 106 18.47 0.95 16; 12 *
20 146 ± 109 67 ± 57 16.12 0.90 14; 18 *
26 167 ± 134 86 ± 120 24.60 1.01 16; 13 *
28 194 ± 147 66 ± 67 22.11 1.03 14; 18 **
[image:5.595.64.531.597.725.2]SEM = standard error of the means, RSD = residuals standard deviation *P < 0.05,**P < 0.01
Table 4. Starter intake, body weight and body weight gain (means ± SD, n = 30 per group)
Examined period
(day) A/B Group B SEM RSD Significance level
Starter intake (g/day)
7–45 148 ± 100 106 ± 85 12.18 0.74 * 46–67 1102 ± 444 1002 ± 408 54.93 0.40 NS
7–67 455 ± 216 389 ± 169 25.20 0.46 NS
Body weight (kg) 671 41.3 ± 3.175.8 ± 8.9 38.9 ± 3.273.4 ± 8.2 0.431.10 0.080.11 NSNS
Body weight gain (g/day) 1–67 539 ± 110 537 ± 112 14.25 0.21 NS
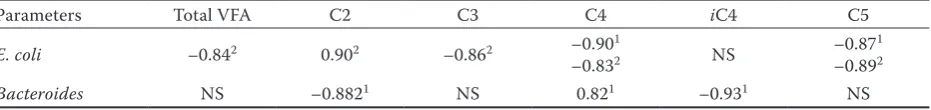
In some cases significant correlations were found between the composition of rumen microbiota and VFA concentrations. Table 9 shows that in
Table 6. Blood concentrations of metabolites in Holstein calves fed either A/B or B diets (means ± SD, n = 10 per group)
Parameter (day)Age Group SEM RSD Significance level Reference1,2 A/B B time group group × time
Urea (mmol/l)
*** NS NS
14 5.90 ± 2.01 2.93 ± 0.59 3.65 ± 0.81 0.17 0.24 – * – 28 4.01 ± 1.21 2.45 ± 0.37 2.52 ± 0.55 0.10 0.19 – NS – 42 3.79 ± 1.26 2.93 ± 0.32 2.99 ± 0.32 0.07 0.11 – NS – 56 3.90 ± 1.19 4.48 ± 1.00 5.13 ± 1.83 0.33 0.31 – NS – 70 ND 6.25 ± 1.50 6.32 ± 1.21 0.30 0.21 – NS –
Albumin (g/l)
*** NS **
14 28.94 ± 2.79 27.24 ± 2.63 28.09 ± 2.07 0.53 0.08 – NS – 28 30.99 ± 2.53 33.23 ± 2.81 29.98 ± 3.74 0.81 0.11 – * – 42 31.79 ± 2.91 33.15 ± 1.85 32.41 ± 1.50 0.38 0.05 – NS – 56 31.78 ± 2.68 33.03 ± 1.38 34.78 ± 1.89 0.41 0.05 – * – 70 ND 30.88 ± 1.53 31.38 ± 1.90 0.38 0.05 – NS –
Glucose (mmol/l)
*** NS NS
14 4.44 5.64 ± 1.84 5.71 ± 1.97 0.42 0.33 – NS – 28 4.41 5.64 ± 0.63 5.61 ± 1.04 0.19 0.15 – NS – 42 4.11 5.47 ± 1.62 5.73 ± 1.46 0.34 0.20 – NS – 56 3.73 5.59 ± 1.69 5.74 ± 1.99 0.40 0.32 – NS – 70 ND 4.49 ± 0.49 4.06 ± 0.36 0.11 0.11 – * –
Triglyc-erides (mmol/l)
*** NS NS
14 0.33 0.35 ± 0.19 0.39 ± 0.10 0.03 0.40 – NS – 28 0.38 0.55 ± 0.23 0.45 ± 0.27 0.06 0.51 – NS – 42 0.31 0.47 ± 0.19 0.55 ± 0.21 0.04 0.39 – NS – 56 0.25 0.34 ± 0.11 0.35 ± 0.08 0.02 0.28 – NS – 70 ND 0.43 ± 0.18 0.25 ± 0.11 0.04 0.50 – * –
SEM = standard error of the means, RSD = residuals standard deviation, ND = not detected, NS = no significant correla-tion, – = not applicable
1Klinkon and Jezek (2012), 2Lee et al. (2014)
values in mg/dl were calculated into mmol/l *P < 0.05, **P < 0.01, ***P < 0.001
calves fed the starter diet of higher starch content (starter “A”) the E. coli counts were negatively cor-related with total VFA concentration and molar Table 7. Composition of the rumen microbiota on day 45 (log10 CFU/g, means ± SD, n = 6 per group)
Bacteria Group SEM RSD Significance level
A/B B
Aerobic bacteria 6.92 ± 0.28 6.86 ± 0.24 0.07 0.04 NS Anaerobic bacteria 8.47 ± 2.91 9.57 ± 0.51 0.60 0.23 NS
E. coli 3.98 ± 0.64 3.58 ± 1.20 0.27 0.25 NS
Bacteroides 7.96 ± 0.83 7.32 ± 0.99 0.27 0.12 NS
Lactobacillus 6.42 ± 0.56 6.30 ± 0.48 0.14 0.08 NS
Clostridium perfringens 3.19 ± 0.37 3.23 ± 0.63 0.14 0.15 NS
[image:6.595.64.532.611.726.2]proportion of propionic acid, butyric acid and valeric acid. At the same time, a higher E. coli count was associated with higher acetic acid ratios. In calves fed starter “B” there was a negative cor-relation between the E. coli counts and the molar ratios of butyric acid and valeric acid. In calves fed starter diet “A” the Bacteroides counts in the rumen fluid were negatively correlated with the molar ratios of acetic acid and isobutyric acid but positively correlated with that of butyric acid.
DISCUSSION
Our main findings were: (i) Feed intake of calves fed elevated dietary starch starter was higher in the first phase of experiment (day 45 of age); (ii) Higher feed intake did not manifest in differences in body weight at weaning time; (iii) Two phase feeding system with different diet composition altered the plasma urea, albumin, glucose and triglyceride concentrations at some of the sampling times; (iv) The consumption of diet with different starch and NDF content had no
significant effect either on the composition of the rumen microbiota or on the ruminal concentration of volatile fatty acids and ammonia.
[image:7.595.68.532.113.271.2]Feed intake, body weight, body weight gain. The higher intakes of starter within the first pe-riod in calves fed diet “A” can be explained by the different feed materials. Similar to present study, a slight preferation of corn based diet by preweaning calves has been demonstrated by Khan et al. (2007). In this regard the type and level of carbohydrate in the diet have a significant ef-fect on the feed intake of calves. However, our observation is in contrast with the statement of Terre et al. (2013), who reported that starch and NDF content of the starter diet have no effect on the feed intake. Significant differences in starter intake were reported earlier when calves were fed restricted or ad libitum amounts of liquid feed (Jasper and Weary 2002; Khan et al. 2007). The daily feed intakes measured in our experiment (group A/B: 455 ± 216 g/day and group B: 389 ± 169 g/day) correspond to the data (424 ± 76 g/day) reported by Rey et al. (2012). However, the latter Table 8. Rumen fermentation parameters of samples collected on day 45 (mean ± SD, n = 6 per group)
Parameter Group SEM RSD Significance level
A/B B
Total VFA (mmol/l) 89.43 ± 35.85 77.65 ± 25.62 8.75 0.36 NS Acetic acid (mol/100 mol) 57.52 ± 10.63 64.80 ± 5.53 2.58 0.15 NS Propionic acid (mol/100 mol) 22.85 ± 4.05 20.99 ± 3.94 1.14 0.18 NS Butyric acid (mol/100 mol) 14.13 ± 6.94 9.77 ± 1.10 1.52 0.44 NS Isobutyric acid (mol/100 mol) 0.66 ± 0.52 0.84 ± 0.41 0.13 0.61 NS Valeric acid (mol/100 mol) 3.91 ± 2.30 2.53 ± 1.20 0.55 0.59 NS Isovaleric acid (mol/100 mol) 0.94 ± 0.38 1.07 ± 0.43 0.11 0.39 NS Acetic acid to propionic acid ratio 2.64 ± 0.98 3.21 ± 0.82 0.26 0.31 NS Ammonia (mmol/l) 9.63 ± 3.85 12.40 ± 8.08 1.79 0.56 NS
VFA = volatile fatty acid, NS =no significant correlation, SEM = standard error of the means, RSD = residuals standard deviation
Table 9. Significant correlations (correlation coefficients, r) between the microbiota composition and the volatile fatty acids concentration (P < 0.05)
Parameters Total VFA C2 C3 C4 iC4 C5
E. coli –0.842 0.902 –0.862 –0.901
–0.832 NS –0.87 1
–0.892
Bacteroides NS –0.8821 NS 0.821 –0.931 NS
NS = no significant correlation, VFA = volatile fatty acid, C2 = acetic acid, C3 = propionic acid, C4 = butyric acid, iC4 = isobutyric acid, C5 = valeric acid
[image:7.595.66.532.349.404.2]authors used a much longer liquid feeding period (lasting up to 83 days of age) in their experiment. In the first phase of the present experiment (days 7–45) the higher starter intake measured in group A/B did not result in significant changes in body weight gain. This might be due to the fact that starter consumption in this first phase is much less than the consumed daily amount of diet in the second phase (148 g vs 1102 g). The differ-ence in the feed intake observed in the first phase disappeared later and did not provide possibility for higher weight gain from birth to weaning. The daily feed intake of the calves showed a drastic increase in the period between days 46 and 67 in both groups, reaching 1102 and 1002 g values, respectively. This may be attributed to a hyper-phagic response caused by the reduced supply of nutrients from milk replacer and milk replacer + whole milk. Several researchers (Hill et al. 2010; Sweeney et al. 2010) demonstrated that feeding greater amounts of milk before weaning may de-lay physical and metabolic rumen development, depressing the solid feed intake around weaning.
Blood clinical chemistry parameters.The clini-cal chemistry parameters of the blood are good indicators of changes occurring in the health status of animals but they are also suitable for monitor-ing certain metabolic processes. The physiologi-cal reference values are well established in adult cattle but only few data are available for calves. The results obtained in the present study were compared with data available in the literature (Table 6). The albumin concentration measured up to 42 days of age shows good agreement with the values reported by Klinkon and Jezek (2012). The plasma urea concentration measured at the first three sampling times is lower, while that found at the fourth sampling is higher than the data presented by Klinkon and Jezek (2012). The plasma glucose and triglyceride values obtained in the present study exceed the values described by Lee et al. (2009). In connection with the values measured in the present experiment it is important to state that we did not find deviations indicative of pathophysiological changes for any of the clini-cal chemistry variables.
A lower blood glucose level and a higher blood urea concentration are physiological phenomena associated with the change of rumen function and the onset of rumen fermentation with the advancement of age. For the newborn calf, glucose
absorbed from the small intestine is the primary energy source, while with the increase in solid feed intake this role of glucose is taken over by VFAs produced in the rumen (Khan et al. 2007, 2008). The starter diet of higher starch content (28.5% vs 14.2%) fed in the first 45 days of life did not cause significant changes in the carbohydrate metabolism of the animals, presumably because at that age the solid feed intake is yet very low (average daily intake 148 g and 106 g, respectively, between days 7 and 45). The higher blood glucose level measured in group A/B after weaning, at 70 days of age was probably not due to the dif-ferent feeding, as from day 46 the calves of both groups consumed starter diet “B”, i.e. the diet of higher NDF content.
The ruminal degradation of higher amounts of solid feed consumed with the advancement of age resulted in increasing blood urea concentration. When feeding starter diet “B” of lower starch but higher NDF content, significantly higher blood urea concentrations were measured in samples taken on day 14. This was presumably due to the faster degradation of the protein of wheat middlings as compared to maize flour, as it was concluded by Herrera-Saldana et al. (1990). However, later blood urea concentration in calves was not affected by the treatments. A probable explanation is that by day 28 the bacterial proteolytic and protein-synthesising processes become balanced in the rumen, and the ammonia resulting from protein degradation is bound by the bacteria and used for microbial protein synthesis. This is indicated by the ammonia concentration of rumen fluid samples taken on day 45. Although ammonia con-centration was higher in group B than in group A/B (12.4 mmol/l vs 9.6 mmol/l), this difference was not statistically significant. It is important to mention here that the higher starch content of starter diet “A” may have contributed to the lower ammonia concentration of the rumen fluid. The highly degradable starch is a rapidly utilisable en-ergy source that provides adenosine triphosphate (ATP) for microbial protein synthesis.
and then it starts to decrease slowly. In calves fed starter diet “B” this decrease started later, after day 42, in accordance with the results described by Schaff et al. (2016).
Rumen microbiota composition and rumen fermentation.The quantity and composition of feed consumed by ruminants affect the composition of the rumen microbiota as well as the intensity and direction of rumen fermentation processes. These are of decisive importance with regard to rumen homeostasis and the animal’s production and health status. Using molecular genetic stud-ies, Rey et al. (2013) demonstrated the dominant presence of Bacteroidetes in the rumen microbiota after 7 days of age, reaching 70% for 42 days of age and becoming the main constituent of the mi-crobiota. After 2 weeks of age the composition of the microbiota did no longer change substantially.
Meale et al. (2016) also found that the phylum Bacteroidetes was the main component of the ru-men microbiota, constituting 96% of the microbial community together with the phyla Firmicutes and Proteobacteria. In the period around weaning, the proportion of Bacteroidetes was found to decrease (from 66 to 42%), while that of the other two phyla increased (from 18 to 34% and from 10 to 20% for Firmicutes and Proteobacteria, respectively). However, a higher intake of starch resulted in the maintained dominance of Bacteroides.
In the present study, the rumen fluid samples taken before weaning (at 45 days of age) already had a microbiota composition characteristic of the adult animal. Of the microorganisms studied, Bacteroides bacteria as well as Clostridia and Lac-tobacilli belonging to the phylum Firmicutes were present in the highest proportions. The effect of feeding a diet of higher starch content (28.5 vs 14.2%) for 45 days could not be supported by the demonstration of statistically significant differ-ences. Although some trend-like changes (higher E. coli and Bacteroides counts, increased total VFA content and lower acetic acid ratio, reduced ammonia content) were visible, the differences were not statistically significant and did not cause changes in growth and feed intake. Our findings partly correlate with the results reported by Be-lanche et al. (2012), according to which higher dietary starch content results in lower concentra-tions of acetic acid and propionic acid and greater ruminal butyrate and valerate. The acetic acid to propionic acid ratio also decreased (2.6 vs 3.2),
consistently with the findings reported in the literature (Noziere et al. 2011).
The role of bacteria constituting the microbiota in the digestion of nutrients in humans and animals is known from whole genome shotgun sequencing studies; however, such data are extremely scarce for the rumen microbial community of ruminants (Meale et al. 2016). In addition to bacteria, ar-chaea, protozoa and yeasts are also inhabitants of the rumen and participate in the degradation of carbohydrates and proteins as well as in micro-bial protein synthesis in a highly complex system, many of the elements of which are still unknown. Therefore, the quantitative changes of individual bacteria not necessarily indicate a change in ru-men function, and the alterations found in ruru-men function cannot always be attributed to changes in certain microbiota components.
CONCLUSION
In summary, it can be established that feeding a diet of higher starch content (28.5 vs 14.2%) in the first 45 days of life does not affect rumen fermentation, rumen microbiota and the most important blood metabolites, apart from a few exceptions. Feeding higher dietary starch starter to day 45 results in a better feed intake, but it does not affect weight gain of calves. In the first 6 weeks feed consumption of calves is negligible compared to the later stage, so the higher feed intake observed at this stage has insignificant effect on the growth of calves.
It would be worth studying the effect of starter diets containing different carbohydrate sources over a longer period of time, perhaps extended up to weaning. Such prolonged studies could perhaps demonstrate the statistical significance of the trend-like changes found in this study.
REFERENCES
Baldwin R.L.V.I, McLeod K.R., Klotz J.L., Heitmann R.N. (2004): Rumen development, intestinal growth and he-patic metabolism in the pre- and postweaning ruminant. Journal of Dairy Science, 87, 55–65
of microbial protein synthesis. Journal of Animal Science, 90, 924–936.
Broderick G.A., Kang J.H. (1980): Automated simultane-ous determination of ammonia and total amino acids in ruminal fluid and in vitro media. Journal of Dairy Science, 63, 64–75.
Herrera-Saldana R.E., Hubert J.T., Poore M.H. (1990): Dry matter, crude protein, and starch degradability of five cereal grains. Journal of Dairy Science, 73, 2386–2393. Hill T.M., Bateman H.G., Aldrich J.M., Schlotterbeck R.L.
(2010): Effect of milk replacer program on digestion of nutrients in dairy calves. Journal of Dairy Science, 98, 1105–1115.
Jasper J., Weary D.M. (2002): Effects of ad libitum milk intake on dairy calves. Journal of Dairy Science, 85, 3054–3058.
Khan M.A., Lee H.J., Lee W.S., Kim H.S., Kim S.B., Ki K.S., Park S.J., Ha J.K., Choi Y.J. (2007): Starch source evalu-ation in calf starter: I. Feed consumption, body weight gain, structural growth, and blood metabolites in Holstein calves. Journal of Dairy Science, 90, 5259–5268. Khan M.A., Lee H.J., Lee W.S., Kim H.S., Kim S.B., Park
S.B., Baek K.S., Ha J.K., Choi Y.J. (2008): Starch source evaluation in calf starter: II. Ruminal parameters, ru-men developru-ment, nutrient digestibilities and nitrogen utilization in Holstein calves. Journal of Dairy Science, 91, 1140–1149.
Klinkon M., Jezek J. (2012): Values of blood variables in calves. In: Perez-Marin C.C. (ed.): A bird’s-eye-view of veterinary medicine. InTech Europe, Rijeka, Croatia, 301–320.
Lee H.J., Khan M.A., Lee W.S., Yang S.H., Kim S.B., Ki K.S., Kim H.S., Ha J.K., Choi Y.J. (2009): Influence of equalizing the gross composition of milk replacer to that of whole milk on the performance of Holstein calves. Journal of Animal Science, 87, 1129–1137.
Meale S.J., Li S., Azevedo P., Derakhshani H., Plaizier J.C., Khafipour E., Steele M.A. (2016): Development of ruminal and fecal microbiomes are affected by weaning but not weaning strategy in dairy calves. Frontiers in Microbiol-ogy, 7, 582.
Meale S.J., Chaucheyras-Durand F., Berends H., Guan L.L., Steele M.A. (2017): From pre- to postweaning: Transfor-mation of the young calf’s gastrointestinal tract. Journal of Dairy Science, 100, 1–12.
National Research Council (2001): Nutrient Requirements of Dairy Cattle. 7th Ed. The National Academies Press,
Washington, DC, USA.
Noziere P., Glasser F., Sauvant D. (2011): In vivo produc-tion and molar percentages of volatile fatty acids in the rumen: A quantitative review by an empirical approach. Animal, 5, 403–414.
Rey M., Enjalbert F., Monteils V. (2012): Establishment of ruminal enzyme activities and fermentation capacity in dairy calves from birth through weaning. Journal of Dairy Science, 95, 1500–1512.
Rey M., Enjalbert F., Combes S., Cauquil L., Bouchez O., Monteils V. (2013): Establishment of ruminal bacterial community in dairy calves from birth to weaning is se-quential. Journal of Applied Microbiology, 116. 245–257. Roth B.A., Keil N.M., Gygax L., Hillmann E. (2009): Influ-ence of weaning method on health status and rumen development in dairy calves. Journal of Dairy Science, 92, 645–656.
Schaff C.T., Gruse J., Maciej J., Mielenz M., Wirthgen E., Hoeflich A. (2016): Effects of feeding milk replacer ad libitum or in restricted amounts for the first five weeks of life on the growth, metabolic adaptation and immune status of newborn calves. PLoS ONE, 11, e0168974.
Suarez B.J., Van Reenen C.G., Stockhofe N., Dijkstra J., Ger-rits W.J.J. (2007): Effect of roughage source and roughage to concentrate ratio on animal performance and rumen development in veal calves. Journal of Dairy Science, 90, 2390–2403.
Sweeney B.C., Rushen J., Weary D.M., Passille A.M.D. (2010): Duration of weaning, starter intake, and weight gain of dairy calves fed large amounts of milk. Journal of Dairy Science, 93, 148–152.
Terre M., Pedrals E., Dalmau A., Bach A.: (2013): What do preweaned and weaned calves need in the diet: A high fiber content or a forage source? Journal of Dairy Science, 96, 5217–5225.