Abstract— Ultrasound imaging is one of the most widely used medical diagnosis technique and is normally used to visualize internal organs, muscles, or any internal fracture. However, ultrasound images contain a type of machine- dependent multiplicative noise called speckle noise, which tends to reduce image resolution and contrast, thereby reducing the diagnostic value of this imaging modality and hampering the physician’s capability to take accurate decisions. The more diagnostic information that can be presented in an ultrasound image, the easier it is to make decision about the treatment plan. Therefore, preprocessing is very important to remove such noise. This paper describes and analyzes a hybrid algorithm to remove speckle noise from ultrasound images by preserving more image details. This technique combines the concepts of linear and nonlinear filtering techniques; in linear filtering, processing is done on the basis of linear mapping using linear filters such as mean filter, inverse filter and wiener filter etc. In nonlinear filtering, processing is performed according to nonlinear mapping, using nonlinear filter such as median filter. In particular, at the time of filtering a 3×3 image kernel is divided into three segments and various linear and non-linear filtering techniques are applied to each segment and finally integrated to achieve the results. The performance of the proposed method is evaluated by calculating the signal to noise ratio, edge preservation factor, root mean square error, and structure similarity index. The proposed method provides better results when compared with other widely used despeckling techniques.
Index Terms—Linear filter, Nonlinear filter, Speckle noise,
Ultrasound image
I. INTRODUCTION
LTRASOUND imaging is considered one of the most widely used and safe medical diagnosis technique among the currently available medical imaging modalities. It is noninvasive, easily portable, harmless to the human body, painless, accurate, and cost effective. These features have made ultrasound imaging the most prevalent diagnostic tool
Manuscript received December 28, 2017; revised January 25, 2018. M. H. Talukder, Graduate School of Engineering, Department of Industrial Engineering and Management, Kanagawa University, Yokohama, Japan (e-mail: [email protected]).
M. Ogiya, Faculty of Engineering, Department of Industrial Engineering and Management, Kanagawa University, Yokohama, Japan (e-mail: [email protected]).
M. Takanokura, Faculty of Engineering, Department of Industrial Engineering and Management, Kanagawa University, Yokohama, Japan (e-mail: [email protected]).
in today’s sophisticated diagnosis all over the world. It has no known long-term side effects and rarely causes any discomfort to the patient. Since it does not use ionizing radiation, ultrasound involves no risks to the patient. It provides live images, where the operator can select the most useful section for diagnosing, thus facilitating quick diagnoses.
Speckle noise is an inherent property of medical ultrasound imaging that degrades the quality of ultrasound images. Speckle noise is a multiplicative noise that appears as a granular pattern that varies depending on the type of biological tissue. However, it is well-known that speckle noise tends to reduce image contrast and obscure and blur image details, thereby decreasing the quality, reliability, and usefulness of medical ultrasound imaging. As a result, image processing methods for removing speckle noise are very important for enhancing image quality and increasing the diagnostic potential of medical ultrasound imaging.
Image de-noising is a vital image processing task. There are many different methods to de-noise an image. Traditionally, there are two types of models- linear and nonlinear- that are used for removing noise [1]. The speed of linear noise removing models is very high; this is the major benefits of using the linear model. However, linear models cannot preserve the edges of images in an efficient manner, which is a major limitation of these models [1], [2]. The edges of an image are points at which the luminous intensity changes sharply, which usually reflect important changes in the properties of the image. Therefore, edge preservation is very importance to identify and understand the whole image. The simplest example of linear filtering is the mean filter [1], [2] which uses a mask over each pixel in the signal. Each of the components of the pixels that fall under the mask are averaged together to form a single pixel. This filter is also called an average filter. The mean filter has a poor edge preservation performance.
On the other hand, nonlinear models can handle edges in a much better way compared with linear models [1]. A vary widely used nonlinear filter is median filter [2], [3], which is used to remove speckle noise from an ultrasound image. It assigns the median value of its neighborhoods to each pixel. The median is calculated by first sorting all pixel values from the surrounding neighborhoods into numerical order and then replacing the pixel being considered with the middle pixel value. This filter is relatively slow but it does not blur the contour of the objects.
Hybrid Technique for Despeckling Medical
Ultrasound Images
Mehedi Hasan Talukder, Mitsuhara Ogiya, Masato Takanokura
Different methods such as linear and nonlinear filtering, and wavelet-based despeckling have been proposed to reduce noise. Based on median filtering, Czerwinski et al. [4] presents a novel adaptation of the median filter that is used to solve the problem of boundary-preserving speckle reduction. This adaptive median filtering is based on the sticks techniques. Czerwinski et al. took a set of short lines passing through the center of a square shaped kernel and computed the median, along each line. Finally, the largest median value was considered as the central pixel. Chinrungrueng et al. [5] proposed an edge-preserving noise reduction method using two-dimensional Savitzky-Golay filters, which is based on the least square fitting of a polynomial function to image intensities. Though it takes less computation time than the median filter, the effect of noise reduction was same as that of the median filter.
Tannenbaum et al. [6] proposed a modified homomorphic wavelet despeckling (HWDS) algorithm. The purpose of this study was to improve the performance of HWDS and this modification is accomplished by adding a preprocessing stage to the standard HWDS structure, which is intended to alter noise statistics without changing the anatomical content of the image. They performed this preprocessing in two steps. First, a radiofrequency image is subjected to a spectrum equalization procedure intended to decorrelate the image samples. Second, the log-transformed envelope image is passed through a nonlinear outlier-shrinkage procedure, whose purpose is to suppress the spiky component of the log transformed speckle noise. Karaman et al. [7] presented an adaptive filtering technique to remove speckle pattern from ultrasound images. This methodology is based on filtering using local kernels with an appropriate shape and size. Smoothing operators (mean or median) are applied in regions where the tissue is assumed to be homogeneous. For each image pixel these regions are obtained through a local-statistics based region growing technique constrained only by statistical properties and the distance from the central pixel.
The aim of this work is to propose a new noise reduction technique for medical ultrasound images and to compare the performance of this proposed technique with various popular and well known linear and nonlinear noise removing techniques. The important property of good image denoising models is that it should completely remove noise as far as possible and preserve edges. This article aims to propose a hybrid noise-removing technique by combining the concept of both linear and nonlinear techniques. This article combines the concept of a midpoint filter, median filter, and mean filter. When compared with other techniques, this filter performs better noise reduction for ultrasound images by preserving edges and other image details.
II. SPECKLE NOISE MODEL
Speckle noise is a multiplicative noise that affects all coherent imaging systems, including medical ultrasound. The most critical part of developing a method for recovering a signal from its noisy environment is choosing a reasonable statistical (or analytic) description of the physical phenomena underlying the data-formation process. The availability of an
accurate and reliable model of speckle noise formation is a prerequisite for the development of a valuable despeckling algorithm. However, in ultrasound imaging, the unified definition of such a model remains arguable. Yet, there exist a number of possible formulae whose probability was verified via their practical use. A possible generalized model of the speckle imaging is
)
,
(
)
,
(
)
,
(
)
,
(
n
m
f
n
m
u
n
m
n
m
g
(1)Where g, f, and u and ξ stand for the observed image, original image, and multiplicative and additive components of the speckle noise, respectively. Here (n, m) denotes the axial and lateral indices of the image samples or, alternatively, the angular and range indices for B-scan images. When applied to ultrasound images, only the multiplicative component of the noise is to be considered; thus, the model can be considerably simplified by disregarding the additive term. Thus the simplified version of this equation becomes
)
,
(
)
,
(
)
,
(
n
m
f
n
m
u
n
m
g
(2)Where g is the observedimage, f is the original image and u is the multiplicative component of speckle noise.
III. PROPOSED METHOD
This technique combines the concepts of the median filter, mean filter, and midpoint filter. The median filter is a nonlinear filter that replaces the central pixel value by the median value of its neighborhoods. The mean filter is a linear filter that replaces the central pixel value by the average of its neighborhood pixels. At the time of implementing any linear or nonlinear filtering technique such as a median filter, or mean filter, the total area of the kernel is considered for processing each pixel. For this reason, the image becomes very smooth and edges can also get hampered. If we can consider the smallest region, it is possible to preserve the edges and other important image details, which is very important for understanding the whole image. This article represents a new filtering procedure based on this concept. In case of the proposed filtering technique, the filter kernel is divided into several sections and various linear and nonlinear filtering concepts are applied to each section. Finally, the results of each section are combined and the final result is calculated. Speckle noise is removed by processing the value of each pixel. For each window, we find the value of the central pixel from the whole window.
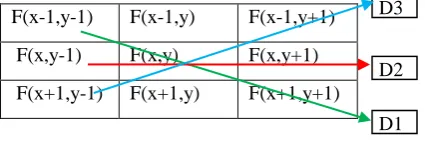
Suppose a 3×3 window is considered, which contains 9 pixel values. This total window is divided into three sections, and each section is processed individually. The window is as shown in Fig.1.
[image:2.595.337.550.677.750.2]F(x-1,y-1) F(x-1,y) F(x-1,y+1) F(x,y-1) F(x,y) F(x,y+1) F(x+1,y-1) F(x+1,y) F(x+1,y+1)
Fig. 1: A 3×3 Region of an Image
Here, this window is divided into three parts, and filtering is performed as follows
Step-1: The three pixel values of the first row or the values of first column or the diagonal values (shown by D1 in Fig.1) are taken in an array and each value is replaced by the Midpoint value of these three pixels. In smoothing, the midpoint value is calculated by averaging the minimum and maximum values of these three pixels, and each value is replaced by this value.
Step-2: The image coefficient values of the second row or the second column or the diagonal values (shown by D2 in Fig.1) are taken in an array and sorting is performed. Each value of this array is replaced by the Median value of those values.
Step-3: The values of third row or third column or diagonal values (shown by D3 in Fig.1) are taken in an array and the Mean value of this array is calculated. Each value of the array is replaced by this Mean value.
Step-4: The three arrays are merged and sorting is performed. The central pixel of this window is replaced by the median value.
IV. RESULTS AND DISCUSSIONS
Simulation studies are usually the first validation step used to examine the performance of an estimation method in a quantitative manner. To validate the efficiency of proposed filtering technique, the simulation study was carried out using the MATLAB Toolbox and ImageJ Toolbox. Three ultrasound images (kidney, abdomen, and ortho) are used in this study to verify the result. First, an original noise free image is selected and a contaminated image with speckle noise (noise factor 0.04) is selected. Various existing and proposed filtering techniques are applied to find the results.
Here, for the experiment 3×3 region of the image is processed in multiple ways and the results are tested. Table I represents the quantitative performance of the proposed filtering technique in various directions. First, linear and nonlinear processing are performed in the diagonal direction but the results are poor. If we perform processing in the diagonal direction, the central pixel is considered several times. If the central pixel is noisy, then this noisy pixel is considered for all processing steps, and this degrades the performance. This processing is also performed column wise and row wise.
TABLEI
QUANTITATIVE MEASUREMENTS OF PROPOSED TECHNIQUE IN VARIOUS
DIRECTIONS
Filter Name Image Name SNR EPF
Processing Row wise
Kidney 11.9 0.22
Abdomen 12.9 0.25
Ortho 11.9 0.21
Processing Column wise
Kidney 11.9 0.21
Abdomen 12.6 0.23
Ortho 11.8 0.21
Processing Diagonally
Kidney 11.1 0.17
Abdomen 12.01 0.21
Ortho 11.03 0.16
Normally, the performance of various filtering techniques depends on the characteristics of images. For some ultrasound
images, column-wise processing provides the approximately the same results as for row-wise processing; however most row-wise processing provides better results. From Table I, one can see that when processing is performed according to the direction of the row of the window, then higher signal-to-noise ratio (SNR) and edge preservation factor (EPF) values are obtained. Thus, row-wise processing is selected in this study for processing ultrasound images.
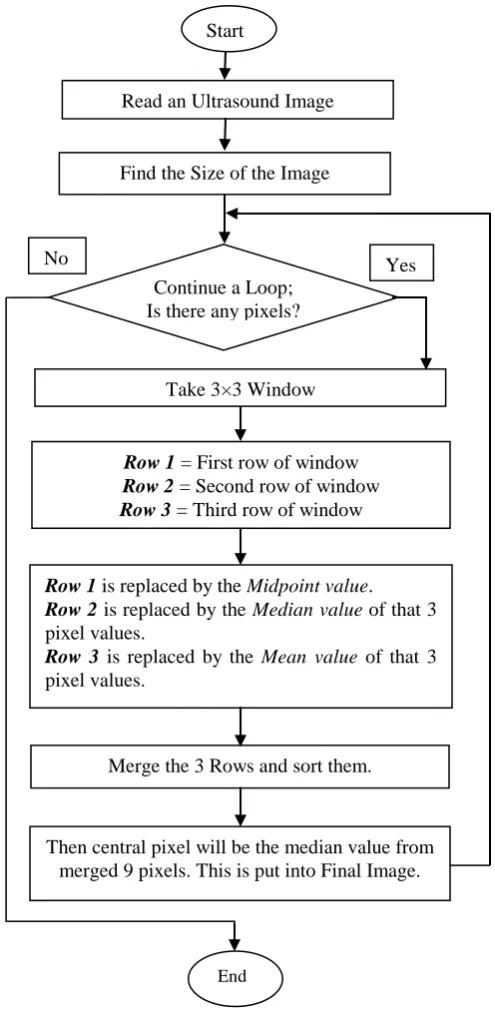
The overall working procedure of proposed filtering technique is shown as a flowchart in Fig. 2.
Fig. 2: Flow diagram of proposed filtering technique. In this flowchart first, an input image is read, and the size of this image is calculated. A loop is executed from the first pixel to the last pixel of the image to perform the desired operation to remove speckle noise from this image. The median filter is very popular and widely used nonlinear method. The mean filter is also widely used linear method. If we used midpoint value at the time of processing then it is possible to remove
Start
Continue a Loop; Is there any pixels? Read an Ultrasound Image
Find the Size of the Image
Take 3×3 Window
Row 1 = First row of window Row 2 = Second row of window
Row 3 = Third row of window
Merge the 3 Rows and sort them.
Then central pixel will be the median value from merged 9 pixels. This is put into Final Image. Row 1 is replaced by the Midpointvalue. Row 2 is replaced by the Medianvalue of that 3 pixel values.
Row 3 is replaced by the Mean value of that 3 pixel values.
End
[image:3.595.312.560.180.687.2]noise perfectly; for these reasons, this article combines the concepts of median, mean and midpoint filter.
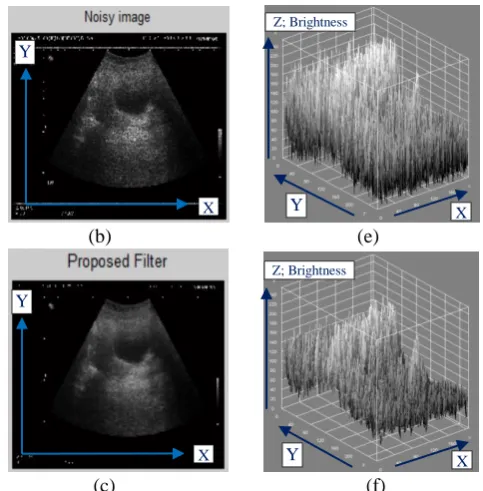
A representative result of figurative measurements is demonstrated in Figs. 3, 4 and 5 for various ultrasound images.
(a) (d)
(b) (e)
(c) (f)
Fig. 3: Kidney image; a) Original image, b) Noisy Image, c) Filtered by proposed technique, d) Interactive 3D surface plot of original image, e) Interactive 3D surface plot of noisy image, f) Interactive 3D surface plot of filtered image.
(a) (d)
(b) (e)
(c) (f)
Fig. 4: Abdomen image; a) Original image, b) Noisy Image, c) Filtered by proposed technique, d) Interactive 3D surface plot of original image, e) Interactive 3D surface plot of noisy image, f) Interactive 3D surface plot of filtered image.
(a) (d)
(b) (e)
(c) (f)
Fig. 5: Ortho image; a) Original image, b) Noisy Image, c) Filtered by proposed technique, d) Interactive 3D surface plot of original image, e) Interactive 3D surface plot of noisy image, f) Interactive 3D surface plot of filtered image. X
X
X
X X
X
X
X X
Y
Y
Y
Y Y
Y
Y
Y
Y
Z; Brightness Z; Brightness
Z; Brightness
Z; Brightness Z; Brightness
Z; Brightness
Z; Brightness
Z; Brightness Z; Brightness
X X
Y Y
X
Y
X
Y
X
Y
X
Y
X
Y
X
Y
X
[image:4.595.306.548.48.294.2] [image:4.595.49.291.124.543.2] [image:4.595.308.548.358.732.2]Despeckling was first implemented using the MATLAB Toolbox. In this case, despeckling is expected to reconstruct the original image by preserving edges and other image details. Second, the interactive 3D surface plots of the original image, noisy image, and filtered image are examined by using the ImageJ toolbox. From these Figs. 3, 4 and 5, it is clear that the proposed filtering technique provides better visual appearances in the case of removing speckle noise from ultrasound images. In the 3D surface plot (d, e, and f) X, Y, and Z represents the spatial co-ordinates and brightness values. The vertical line represents the value of the pixels. Speckle noise is a multiplicative noise that has granular patterns and image pixels affected by speckle noise contain the higher value than the original. From the 3D surface plot of the noisy image (e), it is clear that this image contains speckle noise. The 3D surface plot of the filtered image (f), which is almost similar to the original image (d), indicates that the proposed filter can remove the speckle noise almost perfectly. Despeckling is performed by using five well known image denoising techniques. Quantitative measurement of the performance of various filtering technique for removing speckle noise from ultrasound images are represented by the following Table II. For the quantitative assessment, a number of performance measures were used to compare the performance of despeckling methods. This measurement is performed on basis of the value of SNR, EPF, root mean square error (RMSE), and structure similarity index (SSIM).
TABLEII
QUANTITATIVE MEASUREMENTS OF THE PERFORMANCE OF VARIOUS
FILTERING TECHNIQUES
Filter Name
Image Name
SNR EPF RMSE SSIM
Median
Kidney 11.6 0.15 0.08 0.69
Abdomen 12.7 0.19 0.07 0.79
Ortho 11.8 0.17 0.09 0.66
Average
Kidney 11.3 0.18 0.04 0.59
Abdomen 12.6 0.21 0.03 0.72
Ortho 11.5 0.15 0.05 0.55
Inverse
Kidney 6.7 0.10 0.17 0.43 Abdomen 5.1 0.09 0.13 0.60
Ortho 0.6 0.09 0.16 0.45
Wiener
Kidney 10.2 0.19 0.06 0.25 Abdomen 11.2 0.17 0.04 0.12 Ortho 11.5 0.18 0.08 0.29 Proposed
Method
Kidney 11.9 0.22 0.08 0.99
Abdomen 12.9 0.25 0.07 0.99 Ortho 11.9 0.21 0.09 0.99
From Table II, it is clear that, the proposed filtering technique provides better results. One can observe the significant improvement of the value of speckle-SNR, by applying this proposed filtering technique. This filter also provides SSIM value which is very close to the standard value of 1. The proposed filter also provides a higher EPF value and reduces the RMSE value in the case of removing speckle noise from various ultrasound images. By using the proposed
filter, processing is performed by considering the smallest region of ultrasound images; which helps improve the SNR and other measurements matrices. All traditional noise removal techniques perform processing by considering the total region of the kernel, which affects the edges of image; this limitation is also removed by the proposed method.
V. CONCLUSION
Human vision is very sensitive to high-frequency information. Image details (e.g., corners and lines) have high frequency contents and carry very important information for visual perception. Accordingly, the purpose of this study was to develop a new filtering technique for despeckling medical ultrasound images and to compare the performance of proposed technique with various traditional despeckling techniques. A new hybrid filtering technique is proposed by this study that combines the concepts of linear and nonlinear methods. The performance of the proposed method is compared with four well known image denoising methods. In conclusion, from those measurements it is clear that proposed filter provides better output for kidney, abdomen and ortho images compared with existing filters.
ACKNOWLEDGMENT
The authors would like to thank The National Institute of Traumatology and Orthopaedic Rehabilitation, Bangladesh for the ultrasound images kindly provided to them. The authors also would like to thank Prof. Dr. Mohammad Motiur Rahman of MBSTU for his cordial help to collect ultrasound images.
REFERENCES
[1] P. Patidar, M. Gupta, S. Srivastava, A.K. Nagawat, “Image De-noising by Various Filters for Different Noise”. International Journal of Computer Applications, Vol. 9, pp. 45–50, Nov. 2010.
[2] J. C. Church, Y. Chen, S. V. Rice, “A Spatial Median Filter for Noise Removal in Digital Images”. IEEE, pp. 618-623, June 2008. [3] R. Sivakumar, M.K Gayathri, D. Nedumaran, “Speckle Filtering Of
Ultrasound B-Scan Images - A Comparative Study Between Spatial And Diffusion Filters”. IEEE Conference on Open System, pp.80-85, Dec. 2010.
[4] R. N. Czerwinski, D. L. Jones, W. D. O’Brien, “Ultrasound Speckle Reduction by Directional Median Filtering”. International Conference on Image Processing, IEEE, Vol. 1, pp. 358–361, Apr. 2003. [5] C. Chinrungrueng, A. Suvichakorn, “Fast Edge Preserving Noise
Reduction for Ultrasound Images”. IEEE Transactions on Nuclear Science, vol-48, pp. 849-854, June 2001.
[6] O. V. Michailovich, A. Tannenbaum, “Despeckling of Medical Ultrasound Images”. ieee transactions on ultrasonics, ferroelectrics, and frequency control, vol. 53, pp. 64-78, January 2006.
[7] M. Karaman, M. A. Kutay, G. Bozdagi, “An Adaptive Speckle Suppression Filter for Medical Ultrasonic Imaging” IEEE Transactions on Medical Imaging, vol. 14, pp. 283-292, June 1995.
[8] P. K. Patidar, Lalit, B. Singh, G. Bagaria, “Image Filtering using Linear and Non Linear Filter for Gaussian Noise”. International Journal of Computer Applications, Vol. 93, pp. 29-34, May 2014.
[9] M. B. Gupta, M. S. S. Negi, “Image Denoising with Linear and Non-Linear Filters: A Review”. International Journal of Computer Science Issues, Vol. 10, pp. 149-154, Nov 2013.
[11] S. Joseph, K. Balakrishnan, M.R. B. Nair, R. R. Varghese. “Ultrasound Image Despeckling using Local Binary Pattern Weighted Linear Filtering”. International Journal of Information Technology and Computer Science, 2013, vol. 06, pp. 1-9, June 2013.
[12] T. Loupas, W.N. Mcdicken, P.L. Allan, “An Adaptive Weighted Median Filter for Speckle Suppression in Medical Ultrasonic Images”. IEEE Transactions on circuits and systems. Vol. 36, pp. 129-135. Jan. 1989.
[13] I. Njeh, O. B. Sassi, K. Chtourou, A. B. Hamida, “Speckle Noise Reduction In Breast Ultrasound Images: Smu (Srad Median Unsharp) Approch”. International Multi-Conference on Systems, Signals & Devices, Jul. 2011.
[14] A. F.Caballero, J. L.Mateo, “Methodological Approach to Reducing Speckle Noise in Ultrasound Images”, International Conference on Bio Medical Engineering and Informatics, 2008.
[15] E. A.Castro and D.L. Donoho, "Does median filtering truly preserve edges better than linear filtering?", Annals of Statistics, vol. 37, no. 3, pp. 1172-1206, Apr. 2009.
[16] S. Sudha, G.R Suresh, R. Sukanesh, “ Speckle Noise Reduction in Ultrasound Images by Wavelet Thresholding based on Weighted Variance”. International Journal of Computer Theory and Engineering, Vol. 1, No. 1, April 2009.
[17] S. K. Narayanan and R. S. D. Wahidabanu, “A View on Despeckling in Ultrasound Imaging”. International Journal of Signal Processing, Image Processing and Pattern Recognition, Vol. 2, pp. 85-98, Sep 2009.