A Case-Based Explanation System for ‘Black-Box’
Systems
Conor Nugent, Pádraig Cunningham
Computer Science, Trinity College, Dublin 2, Ireland {Conor.Nugent, Padraig.Cunningham}@cs.tcd.ie
Abstract. Most users of machine-learning products are reluctant to use the systems without any sense of the underlying logic that has led to the system’s predictions. Unfortunately many of these systems lack any transparency in the way they operate and are deemed to be ‘black boxes’. In this paper we present a Case-Based Reasoning (CBR) solution to providing supporting explanations of black-box systems. This CBR solution uses locally derived feature ranking information that reflects the importance of each feature to a prediction and a locally adjusted case retrieval mechanism. The retrieval mechanism takes advantage of the derived feature weightings to help select cases that are a better reflection of the black-box solution and thus more convincing explanations.
“Computers are useless. They can only give you answers.” - Pablo Picasso.
1. Introduction.
In machine learning research the quest for increasingly more accurate and stable classifiers has lead to ever more complicated algorithms. Ensemble approaches and algorithms such as Support Vector Machines and Neural Networks have reached a level of complexity where they are not readily interpretable. Such approaches, and those like them, are commonly referred to as ‘black box’ algorithms owing to their lack of transparency with regard to the logic behind the predictions they make.
Although increases in accuracy are welcomed, recent research has highlighted the need for interpretability and transparency as a critical aspect in the implementation of machine learning techniques in real world applications [1]. People are understandably reluctant to accept without question the predictions from black-box systems.
in reality such systems are limited in the level of fidelity that they can achieve while maintaining some level of interpretability. The differing bias of the black-box algorithm and that of the one being used for explanations means that it can be difficult to fully capture the operation of the black-box system. Domingos focused on how well an explanation facility captured the improvements gained through the use of ensemble techniques. He found that it retained just 60% of the gains [4]. More accurate descriptions of the operation of the black box often come at the cost of increasingly more complex tree and rule-based systems. This trade off in interpretability means that such approaches are of limited use as a convincing explanation system when the underlining problem is complex and the credibility of the system can be damaged by bad, inaccurate or convoluted explanations.
Conversely CBR systems have an inherent transparency that has particular advantages for explanations as Leake points out ([5]):
“…neural network systems cannot provide explanations of their decisions and rule-based systems must explain their decisions by reference to their rules, which the user may not fully understand or accept. On the other hand, the results of CBR systems are based on actual prior cases that can be presented to the user to provide compelling support for the system’s conclusions.”
The use of actual training data, cases from the casebase, as evidence in support of a particular prediction is a powerful and convincing form of explanation. Research by Cunningham et al has further supported the claim that CBR explanations are more convincing than rule-based explanations in some domains [6]. McSherry too argues in favour of case-based explanations highlighting some of the potential shortcomings of rule-based systems [7]. The use of a case-based explanation facility for black-box systems also helps remove the inherent fidelity/interpretability trade-off that exists in the approaches discussed previously. This has motivated us to investigate the development of a case-based explanation facility for black-box systems. This paper describes the work that we have done so far in developing such a system and is structured as follows. Section 2 provides an overview of the relevant work on explanation from CBR research while Section 3 introduces our case-based explanation approach for regression problems. Some examples of this system in operation are shown in Section 4. The paper concludes with Section 5.
2. Explanation in CBR and Explanations for Black Boxes
argument, to the validity of the prediction. This is an issue that has recently received a lot of attention in the CBR community.
Doyle et al.[8] have focused on the observation that the nearest retrieved case in a CBR system may not be the best case to present as an explanation. They argue that in classification tasks, cases that are between the query case and the decision boundary provide more convincing explanations. That is, cases that are more marginal on the important criteria are more convincing. With such cases the user is better able to assess whether the classification of the target case is justified.
In other work, McSherry [7] has focused on the relationship between the feature values within a case and its predicted value. He argues that simply presenting the feature values in the most similar cases may be misleading. The relationship between feature values and the predicted value may not always be a positive one; the presence of some feature values may in fact be evidence against the prediction. Simply supplying the user with a case may lead them to incorrectly infer the relationship between feature-values and the prediction. To provide the user with a more informative explanation, McSherry has developed an evidential approach in which the user is present with extra information about the relationship of the case feature-values to the predicted class.
The work of Doyle et al. and McSherry has highlighted important issues relating to case-based explanations as well as proposing convincing solutions. It can be seen that providing the appropriate cases as well as highlighting the salient feature-value relationships within those cases are important factors in designing a successful case-based explanation facility.
These factors are particularly important when considering CBR explanations for black-box systems. Many of these systems are used because of their abilitie to accurately model non-linear problems. The non-linear nature of the underlining problems may mean that the relationship between features and the prediction values may vary across the feature space. Some features may be important in some areas of the feature space and not at all relevant in other areas. This means that it would be highly useful to provide the user with a sense of how each feature-value contributed to a given prediction. It would be useful to rank each feature based on the impact it had on a given prediction and whether that impact was negative or positive. This would provide the user with a sense of the relationship of feature-values to prediction for the presented case that they can then critically assess. These rankings will also focus the user’s attention on the more important features of a case.
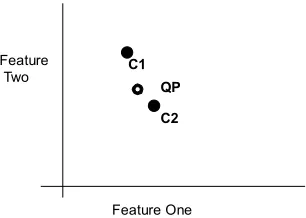
Ideally we would like to present the user with cases that reinforce the black box’s prediction. However, the non-linear nature of the relationship of features to prediction also has implications for the selection of cases to present the user with. The feature rankings may indicate that some features are more important than others and this should be reflected in the retrieval process. For instance imagine a simple two feature problem has been learnt by a black box and we would like to select a case to use as an explanation of a prediction given for a particular set of inputs, QP. As can be seen in Fig. 1, if the features are un-weighted, C1 is the nearest neighbour.
relation to it and so these are the cases we should seek out. By warping the axis using the feature weights as in Fig. 2, greater emphasis can be put on this feature and a different nearest neighbour, C2, is found
QP C1
C2
Feature One Feature
[image:4.595.312.465.205.314.2]Two
Fig. 1. The distribution of QP and its neighbours across the feature space with un-weighted axis.
Feature One Feature
Two
QP C1
[image:4.595.131.273.206.318.2]C2
Fig. 2. QP and its neighbours with weighted axis.
We believe that the provision of CBR explanations for black boxes based on the local derived feature ranking and the presentation of appropriately selected cases as discussed will provide users of black-box systems with satisfactory explanations. In the following section we discuss the implementation of such a system for regression tasks.
3. An Explanation System for Regression
Although this paper advocates case-based explanations for black boxes for both classification and regression, the following discusses the implementation for a regression system. As discussed above there are two important tasks that are integral to the explanation system previously discussed, local feature salience information and the provision of cases that are appropriate given the feature rankings. Previously these tasks had been talked about in an abstract sense but we will now discuss in concrete terms how these objectives can be achieved in regression problems.
3.1 Local Feature Ranking
The black box allows us to get a prediction for any set of feature-values we care to imagine. We can present the black box with feature-value sets similar to those of query case and so can build up a case-base around the original query point. This is done by perturbing, in a controlled manner, the feature values of the case we’re providing an explanation for and using the black box to attach a prediction to the artificial case. As an example of how this might be done imagine we have a neural network model that predicts the Blood-Alcohol content (BAC) in a person’s blood after they have consumed a certain amount of units of alcohol and stopped drinking. The graph of the function learnt by the neural network (NN) might look something like the one in Fig.3. As the consumed units are absorbed into the body the BAC value increases until it has reached a maximum value from where the level then begins to fall back down as the body processes the alcohol.
Time BAC
QC
Learnt Curve P(T)
[image:5.595.166.401.313.454.2]T hours
Fig. 3. The function learnt by the NN- BAC vs. Time.
Time BAC
QC AC1
[image:6.595.180.393.159.287.2]AC2
Fig. 4. Artificial Data Points AC1 and AC2 are created around QC.
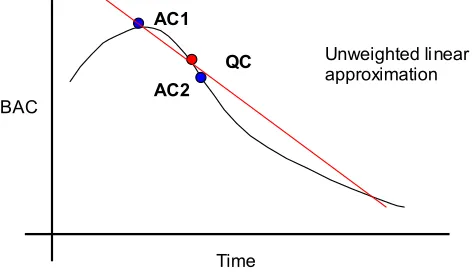
Once we’ve built up enough data around QC we are then left with the problem of how best to extract feature rankings from it. For regression tasks, multivariate linear regression models would seem to be the best candidate for deriving such information. A linear regression model provides us with a set of coefficients for each feature that can then be used to infer how sensitive the prediction is to changes in each feature’s value and so its relative importance. The coefficients also provide information about whether a feature is negatively or positively correlated with the prediction variable at that point. In our particular example the coefficient would give us the rate at which BAC is changing with time at that particular point. However, care must be taken to ensure the linear model derived truly reflects the NN’s function. If we were simply to build our model on the locally built case-base without attention to each case’s relation to query case we would end up with a model like that shown in Fig. 5.
Time BAC
QC Unweighted linear
approximation
AC1
AC2
Fig. 5. Fitting a linear model to the artificially created data.
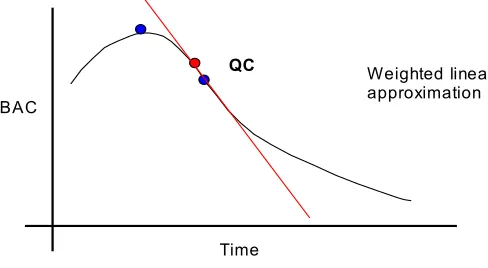
[image:6.595.172.408.487.627.2]similarity to the query case. For instance AC1 would be given a lower weight than AC2 and so would have less of an impact on the derived model. This gives us a model that is close to a tangent to the curve at QP and gives us a slope value that truly reflects the NN’s function as can be seen in Fig. 6.
Time BAC
QC Weighted linear
approximation
Fig. 6. Fitting a locally weighted linear model.
The above example is quite simple and the information extracted may not seem to be that useful, but in a multi-dimensional problem such information is extremely useful. In such a case, a hyperplane is produced and each coefficient of that model gives us a sense of how each feature relates to the predicted value.
3.2 The provision of Appropriate Cases
As has been stated before the strength of CBR explanations lies in the use of previous experience, of actual training cases. However it is important to provide the user with the appropriate cases that support the prediction. Once a set of feature rankings has been derived it is quite a simple task to adjust the selection of cases. A nearest neighbour algorithm is used to select cases from the original training data used to build the NN. Each feature is weighted based on the magnitude of the coefficient given to it and the nearest neighbour algorithm is then applied using these weights. This process helps eliminate the noise introduced by features that aren’t relevant to the particular case for which we are providing an explanation.
4. Sample Explanations
[image:7.595.170.414.216.350.2]Cunningham et al [6]. The data had to be adjusted slightly for use with a neural network and the explanation facility and the features shown in Table 1 were used.
Table 1. The features in the BAC dataset
Weight (Kg) Duration (Time Spent Drinking)
Meal (None, Snack, Lunch, Full) Amount (In Units)
Blood Alcohol Content
Meal was treated as an ordered integer feature with values ranging from 6 for Full to 0 for None. As an illustration of the type of explanations provided, we will focus on two cases, Case A and Case B as depicted in Table 2.
Table 2. Two sample cases from the BAC dataset.
Case A Case B
Weight 57 Duration 180 Meal 4 Amount 10.2
Weight 82 Duration 300 M
eal 2 Amount 15
For Case A the BAC value was 46 while the Network predicted 47 and for Case B the BAC value was 60 and the Network predicted 51.
For both cases the Neural Network was used as an oracle and artificial data sets were built around them. Local linear regression models were then built on those data sets and the following feature rankings were produced.
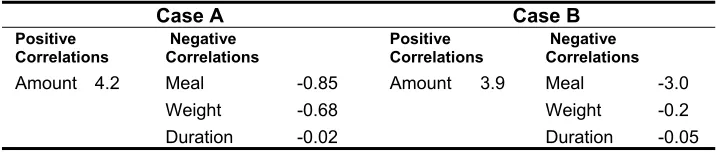
Table 3. How the features in the sample cases correlate with the outcome.
Case A Case B
Positive Correlations
Negative Correlations
Amount 4.2 Meal -0.85
Weight -0.68
Duration -0.02
Positive Correlations
Negative Correlations
Amount 3.9 Meal -3.0
Weight -0.2
Duration -0.05
If we concentrate first on the categories that the features have been put into, we can see that they would appear to match our intuition. Amount has a positive correlation with BAC which makes perfect sense – as the amount consumed increases we would expect BAC to also rise. The other features, Meal, Weight and Duration, were all given negative correlations and this too makes sense.
If we then focus on the actual score each feature was assigned, we can see that there is considerable variation between the two cases and this reflects the non-linear nature of the function learnt by the neural network. We see that Meal is a far more important factor in Case B than in Case A.
[image:8.595.118.479.448.524.2]query case in terms of the more important features are more useful for explanations. For instance if we focus on Case B, we can see in Table 4 the nearest neighbours selected with and without weighting.
Table 4. Nearest neighbours selected for Case B with and without weighting.
Without Weighting With Weighting
Weight 79 Duration 120 Meal 6 Amount 7.2 B
AC 21
Weight 53 Duration 330
Meal 4 Amount 10.4
B
AC 27
Although neither case is very close to the NN prediction, the case found with weighting is the better case for explanation since it is closer to B’s BAC value as well as being closer in value in terms of the critical features, units etc. Clearly both Duration and Meal have played roles in adding noise to the selection of case for presentation. Although Duration may generally not be a particularly useful feature Meal can be, as can be seen in the weighting its given in Case B. This further highlights the need for localised feature weighting when tackling non-linear problems. Further examples of the explanations produced can be seen below. In each case the feature values are followed by their rankings. The ranking consists of a number indicating the magnitude of importance of the feature and a sign indicating the correlation the feature has with the target value, BAC. For instance if Weight were given a negative correlation (-) this would mean that as the Weight feature value increases the BAC value should decrease. Immediately beside the query case is the explanation case as retrieved using our locally weighted retrieval mechanism.
Table 5. Further examples of explanation cases.
Query Case A Explanation Case
Weight 57 0.2(-) Duration 240 0.08(-)
Meal 6 1.8(-) Amount 12.6 3.4(+)
NN 48
Weight 76 Duration 240
Meal 6 Amount 12.4
B
AC 47
Query Case B Explanation Case
Weight 82 0.2(-) Duration 60 0.08(-)
Meal 6 1.8(-) Amount 2.9 3.4(+)
NN 0
Weight 69 Duration 270
Meal 6 Amount 13.2
B
AC 0
Query Case C Explanation Case
Weight 73 0.5(-) Duration 120 0.01(-)
Meal 6 0.06(-) Amount 9.0 4.8(+)
NN 30
Weight 72 Duration 120
Meal 4 Amount 9.6
B
AC 42
[image:9.595.117.481.465.632.2]
the retrieved case and as predicted by the NN as well as offering an insight into the nature of the problem being studied. The value of deriving feature rankings locally can also be seen in the interchange of emphasis put on the Weight and Meal features in the sample cases.
5. Conclusion
Providing useful explanations for black-box systems is an important issue and one for which we feel CBR is ideally suited. We have highlighted the important issues involved in the application of CBR explanations to black boxes as well as outlining possible solutions to these problems. In particular we focused on an implementation of a CBR explanation system for regression tasks. We found the explanations produced through this system to be straightforward, useful, and convincing, avoiding many of the pitfalls that can plague other approaches. This has encouraged us to further investigate the use of CBR for explanations of black box systems.
In the future we would like to expand our methods to classification problems using logistic regression as a local model from which to derive feature salience information. We would also like to focus on improved methods of case retrieval and of generating local artificial data.
References
1. R. Andrews, J. Diederich, A.B. Tickle, A survey and critique of techniques for extracting rules from trained artificial neural networks. Knowledge Based Systems 8: 373-389, (1995).
2. A. Tickle, R. Andrews, M. Golea, and J. Diederich. The truth will come to light: Directions and challenges in extracting rules from trained neural networks. IEEE Transactions on Neural Networks, 9:1057--1068, (1998).
3. Z.-H. Zhou and Y. Jiang. Medical Diagnosis with C4.5 preceded by artificial neural network ensemble. IEEE Transactions on Information Technology in Biomedicine, 7(1): 37-42, (2003).
4. Domingos P. Knowledge Discovery Via Multiple Models, Intelligent Data Analysis (1-4): 187-202 (1998).
5. Leake, D., B., CBR in Context: the Present and Future, in Leake D. B. (ed) Case-Based Reasoning, in Leake, D. B. (ed) Case-Based Reasoning: Experiences, Lessons and Future Directions, pp349-370, MIT Press, (1996).
6. Cunningham, P. Doyle, D., Loughrey, J.: An Evaluation of the Usefulness of Case-Based Explanation. In: Askey, K.D., Bridge, D.G. (eds.) Case-Based Reasoning Research and Development. LNAI, Vol. 689. Springer-Verlag, Berlin Heidelberg New York (2003). 7. McSherry, D., Explanation in Case-based Reasoning: an Evidential Approach, in
Proceedings 8th UK Workshop on Case-Based Reasoning (2003).
8. Doyle, D., Cunningham, P., Bridge, D., Rahman, Y., Explanation Oriented Retrieval, ECCBR 2004, Madrid, (2004).