A SMALL-SCALE SCREENING TEST FOR HE PERFORMANCE:
APPLICATION TO THE NEW EXPLOSIVE LLM-105
*J. L Cutting, H. H. Chau, R. L. Hodgin, D. M. Hoffman, F. Garcia, R. S. Lee, Estella McGuire, A. R. Mitchell, P. F. Pagoria, R. D. Schmidt, R. L. Simpson, P. C. Souers and R.W. Swansiger
Lawrence Livermore NationalLaboratory Livermore, CA 94550
It is expensive and time-consuming to scale up the processing of a new explosive molecule or formulation to produce a sufficient quantity of material to characterize the detonation performance. The calculated performance does not always correspond with measured performance, so there is also a concern that the time and resources expended in firing performance tests on a new material may not be justified by the outcome. We have developed a small-scale test that permits a preliminary characterization of the performance of a new explosive using only a few grams of material. We have performed the test on several explosives in common use. These includeLX-10(95% HMX/5% Viton A binder),LX-16(96% PETN/4% FPC 461 binder) andLX-17(92.5% TATB/7.5% Kel-F 800 binder). The test results agree well with with calculations which use equations of state that have been measured in cylinder tests1. We can also directly compare a new material with the test results on these well-known explosives. We have used the new test to characterize an explosive that we have recently synthesized, 2,6-diamino-3,5-dinitropyrazine-1-oxide(LLM-105),an insensitive energetic materialwith 25% greater power than TATB. The energy content and thermalstability of this materialmake it very interesting for several applications, including insensitive boosters and detonators. In this paper we will describe the evaluation of LLM-105 with only 30 grams of material.
SCREENING TEST
A schematic of the test fixture is shown in Fig. 1. The test pellet is initiated by an initiation train consisting of an exploding foil initiator (EFI), which initiates a 6.35-mm-diameter, 2-mm-thick LX-16 pellet pressed to a density of 1.7 g/cm3. The detonation of the LX-16 drives a 5.0-mm-diameter, 0.127-mm-thick aluminum flyer plate across a 1-mm gap to impact a 6.3diameter, 5-mm-thick test pellet. This initiation train provides a sufficient stimulus to promptly initiate ultrafine TATB at a density
*Work performed under the auspices of the U.S. Department of Energy by the Lawrence Livermore NationalLaboratory under Contract W-7405-Eng-48.
of 1.8 g/cm3. For explosives less sensitive than ultrafine TATB we add a booster pellet of LX-10 or LX-14.
FIGURE 1. CROSS-SECTIONAL SCHEMATIC OF TEST FIXTURE.
that the test pellet protrudes∼25µm above the surface of the disc.
A piece of 13-µm-thick aluminum foil is cut to shape and flattened on a piece of glass with a steel roller. A tiny drop of mineraloilis placed on a LiF crystaland the Alfoilis placed on the crystaland flattened by pressing it between a glass cover slip and the crystal. The cover slip is removed and the LiF crystal is placed in the next containment disc and pressed against the slightly-protruding test pellet with the foil against the pellet. The LiF crystal is held tightly against the test pellet by an O-ring, which is compressed by a finaldisc which protects the top end plate.
The motion of the 13-µm-thick aluminum foil, which forms the interface between the aluminum foil and the LiF crystal is measured by a Fabry-Perot laser veloci-meter2, which can be used to measure velocity to within about 1%. In this instrument, a laser beam is focused onto the 13-µm-thick aluminum. The Doppler shift of the reflected light is analyzed by a Fabry-Perot etalon and recorded with a streak camera. The pressure wave transmitted into the LiF may be determined from the foil velocity and the Hugoniot of the LiF. The laser velocimeter was also used to measure the velocity-time history of the 0.051-mm-thick Kapton flyer from the EFI and the 0.127-mm aluminum flyer accelerated by the detonating LX-16 pellet. The time response of the velocimeter is estimated to be about 10 ns.
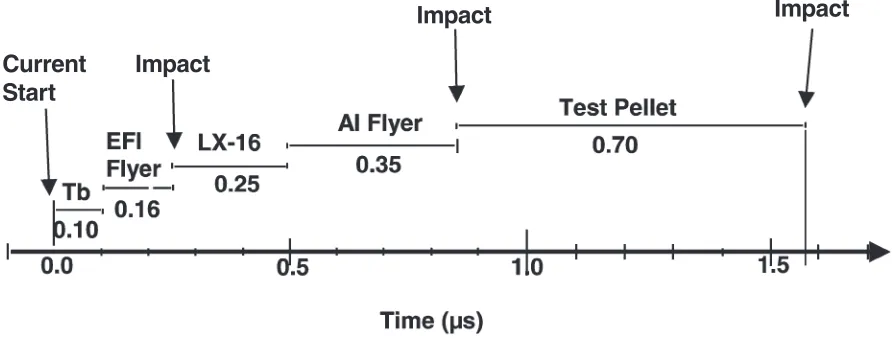
Figure 2 shows the timing schematic for the experi-ment. Times of events are referenced to tb, the current
start in the EFI. A common fiducialsignalallows us to relate electrical records to the film records from the laser velocimeter. Zero time is taken to be the start of current in the EFI. The laser velocimeter records the velocity-time history of the flyer from the EFI and the velocity with which it strikes the test pellet. The flight of the aluminum flyer accelerated by the LX-16 pellet is recorded in a subsequent experiment. The time at which the flyer strikes the test pellet is determined by the jump in interface velocity when the flyer is allowed to strike an aluminized glass surface at the position of the impact surface of the pellet. Detonation breakout time from the test pellet is the time at which the 13-µm-thick aluminum foilstarts to move.
FIGURE 2. TIMING SCHEMATIC FOR THE EXPERIMENTS.
DISCUSSION OF EXPERIMENTAL RESULTS FOR STANDARD EXPLOSIVE SAMPLES
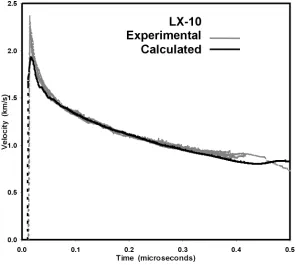
Experimental results for the explosive LX-10 are shown in Fig. 3. The experimentalinterface velocity data, shown as gray lines, are from six different shots and the scatter in the curves shows the reproducibility of the measurement. The solid black line is a calculation using the CALE hydrocode3 and a JWL equation of state1, determined from cylinder tests. The agreement is good except near the peak at the shock arrival. The fact that the measured peak velocity is larger than the calculated peak velocity may be due to the Von Neumann spike, which has not been completely attenuated in its passage through the 0.13-mm Al foil. There is also more scatter in the experimentaldata near the shock jump, due to difficulties which will be discussed below.
Figure 4 shows an experimentalstreak record of fringes from the laser velocimeter record as the deto-nation wave collides with the interface. The interface velocity is determined from the spacing between the fringes, and at the shock jump, the error is greater than the 1% error we estimate for the bulk of the record. This is because the fringe spacing is decreasing rapidly after the shock jump which, coupled with the finite width of the fringes, makes the peak value very difficult to read. This difficulty can be overcome by streaking faster, so the slope of the fringes is reduced.
Figure 5 shows the six experimentalrecords from Fig. 3 separated in time. The first two records were recorded at a 2µs sweep rate and the last four at 1µs. There is a consistent trend for the faster sweeps to give higher peaks. At the time of the experiments we were
limited to a 1 µs sweep because we did not have a comb generator that would generate time marks faster than every 100 ns. This meant that at sweeps faster than 1µs, we could not generate an accurate time fiducial to give us cross timing with the digitizer records of the electrical signals. In future work we will use a faster comb generator and, for some experiments, plan to use a much thinner aluminum reflector in conjunction with a sub-ns-time-resolution VISAR velocimeter.
LX-16 has a very small reaction zone and one would expect it to behave even more ideally than LX-10. Fig-ure 6 compares experimentaldata from three shots with a CALE calculation. Here, the calculation actually over-predicts the peak, but gives good agreement at later times. One of the experimental curves is clearly defective near the peak and this is probably due to an assembly problem that resulted in a small gap or a bubble in the assembly.
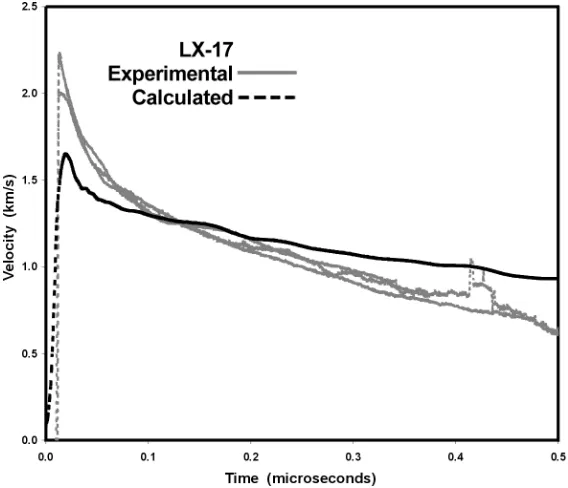
Finally, in Fig. 7, we show a comparison of calcu-lation with experimental data for LX-17, a very non-ideal explosive that is known to have a large reaction zone. The LX-17 could not be initiated directly by the aluminum flyer, so an additional booster of LX-10 was used. The simulation of this experiment included the LX-10 booster. The experimentalcurves lie above the calculated curve for more than 0.1µs, consistent with the existence of a large reaction zone. The generally-poor agreement between experiment and calculation at later times may indicate that the detonation in the LX-17 has not yet reached steady state, indeed, the diameter of the pellet may be below the critical diameter for LX-17.
gives a good representation of the performance of an explosive in the high-pressure region near the C-J state but not too close to the detonation front. Near the detona-tion front, the simuladetona-tion usually gives a lower interface velocity than is measured, probably a result of the Von
[image:4.612.171.468.140.405.2]Neumann spike, which is not accounted for in the simula-tions. There is also more experimental uncertainty in the measurement of the shock jump, but this can be alleviated by a faster sweep rate on the camera which records the velocimeter data.
FIGURE 3. VELOCITY-TIME RECORDS FOR 6 DIFFERENT SHOTS WITH LX-10 EXPLOSIVE, COMPARED WITH A SIMULATION USING THE CALE HYDROCODE3.
Agreement between experiment and simulation for the non-idealexplosive, 17, was much poorer. LX-17 has a very large reaction zone, which would lead to a wide Von Neumann spike and an under-prediction by the simulation near the detonation front. Also, if the LX-17 detonation has not reached steady state, one would not expect agreement with the simulation at later times.
EXPERIMENTAL TESTING OF LLM-1054
We have synthesized 2,6-diamino-3,5-dinitropyra-zine-1-oxide (LLM-105), as an insensitive target mole-cule. The predicted power5is 125% that of the extremely insensitive explosive TATB. The energy content, power and thermalstability of LLM-105 make it very promising for several applications, including insensitive boosters and detonators. As an initialscreening we produced
≈ 30 grams of LLM-105 for characterization by the new performance test and small-scale thermal explosion
experiments. LLM-105 has a density of 1.913 g/cc. In differentialscanning calorimetry the primary exotherm occurs at 342°C at a sweep rate of 10°C/min (vs.≈320°C for HNS and≈355°C for TATB). Drop impact height is
≈120 cm versus 30–32 cm for RDX and HMX. LLM-105 parts with adequate mechanicalintegrity could not be made by pressing neat material and, there-fore, was formulated with 5 wt% Viton A. The crystal morphology of LLM-105 was needle-like in these ex-periments. This morphology contributed to difficulties in obtaining high pressing densities, only 92.4% of the theoreticalmaximum density was obtained.
SMALL-SCALE PERFORMANCE TEST
Figure 8 shows the interface velocity record compared with a CALE hydrocode simulation for LLM-105 (neat) pressed to a density of 1.72 g/cm3. The equation of state used for the simulation was determined using the CHEETAH chemicalequilibrium code5, and the agree-ment is quite reasonable, indicating that expectations had been met.
ONE-DIMENSIONAL, TIME-TO-EXPLOSION TESTING OF LLM-105
[image:5.612.327.509.124.281.2]As part of the small-scale testing protocol the ther-malresponse of LLM-105 was evaluated in the one-dimensional, time-to-explosion test (ODTX)6. In this ex-periment 12.7 mm spheres are rapidly inserted between two aluminum anvils, preheated to a fixed temperature. The time-to-explosion response is determined quantita-tively and the violence of reaction qualitaquantita-tively.
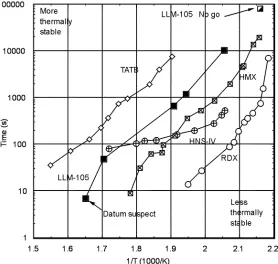
Figure 9 shows the ODTX results obtained with the LLM-105 formulation and other common materials. TATB is extremely insensitive to thermal explosions. It can be seen that LLM-105 has a time-to-explosion which is between HMX and TATB and better that HNS-IV. Unlike HMX all reactions with LLM-105 were very mild, i.e., TATB like. Due to limited material a precise determination of the criticaltemperature of LLM-105 could not be made. No explosive response was observed
[image:5.612.151.454.387.634.2]with 105 at the criticaltemperature of HMX. LLM-05 may have has a criticaltemperature as much as 15°C higher than HMX.
FIGURE 4. STREAK RECORDOF VELOCIMETER FRINGES. INTERFACE VELOCITY IS DETERMINED FROM THE SPACING BETWEEN THE FRINGES. IT IS MORE DIFFICULT TO DETERMINE THE FRINGE SPACING AT THE SHOCK JUMP THAN FOR THE REST OF THE RECORD.
FIGURE 6. THREE EXPERIMENTAL VELOCITY-TIME RECORDS FOR LX-16 EXPLOSIVE COMPARED WITH A SIMULATION USING THE CALE HYDROCODE3.
FIGURE 7. THREE EXPERIMENTAL VELOCITY-TIME RECORDS FOR LX-17 EXPLOSIVE COMPARED WITH A SIMULATION USING THE CALE HYDROCODE3.
SUMMARY
We have developed a small-scale test that permits preliminary characterization of the performance of a new explosive using only a few grams of material. We have performed the test on severalexplosives in common use.
These includeLX-10(95% HMX/5% Viton A binder),
LX-16 (96% PETN/4% FPC 461 binder) and LX-17
[image:6.612.176.460.312.556.2]FIGURE 8. EXPERIMENTAL VELOCITY-TIME RECORDFOR LLM-105 EXPLOSIVE COMPARED WITH A SIMULATION USING THE CALE HYDROCODE3.
[image:7.612.165.443.380.644.2]in cylinder tests and to directly compare LLM-105 with the other explosives using the same test.
We have synthesized the interesting, new insensitive energetic material, 105. With only 30 g of LLM-105 we were able to characterize the material adequately to evaluate it for future applications. We have used the new, small-scale test to confirm that LLM-105 has 25% more energy than TATB. In the ODTX configuration LLM-105 was found to be very thermalstable and pro-duces mild, low-order explosions. These experiments indicate LLM-105 may have uses in initiation systems and as a main charge material. Further scale-up appears to be warranted.
REFERENCES
1. J. W. Kury, H. C. Hornig, E. L. Lee, J. L. McDonnel, D. L. Ornellas, M. Finger, F. M. Strange, and M. L. Wilkins,Metal acceleration by chemical explosives,in
Proc. 4thSymp. (Int.) on Detonation,NavalOrdnance
Laboratory, ACR-126. pp. 3–13 (1965).
2. D. R. Goosman,Measuring velocities by laser Dop-pler interferometry,Lawrence Livermore NationalLab-oratory Rept. UCRL-52000-79-3, pp. 17–24 (1979).
3. Robert Tipton,Modeling flux compression generators with a 2D ALE code, Lawrence Livermore National Laboratory Rept. UCRL-99900 (1988).
4. P. F. Pagoria, Synthesis and characterization of 2, 6-diamino-3,5-dinitropyrozine-1-oxide,Propellents, Ex-plosives and Pyrotechics, submitted for publication.
5. L. Fried,Improved detonation modeling with CHEE-TAH, Lawrence Livermore NationalLaboratory Rept. UCRL-52000-97-11, pp. 21–23 (1997).
6. E. Catalano, R. McGuire, E. Lee, E. Wrenn, D. Or-nellas and J. Walton, The thermal decomposition and reaction of confined explosives,inProc. 6thSymp. (Int.)
on Detonation,NavalOrdnance Laboratory, ACR-221, pp. 214–222 (1976).
DISCUSSION
Divyakant Patel
U. S. Army, CECOM-NVESD, Countermine
Fort Belvoir, VA 22060
What are the solvents which dissolve the new explo-sive LLM-105?
REPLY BY JACK L. CUTTING, RONALDS. LEE ANDRANDALL L. SIMPSON
LLM-105 is generally not soluable in most solvents, however, DMSO will dissolve LLM-105. Extreme care should be taken as DMSO spray is ignitable.
DISCUSSION
Per-Anders Persson New Mexico Tech Socorro, NM 87801
What was the measured detonation velocity of LLM-105 from these tests?
REPLY BY JACK L. CUTTING, RONALDS. LEE ANDRANDALL L. SIMPSON