
Benchmarking Education and Training
for Economic Development in Ireland
To the Tánaiste, and Minister
for Enterprise, Trade and Employment
and the Minister for Education and
Science
B
e
n
ch
m
a
rk
in
g
E
d
u
ca
ti
o
n
a
n
d
Tr
a
in
in
g
fo
r
E
co
n
om
ic
De velo pm
Contents
Section 1 Introduction 1
1.1 Objectives 1
1.2 Report Structure 2
LONG-TERM INDICATORS
Section 2 Demographic Trends 3
2.1 National Population Growth 3
2.2 International Population Growth 4
2.3 Population Forecasts: Total 5
2.4 Population by Age Structure: Actual and Forecast 6
2.5 Summary and Key Issues 9
Section 3 Workforce Participation Rates 10
3.1 Irish Labour Force Participation Rates 10
3.2 International Comparison 12
3.3 Summary and Key Issues 13
Section 4 Literacy 14
4.1 Youth Literacy Rates 14
4.2 Summary and Key Issues 17
Section 5 Educational Profile of Workforce and Population 18
5.1 Educational Attainment in Ireland 18
5.2 International Comparison 19
5.3 Summary and Key Issues 24
SHORT-TERM INDICATORS
Section 6 Performance to School Leaving Certificate 25
6.1 International Comparison 25
6.2 National Data on Leaving Certificate Subjects 27
6.3 Summary and Key Issues 28
Section 7 Apprenticeship 29
7.1 National Data 29
7.2 International Comparison 31
7.3 Summary and Key Issues 32
Section 8 Further Education 33
8.1 National Data 33
B
e
n
ch
m
a
rk
in
g
E
d
u
ca
ti
o
n
a
n
d
Tr
a
in
in
g
fo
r
E
co
n
om
ic
De velo pm
en tin Ire lan d
Section 9 Higher Education 37
9.1 National Data 37
9.2 International Comparison 42
9.3 Summary and Key Issues 47
Section 10 Postgraduate Studies 48
10.1 National Data 48
10.2 International Comparison 49
10.3 Summary and Key Issues 50
Section 11 Adult Participation in Continued Education and Training 51
11.1 International Comparison 51
11.2 National Data on Part-Time Students 52
11.3 Summary and Key Issues 52
Section 12 Employee Training 53
12.1 International Comparison 53
12.2 Summary and Key Issues 56
Bibliography and Other Relevant Sources 57
Appendix 1: Benchmarking Subgroup Members 59
List of Tables and Figures
Table 2.1 Population Change by Components, 1991–2002 3
Table 2.2 Population Change by Region, 1996–2002 4
Table 2.3 Comparative Population Trends, 1996–2002 4
Figure 2.1 Rate of Population Growth, 1991–2001 5
Table 2.4 Population by Age Group, 1996 and 2002 6
Figure 2.2 Irish Population by Broad Age Group, 1991–2001 7
Table 2.5 Projected School Leavers (16-19 year olds), 2001-2011 7
Table 2.6 Regional Proportion of School Leavers (16-19 year olds), 2000–2010 8
Figure 2.3 Proportion of Population Aged 0-14, 2000 8
Figure 2.4 Proportion of Population Aged 0-14, 2000-2020 9
Table 3.1 Irish Labour Force, Quarter 4 2002 10
Figure 3.1 Participation Rate by Age Group and Gender, Quarter 4 2002 11
Figure 3.2 Participation Rate by NUTS3 Region, Quarter 4 2000 - Quarter 4 2002 11
Table 3.2 Labour Force Participation Rates by Age and Gender, 2001 12
Table 4.1 Literacy Levels of 15 Year Olds by OECD Country, 2000 15
Figure 4.1 15 Year Olds at Level 1 or Below on the PISA Reading
Literacy Scale (% of Total) by Country, 2000 16
Table 4.2 Literacy Levels of 15 Year Olds by OECD Country, 2000 17
Table 5.1 Distribution of Population Aged 15 and Over by Educational
Attainment and NUTS3 Region, Quarter 2 2001 – Quarter 2 2002 18
Table 5.2 Percentage of Population with Upper Secondary Education or Higher, 2001 19
Figure 5.1 Distribution of the Adult Population (25-64 year olds) by Highest
Level of Educational Attainment, 2001 20
Table 5.3 Percentage of Population with at Least Tertiary Type B Education, 2001 21
Table 5.4 Percentage of Population with at Least Tertiary Type A Education, 2001 22
Table 5.5 Educational Attainment of the Population by Gender, 2001 23
Figure 6.1 Upper Secondary Graduation Rates, 2000 25
Figure 6.2 Upper Graduation Rates by Gender, 2000 26
Figure 6.3 Proportion of 18-24 Age Cohort Having Achieved Lower Secondary
Level Education or Less and not Attending Education or Training, 1997 and 2002 26 Figure 6.4 Proportion of Gender Cohort Taking Leaving Certificate Subjects, 2000/2001 27
Figure 7.1 Apprentice Registrations, 1980–2002 29
Table 7.1 Distribution of Apprenticeships by Trade, 2001–2002 30
Table 7.2 Comparison of Apprenticeship in Six Countries, 1997 31
Table 8.1 Summary of Awards made by FETAC, June 2001 – June 2002 34
Figure 8.1 Total NCVA Certificates at Level 2 Awarded, 1994–2002 35
Table 8.2 NCVA Level 2 Certificates by Broad Discipline, 2002 35
B
e
n
ch
m
a
rk
in
g
E
d
u
ca
ti
o
n
a
n
d
Tr
a
in
in
g
fo
r
E
co
n
om
ic
De velo pm
en tin Ire lan d
Table 9.1 Number of Students in Full-Time and Part-Time Third Level Education
by Type of Institution, 1995–2001 37
Table 9.2 Number of Entrants to Full-Time Third Level Courses in Institutions
Aided by the Department of Education and Science, 1996–2001 38 Figure 9.1 Comparison of Irish Births (1974-1983) with Total Number of Higher
Education Entrants (1995-2000) 38
Table 9.3 Number of Students Enrolled in Full-Time Third Level Courses
by Age and Type of Institution, 2001 39
Table 9.4 New Entrants to Higher Education by College Type and Age, 1980–1998 39
Table 9.5 New Entrants to Higher Education by Gender and College Type, 2000 40
Table 9.6 Enrolment by Field of Study, 1980–1998 (Universities Only) 41
Table 9.7 Average Number of Subjects Taken at Leaving Certificate Level by
Subject Grouping, Gender and Third-Level Field of Study, 1998 42
Figure 9.2 Tertiary Type B Graduation Rates, 2000 43
Figure 9.3 Tertiary Type A Graduation Rates, 2000 43
Figure 9.4 Completion Rates in Tertiary Type B Education, 2000 44
Figure 9.5 Completion Rates in Tertiary Type A Education, 2000 44
Table 9.8 Comparison of Discipline Mix of Irish Graduates with OECD Average, 2000 45
Table 9.9 Share of Graduates in Science and Technology Per 1,000
Inhabitants Aged 20-29, 2000 46
Table 9.10 Percentage of Tertiary Qualifications Awarded to Women by Type
of Tertiary Education and by Subject Category, 2000 46
Figure 10.1 Postgraduate Awards as a Proportion of Total Awards, 1994–2000 48
Table 10.1 Postgraduate Awards as a Proportion of Total Awards (Universities and IOTs)
by Field of Study, 2000 49
Figure 10.2 Graduation Rates from Advanced Research Programmes, 2000 50
Figure 11.1 Adult Participation Rate in Continued Education and Training During
One Year by Type of Training, 2001 51
Table 11.1 Number of Students in Part-Time Third Level Education by
Type of Institution, 1995–2001 52
Table 12.1 Company Provision of Training, 1999 54
Table 12.2 Training as a Proportion of Company Labour Costs, 1999 55
Table 12.3 Percentage of Employees on Training Courses by Gender, 1999 56
Figure A2.1 Percentage of Adults in Literacy Level 1 (Lowest) on the
International Adult Literacy Survey, 1994 60
Section 1
Introduction
1.1 Objectives
Given today’s knowledge-based economy, the availability of a highly skilled workforce is essential for countries both, to remain competitive and, to achieve and maintain a position as a global leader. It is therefore increasingly necessary for countries to understand, in terms of education and training, how they are performing nationally, how they compare with competitor countries, and what targets they should be set to ensure their success.
At a European level, the European Commission has acknowledged this need and has recently adopted European Benchmarks for education and training across five broad categories: Early School Leavers; Graduates in Mathematics, Science and Technology; Population having completed Upper Secondary1 Education; Key Competencies; and Lifelong Learning. The five adopted benchmarks are:
by 2010, an EU average rate of no more than 10% early school leavers should be achieved;
the total number of graduates in mathematics, science and technology in the European Union should increase by at least 15% by 2010 while at the same time the level of gender imbalance should decrease;
by 2010, at least 85% of 22 year olds in the European Union should have completed upper secondary education;
by 2010, the percentage of low-achieving 15 year olds in reading literacy in the European Union should have decreased by at least 20% compared to the year 2000;
by 2010, the European Union average level of participation in Lifelong Learning, should be at least 12.5% of the adult working age population (25-64 age group)2.
Nationally, the Expert Group on Future Skills Needs has recognised the need for the establishment of a systematic process of benchmarking education and training in Ireland against other developed countries. The work of the Group requires to take a national overview of skills needs and provision, and needs to view sectoral needs in the context of that overview (and not in isolation of one another). It also needs to benchmark Ireland’s performance in relation to our competitors.
By benchmarking a range of agreed indicators relating to education and training, this report aims to provide the context for the Expert Group to make recommendations in certain areas and set realistic comparative targets where feasible. It is hoped to produce the report on an annual basis although this will be contingent on available and reliable data. This will allow developments which impact on education and training to be assessed, progress to be monitored and targets to be reviewed. This process is important given the impact the National Framework of Qualifications (NQAI)3 will have once
implemented.
1
1 The term “secondary” is used in the OECD and throughout this document to refer to all second-level education i.e. Voluntary Secondary, Vocational, and Community and Comprehensive schooling.
2 Source: European Commission, (2002b); European Commission, Press Release, 5th May 2003.
B
e
n
ch
m
a
rk
in
g
E
d
u
ca
ti
o
n
a
n
d
Tr
a
in
in
g
fo
r
E
co
n
om
ic
De velo pm
en tin Ire lan d
It should be noted that this report deals with the labour market dimension of educational policy. Consideration is given throughout to the objective set out in the National Spatial Strategy4of achieving more balanced regional development.
This report brings together the most up-to-date data from existing comparative sources of education, training and labour market information. A range of data sources is utilised. The main sources for domestic statistics used include the CSO, HEA, DES and FÁS. International data is sourced primarily from the OECD and Eurostat. While some data used are somewhat outdated, it is hoped that more recent data will be available for future reports. While every effort has been made to compare like data with like, it is important to exercise a degree of caution bearing in mind that data may vary between countries due to methods of assessment used and differences in education and training systems i.e. structural, cultural, and organisational.
1.2 Report Structure
11 key indicators, agreed by the Benchmarking Subgroup5, were selected for examination. These can be divided into four long-term and seven short-term indicators, with the former assessing the “stock” and the latter the “flow” of educated and skilled labour force in Ireland. These indicators will be reviewed on an annual basis and additional indicators included where deemed useful.
The report is structured as follows.
Section 2 to Section 5 present long-term indicators. Both national and international data on demographic trends, labour force participation rates, literacy, and educational profile of the population are presented.
Section 6 to Section 12 analyse short-term indicators relating to performance to school leaving certificate, apprenticeships, further education, higher education, postgraduate education, adult participation and company training.
2
4 Department of the Environment and local Government, 2002, The National Spatial Strategy: People, Places and Potential.
Section 2
Demographic Trends
Given that it can be argued a country’s people are its most important asset and form the cornerstone on which economic development and prosperity are built, it is crucial to assess the future supply of people and to assess the changing demographic characteristics of the population given their impact on the labour market.
2.1 National Population Growth
Over the past three decades, Irish population levels have been increasing steadily. The latest 2002 population data from the CSO estimates Ireland’s current population at 3.9 million, almost 30% of which is based in the Dublin region.
Since 1996, Ireland’s population has grown by 8%. As Table 2.1 indicates, net migration is now a main component of demographic growth. Between 1991 and 1996, 8% of population growth was attributed to net migration. Over the period 1996 to 2002, net migration accounted for over half the population increase. The success of the Irish economy throughout the 1990s may explain the increase in
immigration. This, coupled with strong natural population growth, has resulted in significant population expansion.
TABLE 2.1: POPULATION CHANGE BY COMPONENTS, 1991-2002
YEAR TOTAL NATURAL NET TOTAL
POPULATION CHANGE MIGRATION CHANGE
(000)
1991 3525.7 - -
-1996 3626.1 92.1 8.3 100.4
2002 3917.3 138.2 153.1 291.2
Source: CSO (2002), Census 2002 Preliminary Report
Assessing population change by region shows that all 8 NUTS36regions experienced an increase in population between 1996 and 2002 (see Table 2.2). The largest growth was in the Mid-East region (19%) and smallest increase in the Dublin region (6%). In 2002, almost 30% of the population were located in Dublin. The Midlands region accounted for just 6% with the remaining 6 regions accounting for between 9% and 15%.
3
6 The NUTS (Nomenclature of Territorial Units) classifications are used by Eurostat to classify regions. The 8 NUTS3 regions in Ireland are Border, Dublin, Mid-East, Midlands, Mid-West, South-East, South-West, and West.
B
e
n
ch
m
a
rk
in
g
E
d
u
ca
ti
o
n
a
n
d
Tr
a
in
in
g
fo
r
E
co
n
om
ic
De velo pm
en tin Ire lan d
TABLE 2.2: POPULATION CHANGE BY REGION, 1996-2002
REGIONAL AUTHORITY POPULATION POPULATION INCREASE IN POPULATION
AREA 1996 2002 ACTUAL % CHANGE
Border 407,295 432,366 25,071 6.2%
Dublin 1,058,264 1,122,600 64,336 6%
Mid-East 347,407 412,650 65,243 18.8%
Midland 205,542 225,588 20,046 9.8%
Mid-West 317,069 339,930 22,861 7.2%
South-East 391,517 423,540 32,023 8.2%
South-West 546,640 580,605 33,965 6.2%
West 352,353 380,057 27,704 7.9%
State 3,626,087 3,917,336 291,249 8.0%
Source: CSO (2002), Census 2002 Preliminary Report
2.2 International Population Growth
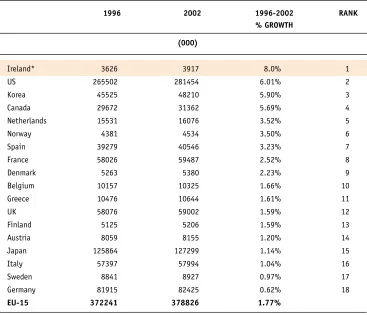
[image:10.595.145.512.443.758.2]Table 2.3 benchmarks Ireland’s population growth in recent years against that of other European countries, US, Canada, Korea, and Japan. Ireland ranks first out of 18 countries in terms of population growth over the period 1996-2002. Ireland’s population growth of 8% lies significantly above the EU average of 1.8%. Germany ranks last with population growth of 0.6% over this period.
TABLE 2.3: COMPARATIVE POPULATION TRENDS, 1996-2002
1996 2002 1996-2002 RANK
% GROWTH
(000)
Ireland* 3626 3917 8.0% 1
US 265502 281454 6.01% 2
Korea 45525 48210 5.90% 3
Canada 29672 31362 5.69% 4
Netherlands 15531 16076 3.52% 5
Norway 4381 4534 3.50% 6
Spain 39279 40546 3.23% 7
France 58026 59487 2.52% 8
Denmark 5263 5380 2.23% 9
Belgium 10157 10325 1.66% 10
Greece 10476 10644 1.61% 11
UK 58076 59002 1.59% 12
Finland 5125 5206 1.59% 13
Austria 8059 8155 1.20% 14
Japan 125864 127299 1.14% 15
Italy 57397 57994 1.04% 16
Sweden 8841 8927 0.97% 17
Germany 81915 82425 0.62% 18
EU-15 372241 378826 1.77%
Source: EC (2002a), AMECO Database.
*Irish data source: CSO (2002), Census 2002 Preliminary Report
Figure 2.1 analyses the trend in the rate of population growth between 1991 and 2001. Between 1993 and 1999, Irish population increased at a far greater rate than other countries including the EU average. However, growth trends between 1999 and 2001 show signs of a slowdown in the rate of increase in population growth in Ireland in line with the EU average.
FIGURE 2.1 RATE OF POPULATION GROWTH, 1991-2001
Source: EC (2002a), AMECO Database
2.3 Population Forecasts: Total
The question as to whether the recent population expansion will continue to expand into the future is complex. A variety of different projections exist. Eurostat’s baseline projections show a contraction in population by 2010 to 3.76 million, followed by an increase to 3.9 million by 2020. The uncertainty around these forecasts is borne out by Eurostat’s own complementary high and low estimates, with a predicted population range of between 3.63 million and 3.94 million in 2010, and of between 3.65 million and 4.25 million in 2020. The United Nations, meanwhile, projects the Irish population having grown to 4.02 million in 2010 and 4.3 million by 20207.
In contrast to both these views, the CSO projects that the Irish population will increase from 3.9 million in 2002 to 4.2 million by 2011 and to 4.4 million by 2021. Using the 1996 Census of Population as a benchmark, the CSO projects population using six scenarios corresponding to three fertility and two migration variants. The above projections are based on the M1F28scenario which is the most likely scenario according to current trends. Unlike the Eurostat and United Nations forecasts, which make similar assumptions across all countries included, the CSO projections are based on national trends and are deemed the most reliable projections.
According to CSO projections, 6 of the 8 NUTS3 regions will see their populations increase between 2002 and 2021.9 Over the period 2002 – 2021, only two NUTS3 regions, Dublin and Mid-East, are expected to increase their share of the national population (by 5.1% and 0.4% respectively). This is at variance with the Government’s National Spatial Strategy which aims towards balanced regional development and a more even pattern of population growth. It is hoped that by strengthening regional development, the present imbalance in regional population growth will level off as greater employment opportunities arise in other regions.
5
7 See Eurostat Yearbook 2002for population forecast comparisons for other countries.
8 The M1F2 (Migration 1 Fertility 2) scenario assumes a continuation of the net inward migration experienced over recent years, although at a declining rate, coupled with a decline in total fertility rate to 1.75% in 2011 and to remain constant thereafter.
9 Source: CSO, Regional Population Projections 2001-2031, June 2001
Germany Japan UK EU 15 France Netherlands
US
Ireland
1991-1993 1993-1995 1995-1997 1997-1999 1999-2001
2
1
B
e
n
ch
m
a
rk
in
g
E
d
u
ca
ti
o
n
a
n
d
Tr
a
in
in
g
fo
r
E
co
n
om
ic
De velo pm
en tin Ire lan d
2.4 Population by Age Structure: Actual and Forecast
Analysis of the age structure of the Irish population reveals that Ireland has a relatively young population base. Table 2.4 highlights that children, youths and young adults account for proportionately more of the population than older inhabitants. While Ireland, at present, has a very young population, this population is showing signs of ageing (see Figure 2.2). This trend is not exclusive to Ireland but is being experienced in many developed economies. Dramatically lower fertility levels and strong growth in life expectancy in the EU over the past number of decades has resulted in a decline of ca. 20% in the number of young people while working age and the elderly populations have continued to expand. Examination of the birth rate in Ireland, however, shows an increase in recent years. Compared with an average of 52,000 births annually between 1991 and 2000, there were almost 58,000 births in 2001 and 60,500 in 2002 (source: CSO).
Table 2.4 shows that, in Ireland, the proportion of the population aged less than 20 fell between 1996 and 2002 from 33% to 29%. In contrast the proportion of people aged between 40 and 60 increased over this period from 22% to 24%.
The school-leavers age group (15-19 years) showed a significant level of decline between 1996 and 2002, constituting 8.2% of population in 2002 relative to 9.4% in 1996. This could have implications for the future Irish labour force if the number of new entrants every year continues to fall while greater numbers retire from the work force.
Figure 2.2 shows that the over 65 age cohort as a proportion of total population has remained relatively constant since 1991. However, this is set to increase over the next two decades. While it is projected to increase moderately over the period 2001-2010 (11% to 12% respectively), by 2010, over 65 year olds will represent 15% of the population. This increase will largely be attributed to the first of the baby-boom generation reaching retirement age in 2011.
TABLE 2.4: POPULATION BY AGE GROUP, 1996 AND 2002
1996 2002
POPULATION BY PERCENTAGE OF POPULATION BY PERCENTAGE OF
AGE GROUP TOTAL POPULATION AGE GROUP TOTAL POPULATION
(000) % (000) %
0-9 years 533.3 14.71% 538.8 13.83%
10-19 years 665.6 18.36% 602 15.45%
School-leavers
15-19 years 339.5 9.4% 318.4 8.2%
20-29 years 552.4 15.23% 674 17.30%
30-39 years 516.6 14.25% 560.7 14.39%
40-49 years 465.8 12.85% 511.6 13.13%
50-59 years 340.4 9.39% 423.5 10.87%
60-69 years 264.7 7.30% 282.8 7.26%
70-79 years 196.6 5.42% 200.3 5.14%
80 years & over 90.5 2.50% 103.3 2.65%
Total 3,626 100.0% 3,897 100.0%
Source: CSO (2002), Population & Migration Estimates April 2002
FIGURE 2.2 IRISH POPULATION BY BROAD AGE GROUP, 1991-2001
Source: EC (2002a), AMECO Database
Examination of school leaver projections show that for every 100 school leavers in 2000, there will only be 79 in 2011 (see Table 2.5). The number of 16-19 year olds in each of the NUTS3 regions is projected to decline over the next decade.
TABLE 2.5 PROJECTED SCHOOL LEAVERS (16-19 YEAR OLDS), 2000-2011 (2000=100)
REGION 2000 2002 2005 2010 2011
Border 100 94 87 76 73
Dublin 100 94 89 87 86
Mid-East 100 95 89 85 84
Midlands 100 93 83 71 70
Mid-West 100 93 84 77 75
South-East 100 94 87 78 76
South-West 100 94 86 78 77
West 100 95 87 78 76
State 100 94 87 81 79
Source: CSO (1999), Population and Labour Force Projections, 2001-2031
Currently, school leavers as a proportion of population is highest in the Dublin region with 27% of its population constituting 16 to 19 year olds (see Table 2.6). By 2010, this proportion is estimated to increase to 30%. The Mid-East is the only other region where school leavers as a percentage of population is projected to increase.
7
61.8
11.4
1991 100%
80%
60%
40%
20%
10%
1992 1993 1994 1995 1996 1997 1998 1999 2000 2001
11.4 11.5 11.4 11.4 11.4 11.4 11.4 11.3 11.2 11.2
62.3 62.8
PE
RCE
N
TA
G
E
63.4 64.2 64.9 65.5 66.1 66.6 67.0 67.4
26.8 26.2 25.8 25.1 24.4 23.7 23.1 22.5 22.1 21.8 21.4
65
15-64
B e n ch m a rk in g E d u ca ti o n a n d Tr a in in g fo r E co n om ic De velo pm en tin Ire lan d
TABLE 2.6 REGIONAL PROPORTION OF SCHOOL LEAVERS (16-19 YEAR OLDS), 2000-2010
REGION 2000 2002 2005 2010
Border 11.6 11.6 11.6 10.9
Dublin 27.4 27.3 28.2 29.6
Mid-East 10.4 10.5 10.7 11.0
Midlands 5.8 5.8 5.5 5.1
Mid-West 8.9 8.9 8.6 8.5
South-East 10.9 10.8 10.8 10.6
South-West 14.8 14.8 14.5 14.4
West 10.1 10.2 10.1 9.8
State 100 100 100 100
Source: Mc Donagh & Patterson (2002)
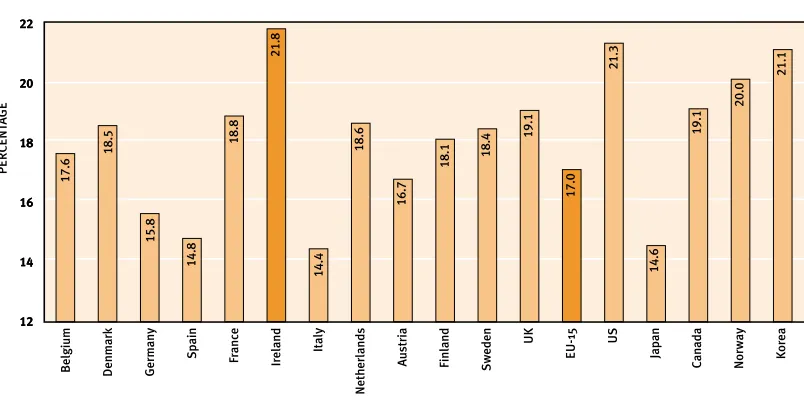
While Figure 2.2 shows that the below 15 age cohort in Ireland has fallen from 26.8% of the population in 1991 to 21.4% in 2001, international comparison still shows Ireland to be the youngest economy in the EU (see Figure 2.3).
FIGURE 2.3 PROPORTION OF POPULATION AGED 0-14, 2000
Source: EC (2002a), AMECO Database
While in most EU countries, the process of population ageing will accelerate over the period 2010-2020 due to the ageing of the large post-war “baby-boom” generations, Figure 2.4 shows that, of the EU-15, Ireland is forecast to remain the youngest Member State over the next two decades.
8
21.1 20.0 19.1 14.6 21.3 17.0 19.1 18.4 18.1 16.7 18.6 14.4 21.8 18.8 14.8 15.8 18.5Belgium Denmark Germany Sp
a
in
France Ireland Italy
Netherlands
Austria Finland Sw
eden UK EU-1
5
US
Japan
Canada Norway Ko
FIGURE 2.4 PROPORTION OF POPULATION AGED 0-14, 2000-2020
Source: Eurostat (2002), European Social Statistics: Demographic
2.5 Summary and Key Issues
Over the past six years, Ireland’s population has grown faster than any of the 18 countries benchmarked although the rate of growth has decreased slightly over the past two years.
The population is projected to increase over the next twenty years. It is expected to grow by 8% over the next decade and 6% between 2011 and 2021. Most of this growth will occur in the Dublin and Mid-East regions. This may have implications for regional imbalance.
While Ireland, at present, has a very young population, this population is showing signs of ageing with the school-leavers age group as a proportion of population having declined by 1.2% over the past six years and projected to continue decreasing over the next decade. In addition, while the percentage of over 65s has remained relatively constant over the past decade, this is set to increase by 4% over the next 20 years. These trends will have implications for the future Irish labour force if the number of new entrants every year continues to fall while greater numbers retire from the workforce. A key issue which requires attention is the management of higher education given the projected demographic decline.
Ireland currently has the youngest population in the EU and, despite trends towards an older population, is forecast to remain the youngest Member State of the EU-15 over the next two decades. This suggests that population ageing is not as serious an issue in Ireland for the medium-term.
9
12 14 16 18 20
2000 2005
2010
2020 22
Ir
eland
N
orway
UK
Lu
xembour
g
France
N
etherlands
S
w
eden
D
enmar
k
Finland Belgium EU-15 Austria Portugal
G
ermany Greece S pain Ital
y
PE
RCE
NT
AG
B
e
n
ch
m
a
rk
in
g
E
d
u
ca
ti
o
n
a
n
d
Tr
a
in
in
g
fo
r
E
co
n
om
ic
De velo pm
en tin Ire lan d
Section 3
Workforce Participation Rates
The Participation Rate measures the number of persons in the labour force as a percentage of the total population aged 15 or over. A high participation rate is a key contributor to the success of an economy since it provides access to a larger and wider pool of skills and intellectual capability.
3.1 Irish Labour Force Participation Rates
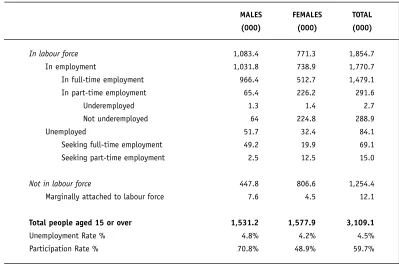
[image:16.595.125.524.311.576.2]According to the latest figures released by the CSO, there were 1.9 million people in the Irish labour force in the fourth quarter of 2002. 58% were male and 42% female. Table 3.1 shows the breakdown of the labour force by ILO economic status.
TABLE 3.1: IRISH LABOUR FORCE, Q4 2002
MALES FEMALES TOTAL
(000) (000) (000)
In labour force 1,083.4 771.3 1,854.7
In employment 1,031.8 738.9 1,770.7
In full-time employment 966.4 512.7 1,479.1
In part-time employment 65.4 226.2 291.6
Underemployed 1.3 1.4 2.7
Not underemployed 64 224.8 288.9
Unemployed 51.7 32.4 84.1
Seeking full-time employment 49.2 19.9 69.1
Seeking part-time employment 2.5 12.5 15.0
Not in labour force 447.8 806.6 1,254.4
Marginally attached to labour force 7.6 4.5 12.1
Total people aged 15 or over 1,531.2 1,577.9 3,109.1
Unemployment Rate % 4.8% 4.2% 4.5%
Participation Rate % 70.8% 48.9% 59.7%
Source: CSO (2003), National Quarterly Household Survey Fourth Quarter 2002
The workforce participation rate was 60% in the fourth quarter of 2002. The male participation rate was found to be higher (71%) than the female rate (49%). While the overall participation rate has remained relatively static over the last two years (59.2% in Q4 2000 and 59.7% in Q4 2001), as has the rate for males, the female rate has increased marginally over this period (47.9% in Q4 2000, 48.6% in Q4 2001, 48.9% in Q4 2002). However, in order to meet the EU participation target of 70% overall and 60% for females by 2010, as set out by the Lisbon European Council in 2000, Ireland will need to increase participation rates considerably. Factors such as the availability of suitable jobs and financial incentives need to be examined.
Participation Rates by Age
Figure 3.1 examines participation rates in Ireland according to age groups and gender. Across all age groups, a higher proportion of males participate in the labour force than females. Over 90% of males aged 25-44 participate in the labour force compared to approximately 70% of females in the same age cohort.
FIGURE 3.1 PARTICIPATION RATE BY AGE GROUP AND GENDER, Q4 2002
Source: CSO (2003), National Quarterly Household Survey Fourth Quarter 2002
Participation Rates by Region
Figure 3.2 compares regional participation rates in the fourth quarter of 2002. Only two regions, Mid-East and Dublin, were found to have rates above the national average of 60%. The Border region had the lowest participation rate of 56%. Participation rates increased across six of the eight regions in the two years leading to Q4 2002, while falling in both the Dublin and Mid-West regions. The variation in regional participation rates again has implications for the National Spatial Strategy’s objective of achieving more balanced regional development.
To illustrate the effects of low participation rates on Ireland’s labour supply, assume that every region achieved a participation rate equal to that of Dublin (63%). Based on this assumption, an estimated 98,000 extra people would be added to the Labour Force, an overall increase of 5%. This highlights the extent to which untapped manpower and skills exist in the regions and the need for participation rates to be increased.
FIGURE 3.2 PARTICIPATION RATE BY NUTS3 REGION, Q4 2000 – Q4 2002
Source: CSO (2003), National Quarterly Household Survey Fourth Quarter 2002
11
100
90
80
70
60
50
40
30
20
10
0
92
75 77
68
31
24
93
66 88
57 75
40 56
23
14
3
15-19 20-24 25-34 35-44 45-54 AGE GROUP
55-59 60-64 65+ Male
Female
PE
RCE
N
T
A
G
E
66
64
62
60
58
56
54
58.3
59.7
56.1
58.4
58.2
57.4
56.5
55.7
54.9
55.6
56.5
56.7
Mid-East Dublin West South-East Mid-West South-West Midlands Border Q4 2000
Q4 2002
63.8
62.6
63.4
62.8
National Participation Rate
PE
RCE
NT
AG
B
e
n
ch
m
a
rk
in
g
E
d
u
ca
ti
o
n
a
n
d
Tr
a
in
in
g
fo
r
E
co
n
om
ic
De velo pm
en tin Ire lan d
3.2 International Comparison
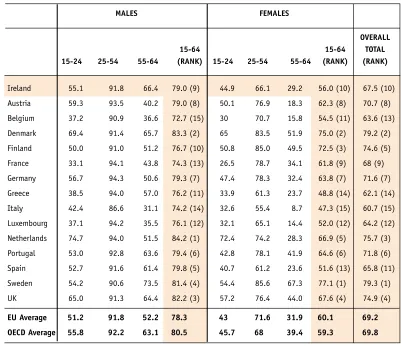
There are no directly comparable international figures with the CSO participation rates detailed above. However the OECD produces labour force participation rates for its member countries focusing on the 15-64 year old age group, as shown in Table 3.2.
[image:18.595.124.525.332.678.2]In 2001, the participation rate for the 15-64 age cohort in Ireland is estimated at 68%, slightly below the EU and OECD averages (70%) and significantly below the UK rate of 75%. When compared with participation rates over the past two decades, it shows a considerable increase with participation rates in 1981 estimated at 60.2% (59.9% in 1986, 60.2% in 1991, 62.6% in 1996). Despite this increase, Ireland ranks 10th out of the 15 countries benchmarked. The male participation rate is given as 79%, slightly ahead of the EU average but just below the OECD average. The labour force participation rate for older Irish males (66%) is above the EU and OECD averages. The female participation rate is estimated at 56%, slightly below the EU and OECD averages.
TABLE 3.2: LABOUR FORCE PARTICIPATION RATES BY AGE AND GENDER, 2001
MALES FEMALES
OVERALL
15-64 15-64 TOTAL
15-24 25-54 55-64 (RANK) 15-24 25-54 55-64 (RANK) (RANK)
Ireland 55.1 91.8 66.4 79.0 (9) 44.9 66.1 29.2 56.0 (10) 67.5 (10)
Austria 59.3 93.5 40.2 79.0 (8) 50.1 76.9 18.3 62.3 (8) 70.7 (8)
Belgium 37.2 90.9 36.6 72.7 (15) 30 70.7 15.8 54.5 (11) 63.6 (13)
Denmark 69.4 91.4 65.7 83.3 (2) 65 83.5 51.9 75.0 (2) 79.2 (2)
Finland 50.0 91.0 51.2 76.7 (10) 50.8 85.0 49.5 72.5 (3) 74.6 (5)
France 33.1 94.1 43.8 74.3 (13) 26.5 78.7 34.1 61.8 (9) 68 (9)
Germany 56.7 94.3 50.6 79.3 (7) 47.4 78.3 32.4 63.8 (7) 71.6 (7)
Greece 38.5 94.0 57.0 76.2 (11) 33.9 61.3 23.7 48.8 (14) 62.1 (14)
Italy 42.4 86.6 31.1 74.2 (14) 32.6 55.4 8.7 47.3 (15) 60.7 (15)
Luxembourg 37.1 94.2 35.5 76.1 (12) 32.1 65.1 14.4 52.0 (12) 64.2 (12)
Netherlands 74.7 94.0 51.5 84.2 (1) 72.4 74.2 28.3 66.9 (5) 75.7 (3)
Portugal 53.0 92.8 63.6 79.4 (6) 42.8 78.1 41.9 64.6 (6) 71.8 (6)
Spain 52.7 91.6 61.4 79.8 (5) 40.7 61.2 23.6 51.6 (13) 65.8 (11)
Sweden 54.2 90.6 73.5 81.4 (4) 54.4 85.6 67.3 77.1 (1) 79.3 (1)
UK 65.0 91.3 64.4 82.2 (3) 57.2 76.4 44.0 67.6 (4) 74.9 (4)
EU Average 51.2 91.8 52.2 78.3 43 71.6 31.9 60.1 69.2
OECD Average 55.8 92.2 63.1 80.5 45.7 68 39.4 59.3 69.8
Source: OECD (2002), Labour Force Statistics 1981-2001
3.3 Summary and Key Issues
Over the last two decades, participation rates in Ireland have increased considerably. In 2002, the participation rate was estimated by the CSO at 60%. Despite this increase, Ireland ranks 10th out of 15 countries benchmarked, and lies significantly below the EU 2010 target of 70%.
A considerably larger portion of males participate in the workforce than females. Of those aged 35-44, 93% of males participate compared to 66% of females. This is consistent across all age groups. Over the past two years, there has been a marginal increase in the female rate while the male participation rate has remained relatively static.
Regional comparison shows participation rates to be considerably higher in the Dublin and Mid-East regions which may be attributed to increased work-related opportunities in these regions. Further examination of this issue is required in light of possible implications for regional imbalance.
Policy should focus on increasing participation rates in Ireland not only to lower dependency rates but also to avail of the talents which non-participants have to offer.
The issue of stimulating female rates needs to be addressed. Currently the female participation rate is 50%, while the EU target for 2010 is 60%. Methods of attracting more women into the workforce across all age cohorts, particularly married women, should be explored. This might include for example the wider deployment of family-friendly work arrangements.
B
e
n
ch
m
a
rk
in
g
E
d
u
ca
ti
o
n
a
n
d
Tr
a
in
in
g
fo
r
E
co
n
om
ic
De velo pm
en tin Ire lan d
Section 4
Literacy
Literacy involves the integration of listening, speaking, reading, writing and numeracy. It is both a basic life skill and an essential work skill and is the foundation for future learning. Literacy not only benefits the individual but has long-term implications for the economy and as such is widely recognised as being fundamental to high economic and competitive performance. Given the speed at which economies are developing, people require to maintain and enhance their literacy skills in order to fully participate in society. It is therefore crucial that a high level of literacy competency be developed at school and maintained throughout life.
4.1 Youth Literacy Rates
10OECD’s Programme for International Student Assessment (PISA) initiative provides insight into Ireland’s performance in terms of reading, numeracy and scientific literacy with regard to other developed economies. PISA aims to assess the basic skills of fifteen year olds in participating countries across these three domains. The increasing role which science, mathematics and technology are playing in modern economies has resulted in numeracy and science literacy becoming key requirements for those
participating or wishing to participate in the labour force. By assessing youth literacy rates, Ireland can compare its competence in supplying tomorrow’s workforce with the core skills necessary to develop an efficient labour force.
This section presents data from the 2000 PISA, which primarily focused on reading literacy. In future PISA cycles, the focus will be on numeracy literacy (2003) and scientific literacy (2006).
Reading Literacy
11PISA examines reading literacy at five levels, each representing tasks of increasing complexity. Mean scores are used as an indicator of proficiency in reading of 15-year olds in each country. Table 4.1 compares the mean scores of 27 OECD countries. Ireland performs well ranking 5th with regard to reading literacy with the indexed mean average score some 5.4% above the OECD average.
14
10 Adult literacy rates are presented in Appendix 2. The latest estimates for adult literacy rates in Ireland refer to 1996. 11 Reading literacy is defined by PISA as “understanding, using and reflecting on written texts, in order to achieve one’s
TABLE 4.1: LITERACY LEVELS OF 15 YEAR OLDS BY OECD COUNTRY, 2000
READING LITERACY NUMERACY SCIENTIFIC LITERACY
MEAN SCORE & (RANK) MEAN SCORE & (RANK) MEAN SCORE & (RANK)
Finland 546 (1) 536 (4) 538 (3)
Canada 534 (2) 533 (6) 529 (5)
New Zealand 529 (3) 537 (3) 528 (6)
Australia 528 (4) 533 (5) 528 (7)
Ireland 527 (5) 503 (15) 513 (9)
Korea 525 (6) 547 (2) 552 (1)
United Kingdom 523 (7) 529 (8) 532 (4)
Japan 522 (8) 557 (1) 550 (2)
Sweden 516 (9) 510 (14) 512 (10)
Austria 507 (10) 515 (11) 519 (8)
Belgium 507 (11) 520 (9) 496 (17)
Iceland 507 (12) 514 (13) 496 (16)
Norway 505 (13) 499 (16) 500 (13)
France 505 (14) 517 (10) 500 (12)
United States 504 (15) 493 (18) 499 (14)
Denmark 497 (16) 514 (12) 481 (22)
Switzerland 494 (17) 529 (7) 496 (18)
Spain 493 (18) 476 (21) 491 (19)
Czech Republic 492 (19) 498 (17) 511 (11)
Italy 487 (20) 457 (23) 478 (23)
Germany 484 (21) 490 (19) 487 (20)
Hungary 480 (22) 488 (20) 496 (15)
Poland 479 (23) 470 (22) 483 (21)
Greece 474 (24) 447 (25) 461 (24)
Portugal 470 (25) 454 (24) 459 (25)
Luxembourg 441 (26) 446 (26) 443 (26)
Mexico 422 (27) 387 (27) 422 (27)
OECD Average 500 500 500
Source: www.pisa.oecd.org
Numeracy / Mathematical Literacy
12An assessment of numeracy literacy shows that while Ireland still performs above the OECD country average, its performance lies below its equivalent mean score for reading literacy. Ranked 15th Ireland is in the bottom half of the 27 countries with regard to numeracy.
Scientific Literacy
13Ireland performs well ranking 9th out of the 27 countries for scientific literacy. Although Ireland’s mean score of 513 lies above the OECD average, the top performers, Korea and Japan, both scored above 550, some 10% above the average.
Low Achievers
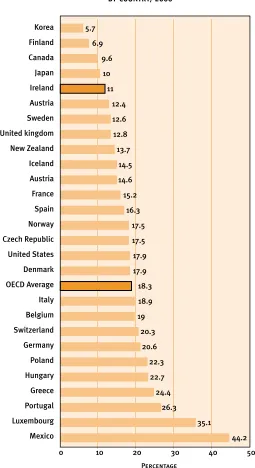
An examination of low achievers on the PISA reading literacy scale shows Ireland to perform strongly (see Figure 4.1). Based on the percentage of students in each country on or below Level 1 on the PISA reading literacy scale, Ireland ranks 5th out of 27 countries with 11% of 15 year olds assessed found to be at this level compared with an OECD average of 18%.
15
12 Numeracy/Mathematical literacy is defined by PISA as “an individual’s capacity to identify and understand the role that mathematics plays in the world, to make well-founded mathematical judgements and to engage in mathematics, in ways that meet the needs of that individual’s current and future life as a constructive, concerned and reflective citizen”. 13 Scientific literacy is defined by PISA as “the capacity to use scientific knowledge, to identify questions and draw evidence based
B e n ch m a rk in g E d u ca ti o n a n d Tr a in in g fo r E co n om ic De velo pm en tin Ire lan d
FIGURE 4.1: 15 YEAR OLDS AT LEVEL 1 OR BELOW ON THE PISA READING LITERACY SCALE (% OF TOTAL), BY COUNTRY, 2000
Source: PISA data. Cited in: European Commission (2002b)
By Gender
Table 4.2 presents the PISA results by gender. In all countries, girls outperformed boys in combined reading literacy. In Ireland, girls scored 29 points higher than boys. The opposite is found for numeracy literacy with males in all but two countries (Iceland and New Zealand) performing better than females. In Ireland, males scored 13 points more than females. Finally, scientific literacy scores varied between boys and girls by relatively few points with males outperforming females in 11 of the 27 countries. In Ireland, girls scored 6 points higher than males.
16
Percentage Korea Finland Canada Japan Ireland Austria Sweden United kingdom New Zealand Iceland Austria France Spain Norway Czech Republic United States Denmark OECD Average Italy Belgium Switzerland Germany Poland Hungary Greece Portugal Luxembourg Mexico 44.2 35.1TABLE 4.2: LITERACY LEVELS OF 15 YEAR OLDS BY OECD COUNTRY, 2000
READING LITERACY NUMERACY SCIENTIFIC LITERACY
SCORE SCORE SCORE
MALES FEMALES DIF. MALES FEMALES DIF. MALES FEMALES DIF.
Australia 513 546 -34 539 527 12 526 529 -3
Austria 495 520 -26 530 503 27 526 514 12
Belgium 492 525 -33 524 518 6 496 498 -2
Canada 519 551 -32 539 529 10 529 531 -2
Czech Republic 473 510 -37 504 492 12 512 511 1
Denmark 485 510 -25 522 507 15 488 476 12
Finland 520 571 -51 537 536 1 534 541 -6
France 490 519 -29 525 511 14 504 498 6
Germany 468 502 -35 498 483 15 489 487 3
Greece 456 493 -37 451 444 7 457 464 -7
Hungary 465 496 -32 492 485 7 496 497 -2
Iceland 488 528 -40 513 518 -5 495 499 -5
Ireland 513 542 -29 510 497 13 511 517 -6
Italy 469 507 -38 462 454 8 474 483 -9
Japan 507 537 -30 561 553 8 547 554 -7
Korea 519 533 -14 559 532 27 561 541 19
Luxembourg 429 456 -27 454 439 15 441 448 -7
Mexico 411 432 -20 393 382 11 423 419 4
New Zealand 507 553 -46 536 539 -3 523 535 -12
Norway 486 529 -43 506 495 11 499 505 -7
Poland 461 498 -36 472 468 5 486 480 6
Portugal 458 482 -25 464 446 19 456 462 -6
Spain 481 505 -24 487 469 18 492 491 1
Sweden 499 536 -37 514 507 7 512 513 0
Switzerland 480 510 -30 537 523 14 500 493 7
United Kingdom 512 537 -26 534 526 8 535 531 4
United States 490 518 -29 497 490 7 497 502 -5
OECD Average 485 517 -32 506 495 11 501 501 0
Source: OECD (2000),Knowledge and Skills for Life: First Results from the OECD Programme for International Student Assessment (PISA) 2000
4.2 Summary and Key Issues
For those aged 15, Ireland ranked 5th, 15th and 9th for reading, numeracy and science literacy respectively compared with 27 OECD countries. Since youth literacy rates broadly determine adult literacy rates, it is essential to maintain and enhance this high achievement in reading and science literacy and to improve Ireland’s ranking for numeracy literacy. In particular, attention needs to be directed towards improving the performance in numeracy literacy of girls. The issue of increasing reading literacy in boys should also be examined. The possibility of setting targets for literacy levels across these three categories needs to be explored, together with methods of early intervention in order to ensure the availability of high literacy skills in the future adult population and workforce.
While Ireland ranks strongly in terms of low achievers on the PISA reading literacy scale (5th out of 27 countries), there is a need for policy to examine methods of reducing the number of low achievers (11% of 15 year olds assessed in 2000) given the possible implications on the early school leaver rate.
B
e
n
ch
m
a
rk
in
g
E
d
u
ca
ti
o
n
a
n
d
Tr
a
in
in
g
fo
r
E
co
n
om
ic
De velo pm
en tin Ire lan d
Section 5
Educational Profile of
Workforce and Population
Not only is it important to have an adequate supply of people available in the workforce, it is also important to ensure that these people possess the necessary skills to allow the economy to develop and grow to its full potential. While primary education aims to instil the basic skills needed to actively partake in society, the further development of these skills through continued education and training is extremely important and seen as the main way for countries to secure long-term economic growth and general social welfare.
5.1 Educational Attainment in Ireland
Using data from the National Quarterly Household Survey, it is possible to assess the educational
background of the Irish population aged 15 years and over (see Table 5.1). In 2002 (Q2), 59% of the adult population had achieved an upper secondary level education or higher. This was a marginal improvement on the 2001 (Q2) level of 58%. The overall trend is of an increasingly educated population however with a higher proportion of women (62%) than men (57%) attaining levels of education beyond lower secondary level. Comparing educational attainment across regions shows the Dublin region to have the highest level of attainment followed by the West region (66% and 62% with at least an upper secondary level education respectively). The Border region was found to have the lowest proportion having achieved at least upper secondary level education (46%).
TABLE 5.1 DISTRIBUTION OF POPULATION AGED 15 AND OVER BY EDUCATIONAL ATTAINMENT AND NUTS3 REGION, Q2 2001 - Q2 2002
18
2001 Q2 2002 Q2 2002 Q2 BY NUTS3 REGION (%)
EDUCATION STATE STATE
LEVEL % % BORDER DUBLIN MIDLANDS MID-EAST MID-WEST SOUTH-EAST SOUTH-WEST WEST
Pre-primary 1.2 1.0 0.8 0.9 1.2 0.8 1.6 0.9 1.4 0.7
Primary 19.7 18.8 28.6 16.1 20.0 16.9 17.1 21.4 18.0 18.1
Lower Secondary 21.2 21.0 25.0 17.5 26.7 21.1 20.4 26.5 20.9 19.1
Upper Secondary 26.4 26.4 21.4 26.3 26.6 25.4 32.2 25.0 25.0 30.5
Post-secondary
Non-tertiary 11.2 10.8 9.3 9.7 11.1 13.1 11.0 11.4 12.8 9.4
Non-degree
3rd Level 8.4 8.5 7.3 9.2 6.6 9.6 7.3 6.5 9.8 8.9
Degree 3rd Level 11.7 13.1 7.3 19.6 7.7 12.7 10.0 8.1 11.8 12.9
Advanced Research
Qualification 0.4 0.4 0.2 0.7 * 0.3 0.3 0.1 0.3 0.3
Total 100 100 100 100 100 100 100 100 100 100
5.2 International Comparison
Secondary Education
A study of the proportion of adults who have graduated from secondary school education provides a guide to the basic skill levels of a population upon leaving school. Table 5.2 compares Ireland’s secondary school graduation rates with those of fellow OECD Member States.
Using data for 2001, Table 5.2 shows that 58% of the Irish population aged between 25 and 64 have successfully completed secondary education, ranking Ireland 16th out of 20 countries. This proportion is slightly below the OECD average rate of 64%14. However, there are signs that educational attainment in Ireland is rising with a significantly higher proportion of 25-34 year olds completing upper secondary level education than 55-64 year olds. This reflects Ireland’s historic underinvestment in education and the effects of the introduction of free education in 1967.
TABLE 5.2 % OF POPULATION WITH UPPER SECONDARY EDUCATION OR HIGHER, 2001
25-64 YEARS 25-34 YEARS 55-64 YEARS
(RANK) (RANK) (RANK)
US 88 (1) 88 (8) 83 (1)
Switzerland 87 (2) 92 (4) 81 (2)
Czech Republic 86 (3) 92 (5) 76 (3)
Norway (2000) 85 (4) 93 (3) 70 (6)
Germany 83 (5) 85 (11) 76 (4)
Japan 83 (6) 94 (2) 63 (9)
Canada 82 (7) 89 (7) 67 (7)
Sweden 81 (8) 91 (6) 65 (8)
Denmark 80 (9) 86 (10) 72 (5)
Austria (2000) 76 (10) 83 (12) 63 (10)
New Zealand 76 (11) 82 (13) 60 (11)
Finland 74 (12) 87 (9) 51 (13)
Korea 68 (13) 95 (1) 30 (17)
UK (2000) 63 (14) 68 (17) 55 (12)
Belgium (2000) 59 (15) 75 (14) 38 (14)
Ireland 58 (16) 73 (15) 35 (16)
Greece 51 (17) 73 (16) 28 (18)
Poland 46 (18) 52 (20) 36 (15)
Italy 43 (19) 57 (18) 22 (19)
Spain 40 (20) 57 (19) 17 (20)
OECD Average 64 74 49
Source: OECD (2002), Education at a Glance 2002
While Table 5.2 shows the proportion of the adult population with at least upper secondary education, this data can be broken down further to show what proportion of these went on to attain post-secondary level education. Figure 5.1 presents this breakdown and shows Ireland as having the 2nd highest proportion of adults with upper secondary level education following on to attain a post-secondary level education.
19
B e n ch m a rk in g E d u ca ti o n a n d Tr a in in g fo r E co n om ic De velo pm en tin Ire lan d
FIGURE 5.1 DISTRIBUTION OF THE ADULT POPULATION (25-64 YEAR OLDS) BY HIGHEST LEVEL OF EDUCATIONAL ATTAINMENT, 2001
Source: Calculated by Author. Derived from OECD (2002), Education at a Glance 2002
Tertiary Education
The OECD splits tertiary education into ‘A’ and ‘B’ bands. Type A qualifications are largely theoretically based and designed to provide sufficient qualifications for entry to advanced research programmes and professions with high skill requirements. Type A accreditation ranges from 3 to 5 years and can be equated to university degrees, postgraduate diplomas and Masters.
Type B qualifications are more occupationally oriented and lead to direct labour market access. These courses are typically shorter in duration than Type A courses, usually between 2 and 3 years, and lead to Certificates and Diplomas.
Table 5.3 details the proportion of the Irish population, with the comparable OECD country average figures for 2001, with Type B Tertiary education. Ireland ranks 11th out of the 20 countries benchmarked. Examination of broad age groups shows a higher proportion of younger adults having attained Tertiary Type B education than older adults.
20
Canada Ireland Sp
a
in
Belgium (2000)
New Z
ealand Greece Finland
US Japan Sw eden Switz e rland Norway (2000) OEC
D Country A
ver age Ko re a Denmark Germany Austria (2000) Italy C zech R epublic 100% 90% 80% 70% 60% 50% 40% 30% 20% 10% 0% 65% 62% 58%
49% 47% 45% 43% 43%
37%
41%
36% 36% 35% 35%
34% 28% 13% 23% 40% 35% 38% 42% 51% 53%
55% 57% 57%
63%
59%
64% 64% 65% 65%
66%
72%
87%
77%
60%
TABLE 5.3 % OF POPULATION WITH AT LEAST TERTIARY TYPE B EDUCATION, 2001
25-64 YEARS 25-34 YEARS 55-64 YEARS
(RANK) (RANK) (RANK)
Canada 21 (1) 25 (1) 15 (3)
Denmark 19 (2) 18 (5) 16 (2)
Finland 17 (3) 20 (3) 12 (4)
New Zealand 15 (4) 12 (11) 17 (1)
Belgium (2000) 15 (5) 19 (4) 9 (7)
Sweden 15 (6) 17 (6) 10 (6)
Japan 15 (7) 23 (2) 5 (14)
France 11 (8) 17 (7) 6 (11)
Germany 10 (9) 8 (15) 10 (5)
Switzerland 10 (10) 10 (12) 8 (8)
Ireland* 9 (11) 13 (9) 5 (12)
United States 9 (12) 9 (13) 7 (10)
United Kingdom 8 (13) 9 (14) 7 (9)
Austria (2000) 7 (14) 8 (16) 5 (13)
Spain 7 (15) 12 (10) 2 (17)
Korea 7 (16) 15 (8) 1 (20)
Iceland 6 (17) 6 (18) 4 (15)
Greece 5 (18) 7 (17) 3 (16)
Netherlands (2000) 3 (19) 2 (20) 2 (18)
Norway (2000) 3 (20) 3 (19) 2 (19)
OECD Average 8 10 6
Source: OECD (2002), Education at a Glance 2002 *Source: CSO, QNHS 2001 Q2
In terms of Type A tertiary qualifications including Ph.Ds, Table 5.4 shows that in 2001 14% of the adult population in Ireland had attained this level of education compared to 26% in the top ranking country, the United States. Overall, Ireland ranked 13th out of 20 countries. Examination of age cohorts shows younger adults to have achieved higher education levels than older adults.
B
e
n
ch
m
a
rk
in
g
E
d
u
ca
ti
o
n
a
n
d
Tr
a
in
in
g
fo
r
E
co
n
om
ic
De velo pm
en tin Ire lan d
TABLE 5.4 % OF POPULATION WITH AT LEAST TERTIARY TYPE A EDUCATION, 2001
25-64 YEARS 25-34 YEARS 55-64 YEARS
(RANK) (RANK) (RANK)
United States 28 (1) 30 (2) 24 (1)
Norway (2000) 26 (2) 32 (1) 19 (2)
Netherlands (2000) 21 (3) 24 (6) 15 (4)
Canada 20 (4) 25 (3) 15 (3)
Japan 19 (5) 24 (5) 10 (11)
Iceland 19 (6) 21 (8) 11 (9)
United Kingdom 18 (7) 21 (9) 12 (7)
Korea 17 (8) 25 (4) 8 (14)
Sweden 17 (9) 20 (11) 15 (5)
Spain 17 (10) 24 (7) 8 (12)
Switzerland 16 (11) 16 (17) 13 (6)
Finland 15 (12) 18 (12) 11 (8)
Ireland 14 (13) 20 (10) 8 (15)
New Zealand 14 (14) 17 (14) 7 (17)
Germany 13 (15) 14 (18) 10 (10)
Greece 12 (16) 17 (16) 6 (18)
Belgium (2000) 12 (17) 17 (15) 8 (16)
France 12 (18) 18 (13) 8 (13)
Denmark 8 (19) 11 (19) 4 (20)
Austria (2000) 7 (20) 7 (20) 4 (19)
OECD Average 15 19 10
Source: OECD (2002), Education at a Glance 2002
Educational Attainment by Gender
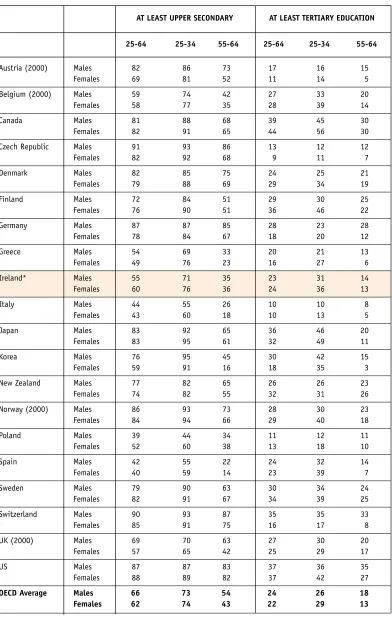
Examination of educational attainment by gender shows that in 2001 a higher proportion of females than males had achieved an education of at least upper secondary level. This was also found to be the case for educational levels at or above tertiary level (see Table 5.5). These results were found to be consistent across age groups.
TABLE 5.5 EDUCATIONAL ATTAINMENT OF THE POPULATION BY GENDER, 2001
AT LEAST UPPER SECONDARY AT LEAST TERTIARY EDUCATION
25-64 25-34 55-64 25-64 25-34 55-64
Austria (2000) Males 82 86 73 17 16 15
Females 69 81 52 11 14 5
Belgium (2000) Males 59 74 42 27 33 20
Females 58 77 35 28 39 14
Canada Males 81 88 68 39 45 30
Females 82 91 65 44 56 30
Czech Republic Males 91 93 86 13 12 12
Females 82 92 68 9 11 7
Denmark Males 82 85 75 24 25 21
Females 79 88 69 29 34 19
Finland Males 72 84 51 29 30 25
Females 76 90 51 36 46 22
Germany Males 87 87 85 28 23 28
Females 78 84 67 18 20 12
Greece Males 54 69 33 20 21 13
Females 49 76 23 16 27 6
Ireland* Males 55 71 35 23 31 14
Females 60 76 36 24 36 13
Italy Males 44 55 26 10 10 8
Females 43 60 18 10 13 5
Japan Males 83 92 65 36 46 20
Females 83 95 61 32 49 11
Korea Males 76 95 45 30 42 15
Females 59 91 16 18 35 3
New Zealand Males 77 82 65 26 26 23
Females 74 82 55 32 31 26
Norway (2000) Males 86 93 73 28 30 23
Females 84 94 66 29 40 18
Poland Males 39 44 34 11 12 11
Females 52 60 38 13 18 10
Spain Males 42 55 22 24 32 14
Females 40 59 14 23 39 7
Sweden Males 79 90 63 30 34 24
Females 82 91 67 34 39 25
Switzerland Males 90 93 87 35 35 33
Females 85 91 75 16 17 8
UK (2000) Males 69 70 63 27 30 20
Females 57 65 42 25 29 17
US Males 87 87 83 37 36 35
Females 88 89 82 37 42 27
OECD Average Males 66 73 54 24 26 18
Females 62 74 43 22 29 13
Source: OECD (2002), Education at a Glance 2002
*Note: Data on “at least Tertiary Education” sourced from CSO, QNHS 2001 Q2
B
e
n
ch
m
a
rk
in
g
E
d
u
ca
ti
o
n
a
n
d
Tr
a
in
in
g
fo
r
E
co
n
om
ic
De velo pm
en tin Ire lan d
24
5.3 Summary and Key Issues
It is widely acknowledged that the lack of educational attainment remains a critical factor in the risk and persistence of long-term unemployment. This, together with an increasing demand for a highly skilled workforce arising from Ireland’s strive towards a knowledge-based economy, makes it imperative to improve upon educational attainment levels.
In recent years, the overall trend in Ireland is of an increasingly educated population with a greater proportion of women than men achieving higher levels of education. Trends also show 24-65 year olds in the Dublin region to have achieved a higher level of educational attainment in comparison with other NUTS3 regions which may have implications for regional imbalance.
Despite this overall increase, Ireland compares poorly with other OECD countries in terms of the proportion of the population having attained at least upper secondary education. At 58% of the population, Ireland ranks 16th of 20 countries benchmarked. While this proportion is low, what is encouraging is that 62% of these continue to attain a post-secondary level education. This is the 2nd highest rate among the countries assessed. A key issue therefore is to increase retention and success rates at secondary level to ensure an increased proportion of the population have acquired the basic skills needed to successfully participate in a changing economy. In addition, by providing a greater proportion of students with upper secondary level education, it is likely that the flow of students to higher education will increase.
Comparison of tertiary educational attainment across 20 countries shows Ireland to rank 11th in terms of the proportion of the population having achieved Tertiary Type B education. For Type A education, Ireland ranks 13th. Policy needs to examine the factors relating to the low achievement of third level
qualifications in Ireland. The possibility of increasing progression rates from certificate and diploma courses to degree programmes should be assessed.
Section 6
Performance to
School Leaving Certificate
The attainment of an upper level secondary education is becoming increasingly important in today’s knowledge-driven economy. Not only does it increase success in transitioning directly into the labour market, it also provides access to education and training in higher educational institutes.
6.1 International Comparison
Figure 6.1 compares the ratio of upper secondary graduates to the population at the typical age of graduation for 13 OECD countries. Ireland ranks 11th, lying below the OECD average with 74% of the population at the typical age of graduation achieving a leaving certificate standard of education in 200015.
FIGURE 6.1 UPPER SECONDARY GRADUATION RATES, 2000
Source: OECD (2002), Education at a Glance 2002
Gender
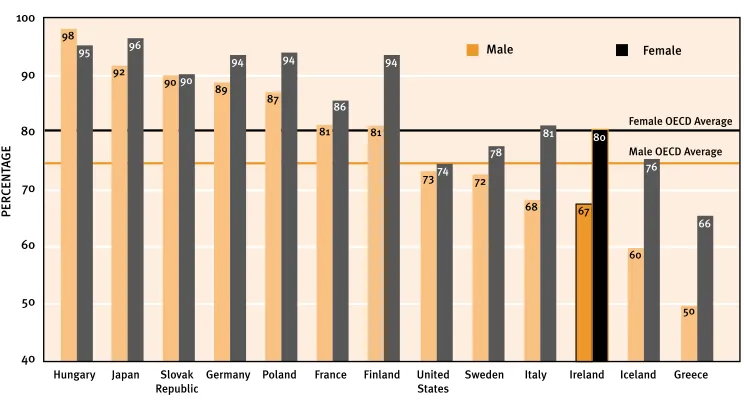
Further examination of these results show that in Ireland 80% of the female population at the typical age of graduation achieved an upper secondary level education in 2000, and only 67% of the male population (see Figure 6.2). This gap between male and female levels is very high by international comparison. While the graduation rate for females was in line with the OECD average of 80%, the male rate was found to be considerably less than the OECD average of 74%.
25
15 Given that only 13 OECD countries provided data for this indicator, it is possible that Ireland is being assessed against top performers.
Hungary Japan Germany Poland Slovak Republic Finland France Sweden Italy United States Ireland Iceland
Greece 58
67
74 74 75
75
84 87
90 90 91
94 97
50 60 70 80 90 100
Percentage
OEC
D A
ve
rage
B e n ch m a rk in g E d u ca ti o n a n d Tr a in in g fo r E co n om ic De velo pm en tin Ire lan d
FIGURE 6.2 UPPER GRADUATION RATES BY GENDER, 2000
Source: OECD (2002), Education at a Glance 2002
Early School Leavers – 18-24 Age Cohort
16 [image:32.595.124.507.542.780.2]Figure 6.3 compares the percentage of 18-24 year olds across 15 European countries who have dropped out of school having attained no more than a lower secondary education and who are not partaking in further education or training. In 1997, Ireland’s school-leaver rate was 19%. By 2002, this rate had fallen to 15% ranking Ireland 7th of the 15 countries examined. The EU average was estimated at 19%. Drop-out rates varied considerably between countries ranging from 10% in Austria to 46% in Portugal. Compared to 1997 data, drop-out rates appear to have improved (i.e. reduced in most countries) although the worst performer in 1997 (Portugal) saw its rate increase further in 2001 as did the best three performers from 1997 (Sweden, Finland and Denmark).
FIGURE 6.3 PROPORTION OF 18-24 AGE COHORT HAVING ACHIEVED LOWER SECONDARY LEVEL EDUCATION OR LESS AND NOT ATTENDING EDUCATION OR TRAINING, 1997 & 2002
Source: Eurostat, LFS
26
16 At European level, a target has been set to achieve an EU average rate of no more than 10% early school leavers by 2010. The term “early school leaver” is used to refer to those aged 18-24 who have dropped out of school having attained no more than a lower secondary education and who are not partaking in further education or training. For consistency, this document will use the same definition for “early school leaver”.
Male Female 100 90 80 70 60 50 40 98 95 92 96 9090 89 94 87 94 81 86 81 94
7374 72
78 68 81 67 80 60 76 50 66
Hungary Japan Slovak Republic
Germany Poland France Finland United States
Sweden
Female OECD Average
Male OECD Average
Italy Ireland Iceland Greece
PE RCE N TA G E 50 45 40 35 30 25 20 15 10 5 0 P e rcent a g e
Austria Finland Sw
eden
Belgium Germany France Ireland
Netherlands
Denmark Greece
Lu
xe
mbourg
EU
15
Italy Spa
in P o rtugal UK 10.8 9.5 8.1 9.9 6.8 10.4 12.7 1997 2002
12.4 12.9 12.5
6.2 National Data on Leaving Certificate Subjects
[image:33.595.85.394.246.579.2]According to 2001 data, the typical Leaving Certificate candidate in Ireland studied maths, 3 languages, one social studies subject (history, geography, art, music) and 2 from either technology/applied science, business or science. Examination of subject take-up shows a marked difference between males and females as highlighted in Figure 6.4.
FIGURE 6.4. PROPORTION OF GENDER COHORT17TAKING LEAVING CERTIFICATE SUBJECTS, 2000/2001
Source: Task Force on the Physical Sciences (2002)
Since the early 1990’s, the take-up of science among second-level students has been declining. While 16% of Leaving Certificate students enrolled in chemistry in 1990, only 12% did in 2001. Also, enrollment for physics fell from 20% in 1990 to 16% in 2001. To tackle the fall-off in numbers opting to study the physical sciences at secondary and tertiary education, the Government set up a Task Force in 2000 to examine the issues involved. In 2002, a report was produced by the Task Force outlining a series of recommended policy actions. Work on their implementation is ongoing.
27
BiologyHome Economics
Physics
Chemistry
Construction Studies
Technical Drawing
Engineering
Agriculture Science
Physics & Chemistry (combined)
PERCENTAGE
0 10 20 30 40 50 60 70
% Female
% Male 56.9
29.8
56.8
9.1
7.9
25.4
12.3
11.6
2.3
33.5
24.0
19.6
9.2
1.7
1.2
2.3
1.1
3.0
Figure



Related documents