On The Reactivity of Graphene and
MoS
2
and the Preparation of Their
Heterostructures
Ciara McGlynn
Supervisor: Dr. Aidan R. McDonald
School of Chemistry
University of Dublin, Trinity College
This dissertation is submitted for the degree of
Doctor of Philosophy
Declaration
I declare that this thesis has not been submitted as an exercise for a degree at this or any other university and it is entirely my own work. I agree to deposit this thesis in the University’s open access institutional repository or allow the Library to do so on my behalf, subject to Irish Copyright Legislation and Trinity College Library conditions of use and acknowledgement.
Signature
Acknowledgements
I would like to extend my gratitude to Dr Aidan McDonald for the allowing me to undertake this project and for his enduring patience and sound advice. I am eternally grateful to all of my labmates over the last four years; Dr. Adriana Magherusan, Dr. Andy Ure, Dr. Ankita Das, Dr. Bertrand Gerey, Daniel Nelis, Dr Duenpen Unjaroen, Giuseppe "Peppe" Spedalotto, Marta Lovisari, Dr. Paolo Pirovano, Philipp Heim, Dr. Prasenjit Mondal and in particular, my fellow materials chemistry black sheep, Dr. Xin Chen. Thank you all for all the pats, high-fives, baked goods, hugs, casual and serious chats, pints and karaoke nights.
I would also like to thank Dr John O’Brien and Dr Manuel Ruether for their help in running NMR spectra and training me in the use of TGA and TGA-IR, respectively. As much as you two like to joke about it, I like to think I fixed the TGA almost as much as I broke it. Dr Gary Hessman and Dr Martin Feeney deserve mentions for their assistance in running ESI and MALDI-TOF mass spectrometry, and I must also mention Dr Brendan Twamley for his instruction in running pXRD, and remind him that on Wednesdays, we have baked goods in the office. Lastly, from CRANN and the AML, I would like to thank Dr Nina Berner, for producing XPS spectra of some of the samples presented herein and assisting me in the analysis, Mr Owen Brazil, for providing the AFM images, Dr Keith Paton, for his Raman spectroscopy training, Dr. Clodagh Dooley for her SEM training and Dr David McAteer for all his help and suggestions re electrochemistry.
I could not have completed this thesis without the support of my family; my sister for being a role model and occasional life-coach, my mother for her saintly patience when listening to my despairing, general feelings of stress, and not being too polite to snap me out of it, my brother for good-naturedly putting up with my irritability when it was undeservingly directed at him, my father for providing relief through his music suggestions and his own blended brand of comedy, my aunts Anne and Din for never failing to check up on me, and even Gonzo the budgie, for always whistling back to me whenever I was writing from home.
I am extremely grateful to my endlessly supportive boyfriend Rob, who has never known me outside of my PhD and will hopefully be pleasantly surprised, and to Dermot, for providing many, many cups of tea, a fellow PhD student’s sympathetic ear and many continuing years of friendship. I must also mention all my friends from DU Karate club, for giving me an outlet for my stress through punches and kicks, not to mention parties, and the Stoneybanter group, in particular Dónal and Árann, for being the best roommates and friends when all of our futures faced varying degrees of uncertainty. My thoughts also go to
Summary
Graphene and MoS2are two of the most researched materials in nanoscience, and are expected
to be used for a range of applications in the future. This thesis sets out to deepen the under-standing of their chemistry, by studying the possible reactivity of a series of powerful oxidants
towards graphene, the chemical interaction of graphene and MoS2 during heterostructure
synthesis, and the functionalisation of these materials for novel, covalently-joined
heterostruc-tures. The reaction of graphene with hydrogen peroxide,tert-butyl alcohol, peracetic acid,
meta-chloroperbenzoic acid, iodosobenzene and diacetoxy iodobenzene, found that these
inorganic and organic oxidants have little to no ability to oxidise graphene. Comparing this to the reactivity studies performed using Fenton’s reagent, some oxidation of the edges of
few-layer graphene was observed. The use of the highly reactive [FeV(BPMEN)(O)(OH)]
and [FeV(TPA)(O)(OH)] species also yielded edge-oxidised graphene, but full degradation
was not observed. In conclusion, Fenton’s reagent and the metalloenzymes employed by soil bacteria to degrade aromatic detritus may increase in the bioavailability of graphene rather than degrading, increasing its nanotoxicity.
The formation and study of a series of heterostructures of chemically
exfoliated-1T-MoS2/graphene and 2H-MoS2/graphene revealed an often overlooked but recently postulated
donation of electron density from graphene to MoS2. This was observed spectroscopically as
the increase of sp3-hybridised carbon in graphene after sonication in the presence of either
ce-1T-MoS2or 2H-MoS2, with the 1T-phase showing greater reactivity towards graphene.
This saturation of graphene was found to be concentration-dependent on MoS2. Evidence
for this was also demonstrated by the effect that saturation had on the HER activity of the
heterostructures, from high to low graphene content, compared to ce-1T- or 2H-MoS2alone.
A covalently-linked heterostructure of graphene and ce-1T-MoS2was prepared by
func-tionalising graphene with benzoyl chloride and ce-1T-MoS2with ethanol, and allowing the
functionalised materials to undergo esterification. Graphene was also functionalised with benzoic acid and iodoethyl benzoate, demonstrating the versatility of functionalised graphene. The heterostructure was spectroscopically characterised and showed a decrease in resistance
Table of contents
List of figures xiii
List of tables xxi
Abbreviations xxiii
1 Introduction 1
1.1 Overview . . . 1
1.2 2D Materials: Introduction to Graphene . . . 3
1.3 2D Materials: Introduction to Transition Metal Dichalcogenides . . . 5
1.4 Synthesis and Application of 2D Materials . . . 7
1.5 Application: Hydrogen Evolution Reaction . . . 13
1.6 Combining 2D Materials: Heterostructures . . . 15
1.7 Functionalisation of Graphene and TMDs . . . 17
1.8 Graphene in Biology and its Attempted Biomediation . . . 26
1.9 Fenton Chemistry . . . 29
1.10 Rieske Dioxygenases and Biomimetic Investigation of Their Catalytic Prop-erties . . . 32
1.11 Research Aims and Scope of Thesis . . . 36
References . . . 38
2 Preparation and Characterisation of Liquid Phase Exfoliated Graphene, 2H-MoS2and Chemically Exfoliated 1T-MoS2 51 2.1 Introduction . . . 51
2.3 Preparation and Characterisation of ce-1T-MoS2 . . . 65
2.4 Preparation and Characterisation of 2H-MoS2 . . . 72
2.5 Methods and Instrumentation . . . 78
References . . . 80
3 Graphene and Its Reactivity towards the Fenton Reagent and High-Valent Iron-Containing Biomimetic Catalysts 83 3.1 Introduction . . . 83
3.2 Reacting Common Laboratory Oxidants with Graphene . . . 86
3.2.1 Reactivity of Peroxides towards Few-Layer Graphene . . . 86
3.2.2 Reactivity of Peracids towards Few-Layer Graphene . . . 90
3.2.3 Reactivity of Iodosyl Arene Oxidants Towards Graphene . . . 93
3.2.4 Summary . . . 95
3.3 Reactivity of Fenton’s Reagent Toward Graphene . . . 97
3.3.1 Results . . . 97
3.3.2 Summary . . . 104
3.4 Reactivity of Biomimetic Catalysts toward Graphene . . . 106
3.4.1 Results . . . 107
3.4.2 Summary . . . 110
3.5 Conclusions . . . 111
3.6 Experimental Methods . . . 114
References . . . 118
4 The Interaction of Graphene with MoS2and the Use of their Heterostructures as HER Catalysts 121 4.1 Abstract . . . 121
4.2 Introduction . . . 122
4.3 Results . . . 123
4.4 Measuring the HER activity of ce-1T-MoS2/graphene and 2H-MoS2/graphene.135 4.4.1 ce-1T-MoS2/graphene Heterostructures . . . 135
4.4.2 2H-MoS2/graphene Heterostructures . . . 137
Table of contents
4.6 Experimental Methods . . . 142
References . . . 144
5 The Formation of a Covalently Linked Heterostructure of Graphene and 1T-MoS2and its Use as a Catalyst for HER 147 5.1 Introduction . . . 147
5.2 Preparation of a Linked Heterostructure of Graphene and MoS2 . . . 151
5.2.1 Preparation of Benzoic-Acid Functionalised Graphene . . . 151
5.2.2 Preparation of Benzoyl Chloride Functionalised Graphene . . . 162
5.2.3 Preparation of Iodoethyl Benzoate Functionalised Graphene . . . . 171
5.2.4 Functionalisation of MoS2With Ethanol . . . 177
5.2.5 Formation of Linked Graphene and MoS2 . . . 183
5.3 Use of Covalently-linked Heterostructures as Catalysts for HER . . . 193
5.4 Conclusions . . . 196
5.5 Experimental Methods . . . 199
References . . . 204
6 General Conclusions and Future Work 207 6.1 Key Findings and Contributions . . . 208
6.2 Future Work . . . 211
References . . . 214
Appendix A Chapter 3 217 Appendix B Chapter 4 227 B.1 Tables . . . 227
B.2 Figures . . . 228
List of figures
1.1 Ball-and-stick models of (a) graphite and (b) graphene. Grey = carbon, white
= hydrogen-terminated edges. . . 5
1.2 Ball-and-stick models of monolayer (a) 1T-MoS2and (b) 2H-MoS2, showing
side on view and basal plane. Yellow = sulfur, cyan = molybdenum. . . 7
1.3 The liquid phase exfoliation of graphite or 2H-MoS2 by sonication to a
dispersion of few-layer nanosheets. . . 11
1.4 n-BuLi mediated chemical exfoliation of bulk 2H-MoS2to monolayer
1T-MoS2. . . 12
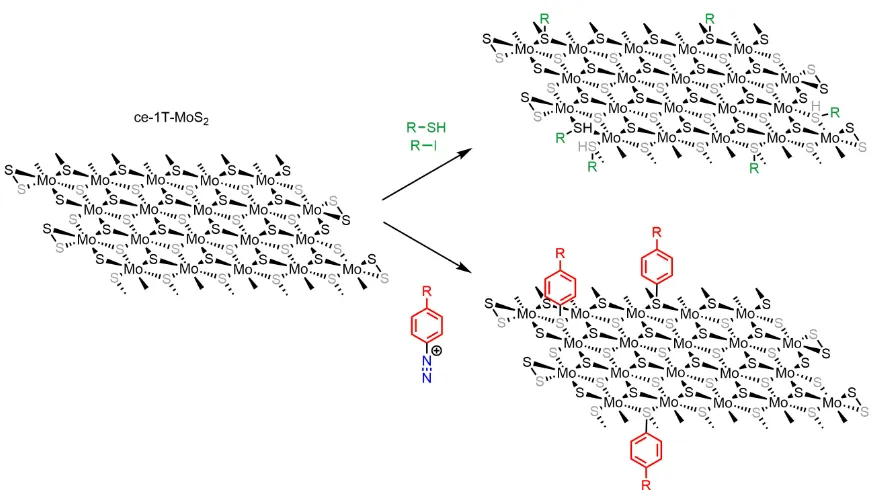
1.5 Summary of the main functionalisation pathways of graphene. . . 18
1.6 Summary of the two main methods of covalent functionalisation of
ce-1T-MoS2. . . 24
1.7 The active site of naphthalene dioxygenase, showing the 2-His-1-carboxylate
facial triad common to many FeII-containing metalloenzymes. Based on the
diagram from Bassanet al.[187] . . . 32
1.8 The postulated mechanisms for cis-dihydroxylation of arenes by Rieske
enzymes. Based on the mechanism proposed by Ramaswamyet al.[189] . . 34
1.9 The complexes investigated in this study: (a) [FeII(BPMEN)(OTf)2] (b) and
[FeII(TPA)(OTf)2]. . . 35
2.1 UV-vis spectrum of SGN18 graphene in IPA. . . 53
2.2 ATR-IR spectrum of SGN18 graphene. . . 54
2.3 DRIFT spectra of graphene from (a) SGN18 graphite and (b) PP10 graphite. 55
2.4 Raman spectra of graphene from (a) SGN18 graphite (b) PP10 graphite
normalised to the ‘G’ peak (1580 cm-1) of graphene. . . 56
2.5 (a) TGA trace and 1stderivative of SGN18 graphene, (b) TGA trace and 1st
2.6 Coupled TGA-IR spectra of (a) SGN18 graphene and (b) PP10 graphene at
specific temperatures. . . 58
2.7 (a) Survey spectrum (1), C 1s (2) and O 1s (3) core level spectra of graphene from SGN18 graphite, and (b) survey spectrum (4), C 1s (5) and O 1s (6) core level spectra of graphene from PP10 graphite. . . 60
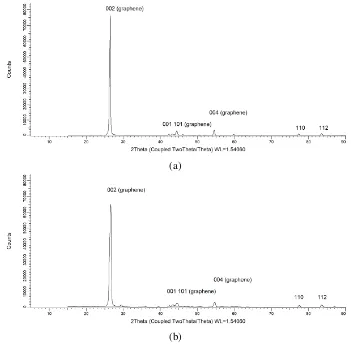
2.8 Powder X-ray diffractograms of graphene from (a) SGN18 graphite, and (b) PP10 graphite. . . 61
2.9 SEM (in secondary electron mode) images of drop-cast exfoliated graphene from (a) SGN18 and (b) PP10 graphite. . . 62
2.10 AFM images of few-layer graphene from (a) SGN18 and (b) PP10 graphite, kindly provided by Mr Owen Brasil. . . 63
2.11 UV-vis spectrum of ce-1T-MoS2in water. . . 66
2.12 ATR-IR spectrum of ce-1T-MoS2powder. . . 66
2.13 TGA trace (a) and its corresponding 1stderivative trace (b) of ce-1T-MoS2 under nitrogen. . . 67
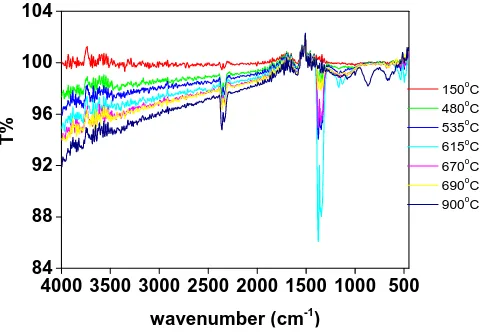
2.14 TGA-IR spectra of ce-1T-MoS2at the stated temperatures. . . 68
2.15 Raman spectrum of ce-1T-MoS2taken using (a) the 532 nm laser line and (b) the 633 nm laser line. . . 69
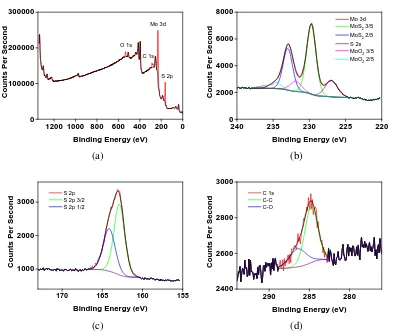
2.16 (a) Survey spectrum, (b) Mo 3d, (c) S 2p and (d) C 1s core level spectra of ce-1T-MoS2. . . 70
2.17 Powder X-Ray diffractogram of ce-1T-MoS2. . . 71
2.18 SEM image showing flakes of ce-1T-MoS2in In Lens mode. . . 71
2.19 UV-vis spectrum of 2H-MoS2in IPA. . . 73
2.20 ATR-IR spectrum of 2H-MoS2. . . 73
2.21 TGA trace (a) and its corresponding 1st derivative trace (b) of 2H-MoS2 under nitrogen. . . 74
2.22 TGA-IR spectra of 2H-MoS2at the stated temperatures. . . 75
2.23 Raman spectra of 2H-MoS2taken using the (a) 532 nm and (b) 633 nm laser lines. . . 75
2.24 (a) Survey spectrum, (b) Mo 3d, (c) S 2p and (d) C 1s core level spectra of 2H-MoS2. . . 76
2.25 Powder X-ray diffractogram of 2H-MoS2with diffraction planes labelled. . 77
2.26 SEM image of 2H-MoS2in secondary electron mode. . . 78
List of figures
3.2 (a) The Raman spectra of H2O2 treated SGN18 graphene (red) tBuOOH
treated graphene (blue) and pristine SGN18 graphene (black). (b) TGA traces
and (c) 1stderivative traces showing H2O2treated graphene (red)tBuOOH
treated graphene (blue) and pristine graphene (black). . . 88
3.3 The survey spectrum (a) and C 1s spectrum (b) of H2O2treated graphene. . 89
3.4 (a) Raman spectra of peracetic acid treated graphene (red)m-CPBA treated
graphene (blue) and pristine graphene (black). (b) TGA traces and (c) 1st
derivative traces of peracetic acid treated graphene (red),m-CPBA treated
graphene (blue) under N2. . . 92
3.5 (a) Raman spectra of graphene treated with DAIB (red) and PhIO (blue) with
pristine graphene (black). (b) TGA traces run under nitrogen, showing DAIB
treated graphene (red) or PhIO treated graphene (blue). . . 95
3.6 (a) The TGA traces and (b) 1st derivatives of 50% Fenton treated graphene
(red) and pristine graphene (black). (c) the TGA-IR spectra showing the
evolution of CO2as T increases from 50% mol/mol Fenton-treated graphene. 99
3.7 The DRIFT-IR spectra for (a) 50% mol/mol Fenton-treated graphene and (b)
pristine graphene. . . 100
3.8 High resolution (a) survey spectrum and (b) C 1s core level spectrum of 50%
mol/mol Fenton treated graphene. The scan and fitting were provided by Dr. Nina Berner. . . 101
3.9 A Raman spectrum showing no change in D peak (1350 cm-1) intensity
compared to pristine graphene after treatment with 10% mol/mol Fenton reagent. . . 103
3.10 The TGA traces of washed SGN18 graphene treated with (a) 10% mol/mol
[FeV(BPMEN)(O)(OH)] and (b) 10% mol/mol [FeV(TPA)(O)(OH)]
show-ing weight loss before 600 °C (Figure A.12 shows the full traces). . . 107
3.11 Typical DRIFT-IR spectra obtained for graphene treated with [FeV(BPMEN)
(O)(OH)] (green) and [FeV(TPA) (O)(OH)] (blue). . . 109
3.12 (a) Survey spectrum and (b) the C1s core level spectrum of 10% [FeV(BPMEN)
(O)(OH)] treated PP10 graphene. . . 109
3.13 The Raman spectrum of [FeV(BPMEN)(O)(OH)] treated graphene showing
shifted baseline, and the SGN18 graphene control. (b) The Raman spectra of
SGN18 graphene treated with (green) [FeV(BPMEN)(O)(OH)] and (blue)
[FeV(TPA)(O)(OH)], showing no change. . . 111
4.1 (a) pXRD pattern of 1:5 ce-1T-MoS2/graphene heterostructure (black trace)
with ce-1T-MoS2(red trace). (b) pXRD pattern of 1:15 2H-MoS2/graphene
4.2 Top: InLens mode, bottom: ESB mode) of 1:5 ce-1T-MoS2/graphene
show-ing mix of ce-1T-MoS2and graphene flakes interspersed. . . 126
4.3 SEM images taken using (a) InLens mode and (b) ESB mode of 1:15
2H-MoS2/graphene showing interspersed MoS2and graphene flakes. . . 127
4.4 (a) Survey and (b) C 1s core level spectra of a heterostructure of 1:5
ce-1T-MoS2/graphene; (c) survey and (d) C 1s core level spectra of a heterostructure
of 1:15 2H-MoS2/graphene. . . 129
4.5 Histograms of the composition of the C 1s core level XPS spectra in a series
of (a) ce-1T-MoS2/graphene and (b) 2H-MoS2/graphene heterostructures,
showing the increase in sp3-hybridised component. The error bars show the
range of values obtained from 3 samples. . . 130
4.6 ATR-IR difference spectra by subtracting heterostructure spectra from
pris-tine graphene spectra: 1:15 2H-MoS2/graphene. . . 131
4.7 TGA traces showing (a) the weight loss of a 1:5 molar ce-1T-MoS2/graphene
compared to the starting materials, (b) the weight loss of 1:15 2H-MoS2/graphene
compared to controls. (c) and (d) the cumulative weight loss between 200–
600 °C for the different heterostructures of ce-1T-MoS2/graphene and
2H-MoS2/graphene. . . 132
4.8 Overlaid IR spectra from coupled TGA-IR analysis of (a) a heterostructure of
1:5 ce-1T-MoS2/graphene and (b) one of 1:15 2H-MoS2/graphene showing
the release of CO2, SO2and anomalous organic matter (at 1200 cm-1) with
heating. . . 133
4.9 (a) LSV sweeps and (b) EIS Nyquist plots of ce-1T-MoS2 and various
heterostructures of ce-1T-MoS2/graphene. . . 137
4.10 (a) LSV sweeps and (b) EIS Nyquist plots of 2H-MoS2and 2H-MoS2/graphene
heterostructures. . . 139
5.1 ATR-IR spectra of benzoic acid (black) as-synthesised gra-PhCOOH (red)
and ’clean’ gra-PhCOOH (green) (Figure C.3 shows the region 2000–550
cm-1in greater detail). . . 152
5.2 (a) TGA traces and (b) corresponding derivatives of pristine graphene (black),
as-synthesised gra-PhCOOH (red) and cleaned gra-PhCOOH (green). . . . 154
5.3 (a) Coupled TGA-IR spectra of gra-PhCOOH at stated temperatures. (b) The
spectrum at 210 °C showing benzoic acid and CO2. . . 155
5.4 (a) The survey spectrum and C 1s core level spectrum of gra-PhCOOH,
List of figures
5.5 (a) Powder X-ray diffraction of gra-PhCOOH (black) with graphite peaks
from database for reference (red). (b) pXRD pattern of graphene showing 5–70°for comparison. . . 159
5.6 The gra-PhCOOH Raman spectrum (red) and pristine re-aggregated graphene
spectrum (black). . . 160
5.7 (a) SEM image of untreated gra-PhCOOH showing rod-shaped crystals of
physisorbed material. (b) SEM image of ’clean’ gra-PhCOOH. . . 161
5.8 ATR-IR spectra of gra-PhCOCl (purple) and free tolyl chloride (black) for
comparison (Figure C.7 shows the range 2000–550 cm-1 in greater detail). . 163
5.9 (a) TGA traces and (b) corresponding derivatives of gra-PhCOCl (purple)
compared to pristine graphene (black). . . 165
5.10 (a) TGA-IR spectra of gra-PhCOCl at a range of temperatures. (b) IR
spectrum showing the evolution of CO2at 445°C. . . 165
5.11 (a) Survey spectrum of gra-PhCOCl showing atomic species. (b) C1s core level spectrum of gra-PhCOCl. . . 166
5.12 Powder X-ray diffraction of gra-PhCOCl (black) with graphite peaks from database (red). . . 167
5.13 ATR-IR spectra of graphene treated with SOCl2(blue) and pristine graphene
(black). . . 168
5.14 (a) TGA trace and (b) derivative of graphene treated with SOCl2. (c) TGA-IR
spectra taken at specific temperatures. . . 169
5.15 ATR-IR of gra-PhCOOEtI from gra-PhCOCl and iodoethanol (pink) overlaid with a spectrum of ethyl benzoate (black) (Figure C.10 shows the labelled spectrum). . . 172
5.16 (a) TGA traces and (b) corresponding derivatives of gra-PhCOOEtI from gra-PhCOCl (pink) compared to re-aggregated graphene (black). . . 173
5.17 (a) Survey spectrum and (b) C 1s core level spectrum of gra-PhCOOEtI. . . 174
5.18 Powder X-ray diffraction of gra-PhCOOEtI from gra-PhCOCl (cyan). . . . 175
5.19 (a) ATR-IR spectrum, (b) TGA trace and (c) 1stderivative rof gra-PhCONHPh.176
5.20 ATR-IR spectrum of MoS2-EtOH (blue) and ethanol (black). . . 178
5.21 TGA trace of MoS2-EtOH (blue) with ce-1T-MoS2trace (black) for
compar-ison. . . 178
5.22 (a) TGA trace of MoS2-EtOH (blue) with ce-1T-MoS2 trace (black) for
comparison. (b) TGA-IR spectrum showing the evolution of CO2at 500 °C. 179
5.23 (a) Survey spectrum (b) Mo 3d (c) S 2p (d) C 1s core level spectrum of
5.24 Raman spectra of (a) MoS2-EtOH (blue) and ce-1T-MoS2(black) taken with
532 nm line. (b) MoS2-EtOH (red) and ce-1T-MoS2(black) taken with 633
nm line. . . 181
5.25 ATR-IR spectrum of gra-PhCOOEt-MoS2 from gra-PhCOCl and MoS2
-EtOH (teal) compared to free ethyl benzoate (black). . . 185
5.26 (a) TGA traces and (b) derivatives of gra-PhCOOEt-MoS2 (c) TGA-IR
spectra showing the evolution of CO2at different temperatures in the furnace.186
5.27 Powder X-ray diffraction of gra-PhCOOEt-MoS2(black trace) with graphene
pattern from database (red). . . 187
5.28 Formation of heterostructure through the combination of ce-1T-MoS2and
iodoethyl benzoate functionalised graphene (gra-PhCOOEtI). . . 188
5.29 ATR-IR spectrum of gra-PhCOOEt-MoS2from gra-PhCOOEtI and
ce-1T-MoS2(grey) with ethyl benzoate (black). . . 189
5.30 (a) TGA traces and (b) derivatives of gra-ester-MoS2from gra-PhCOOEtI
and ce-1T-MoS2. . . 190
5.31 (a) Survey spectrum, (b) C 1s, (c) Mo 3d and (d) S 2p core level spectra of
gra-ester-MoS2, from gra-PhCOOEtI and ce-1T-MoS2. . . 191
5.32 (a) The LSV runs of ce-1T-MoS2(red), MoS2-EtOH (blue) and
gra-PhCOOEt-MoS2 (green). (b) The Nyquist plots of ce-1T-MoS2 (red), MoS2-EtOH
(blue) and gra-PhCOOEt-MoS2(green). . . 193
A.1 The structures of all oxidants used in this study: (a) H2O2(b) peracetic acid
(c)tBuOOH (d)m-CPBA (e) DAIB (f) PhIO. . . 217
A.2 DRIFT spectra of PP10 graphene (black) treated with peracetic acid (red)
m-CPBA (blue). . . 218
A.3 (a) TGA traces and (b) 1st derivative traces of peracetic acid (red) acetic acid
(blue) treated graphene and pristine graphene (black). . . 218
A.4 (a) TGA traces of unwashed graphene treated with DAIB (red) and PhIO
(blue) and (b) corresponding 1st derivatives. (c) TGA traces of DAIB and
PhIO only. . . 219
A.5 (a) TGA traces of the spent Fenton’s reagent and (b) unwashed 50% Fenton-treated graphene, showing similar weight losses to the Fenton only trace
above. (c) and (d) show corresponding 1stderivative traces. . . 220
List of figures
A.7 (a) Survey spectrum, (b) C 1s core level spectrum, (c) O 1s core level spectrum, (d) Fe 2p core level spectrum of stoichiometric Fenton treated graphene. . . 222
A.8 (a) Survey spectrum, (b) C 1s core level spectrum, (c) O 1s core level spectrum, (d) Fe 2p core level spectrum of 50% mol/mol Fenton treated graphene. . . 223
A.9 Raman spectra of unwashed (red) and washed (blue) 50% mol/mol Fenton treated graphene with pristine graphene (black). . . 224
A.10 (a) O 1s core level spectrum and (b) Fe 2p core level spectrum of 10%
mol/mol [FeV(BPMEN)(O)(OH)] treated graphene. . . 224
A.11 Raman spectra of PP10 graphene treated with [FeV(BPMEN)(O)(OH)] (red)
and [FeV(TPA)(O)(OH)] (green). . . 225
A.12 Full range TGA traces of (a) 10% Fe(BPMEN)+H2O2treated graphene and
(b) 10% Fe(TPA)+H2O2treated graphene. . . 225
A.13 TGA trace of 10% mol/mol [FeV(BPMEN)(O)(OH)] treated graphene. . . . 226
B.1 (a) Mo 3d core level and (b) S 2p core level spectra from a 1:5 1T-MoS2/graphene
heterostructure. . . 228
B.2 (a) Mo 3d core level and (b) S 2p core level spectra from a 1:25
2H-MoS2/graphene heterostructure. . . 228
B.3 C1s core level spectra for the series of (a) ce-1T-MoS2/graphene
heterostruc-tures and (b) 2H-MoS2/graphene heterostructure. . . 229
B.4 Average sulfur to molybdenum ratio calculated from XPS core level spectra
of (a) ce-1T-MoS2and heterostructure with graphene and (b) 2H-MoS2and
heterostructures with graphene. . . 230
B.5 ATR-IR spectra (full range) of (a) a 1:10 ce-1T-MoS2/graphene
heterostruc-ture and (b) a 1:15 2H-MoS2/graphene heterostructure. . . 230
B.6 ATR-IR difference spectra showing peaks remaining from the spectra of (a)
Graphene subtracted (b) 1T-MoS2subtracted from 1:20 ce-1T-MoS2/graphene.231
B.7 ATR-IR difference spectra showing peaks remaining from the spectra of (a)
Graphene subtracted (b) 2H-MoS2subtracted from 1:15 2H-MoS2/graphene 231
B.8 TGA-IR spectrum of (a) 1:5 ce-1T-MoS2/graphene heterostructure at 420 °C
and (b) of 1:15 2H-MoS2/graphene heterostructure at 460 °C. . . 231
B.9 (a) Raman spectrum of 1:5 1T-MoS2/gra (blue line) and MoS2control (red
line) taken using (a) the 633 nm laser line, (b) the 532 nm laser line. . . 232
B.10 (a) Raman spectrum 1:25 2H-MoS2/gra (green line) with MoS2control (red
C.1 ATR-IR spectrum of 4-carboxybenzene diazonium tetrafluoroborate,
show-ing N-N triple bond at 2307 cm-1. . . 233
C.2 Raman spectrum of free benzoic acid. . . 234
C.3 Labelled ATR-IR of gra-PhCOOH, 2000–550 cm-1. . . 234
C.4 Labelled ATR-IR of ’clean’ gra-PhCOOH, 2000–550 cm-1. . . 235
C.5 (a) O 1s core level and (b) N 1s core level spectra of gra-PhCOOH. . . 235
C.6 (a) O 1s core level and (b) N 1s core level spectra of ‘clean’ gra-PhCOOH. . 235
C.7 Labelled ATR-IR of gra-PhCOCl, 550–2000 cm-1. . . 236
C.8 (a) N 1s core level, (b) Cl 2p core level and (c) O 1s core level spectra of gra-PhCOCl. . . 236
C.9 (a) ATR-IR comparison of gra-PhCOCl (purple) and after hydrolysis by refluxing in water (pink). (b) 2000–550 cm-1 range with the changes in C=O and C-Cl stretch areas highlighed by black boxes. . . 237
C.10 ATR-IR spectrum of gra-PhCOOEtI (pink) from gra-PhCOCl and IEtOH. . 237
C.11 ATR-IR comparison of gra-PhCOOEtI (navy) and after hydrolysis by reflux-ing in dilute HCl (red). . . 238
C.12 (a) O 1s core level, (b) N 1s core level, (c) I 3d core level and (d) Cl 2p core level spectra of gra-PhCOOEtI. . . 238
C.13 (a) O 1s core level and (b) I 3d core level spectra of MoS2-EtOH. . . 239
C.14 ATR-IR comparison of gra-PhCOOEt-MoS2(teal), gra-PhCOCl (purple) and MoS2-EtOH (blue). . . 239
C.15 (a) ATR-IR of fresh gra-PhCOOEt-MoS2(teal) and after refluxing in 0.1 M HCl (violet), full range and (b) 550–2000 cm-1. . . 240
C.16 TGA-IR spectrum of gra-PhCOOEt-MoS2at 490°C, showing CO2given off. 240 C.17 IR spectrum (from TGA-IR) of graphene treated with SOCl2 at 310°C, showing peaks. . . 241
C.18 ATR-IR of gra-PhCOOEt-MoS2from gra-PhCOOEtI and ce-1T-MoS2. . . 241
List of tables
A.1 Average ID:IGfound for graphene from SGN18 and PP10 graphite treated
with the oxidants listed. . . 217
B.1 Average ID:IGand 2LA(M):A1g found for ce-1T-MoS2and graphene (532 nm).227
B.2 Average ID:IGand 2LA(M):A1g found for ce-1T-MoS2and graphene (633 nm).227
B.3 Average ID:IGand 2LA(M):A1g found for 2H-MoS2and graphene (532 nm). 227
Abbreviations
AFM Atomic Force Microscopy
ATR-IR Attenuated Total Reflectance Infrared (Spectroscopy)
BPMEN N,N’-dimethyl-N,N’-bis-(2-pyridin-2-ylmethyl)-1,2-ethanediamine
ce-1T-MoS2 Chemically exfoliated 1T-MoS2
CNTs Carbon nanotubes
CVD Chemical Vapour Deposition
DAIB Diacetoxy iodobenzene
DI Deionised water
DMF N,N-dimethylformamide
DRIFT Diffuse Reflectance Infrared Fourier Transform (Spectroscopy)
FT-IR Fourier Transform infrared spectroscopy
GIC Graphite Intercalated Compound
GO Graphene oxide
HER Hydrogen Evolution Reaction
HOPG Highly Ordered Pyrolytic Graphite
ID:IG the ratio of intensity of the D and G peaks of the Raman spectrum
IPA 2-propanol
LPE Liquid Phase Exfoliation
m-CPBA meta-chloroperbenzoic acid
NMP N-methyl-pyrrolidinone
o-DCB o-dichlorobenzene
OER Oxygen Evolution Reaction
PABA para-aminobenzoic acid
PhIO Iodosobenzene
pXRD Powder X-Ray Diffraction
rGO Reduced graphene oxide
SEM Scanning Electron Microscopy
tBu-OOH Tert-butyl hydroperoxide
TGA Thermogravimetric Analysis
TGA-IR Coupled Thermogravimetric Analysis/Infrared Spectroscopy
TGA-MS Coupled Thermogravimetric Analysis/Mass Spectroscopy
TMDs Transition Metal Dichalcogenides
TPA Tris(2-pyridylmethyl)amine
UV-vis Ultraviolet and Visible Spectroscopy/Spectrophotometry
Chapter 1
Introduction
1.1
Overview
In the 14 years following the isolation of a single layer of graphite, graphene, by Novoselov
and Geim[1], the research field of ’two-dimensional’ (2D) materials has exploded to include
many different kinds of nanosheets of single or multiple atomic species. Two-dimensional
counterparts of bulk materials often display distinct or augmented properties from the parent
materials—for example, graphene displays remarkable thermal and electronic conductivity
compared to its insulating parent material graphite.[1]As the unique properties of 2D materials
become more evident, the study of these novel materials, their isolation and mass production
have dominated the field of materials science.[2–4]In time, the industrial use of 2D materials,
taking graphene as an example, is expected to rise exponentially. Applications requiring
lower quality graphene, developed using scalable and cheap preparation methods (such
as chemical exfoliation to graphene oxide (GO) and reduction to reduced GO (rGO) for
conductive inks) should appear first in the market, with applications dependent on higher
quality graphene, such as graphene sheets currently produced by chemical vapour deposition
Although much research has been conducted on how to produce graphene (and other 2D
materials) for industrial use, the toxicity or bioremediation of large amounts of graphene
or functionalised graphene is still an underdeveloped area.[6] As we are currently seeing
with plastics, and microplastics in particular, uncontrolled mass production and subsequent
disposal can lead to environmental problems down the road.[7, 8] To this end, this thesis will
expose graphene to a series of oxidants, oxygenating reagents, and metal-based oxidants
in an effort to learn more about the possible waste treatment methods or bioremediation
pathways for graphene once its use has become widespread.
Aside from isolating new materials, the idea of combining nanomaterials in order to
harness useful characteristics of both is also a growing field of research in its own right. In
preparation for a post-fossil fuel world, the search for alternative, clean sources of fuel have
centred on solar energy and the production of hydrogen, an energy-dense fuel that gives only
water as the product of its combustion.[9]This in turn leads to the search for cheap, abundant
materials that are capable of reducing the energy cost of producing hydrogen—i.e., materials
that catalyse the hydrogen evolution reaction (HER) step of water splitting. In this case,
transition metal dichalcogenides (TMDs) such as molybdenum disulfide (MoS2) and tungsten
disulfide (WSe2) have been identified as suitable HER catalysts with their 2D forms showing
increased HER activity.[10–12] Combining 2D MoS2with graphene has been proposed as
a method to increase the efficiency of the HER reaction by coupling the conductivity of
graphene with the catalytic activity of MoS2.[13] This thesis will test this, identifying the
best ratio of MoS2to graphene to use for potentially improved catalysis, as well as the effect
graphene produces in heterostructures composed of either phase of 2D MoS2. The interaction
of the two materials together in the heterostructures will be investigated in chemical terms
along with the potential effect graphene has on the HER activity of MoS2.
Re-stacking is one of the main problems encountered in the production of 2D materials.
1.2 2D Materials: Introduction to Graphene
large surface area generated by the exfoliation of layered materials to single or few-layer
components.[14] The use of non-covalently binding surfactants or intercalants, as well as
covalent functionalisation with organic or inorganic groups, are two of the most promising
ways to prevent re-stacking and prolong the life of 2D materials.[15, 16]The
functionalisa-tion of graphene is well-documented,[17–19] with the field of MoS2 functionalisation still
developing.[20] The formation of heterostructures using covalent means is in its infancy, and
in order to expand this, this thesis will deliver a method to covalently bind graphene and
MoS2for use in further applications. This will also be compared with the previously
pre-pared van der Waals heterostructures,i.e., heterostructures formed by the physical stacking
of different materials together.[21, 22]The effect the covalent bonding has on the HER activity
of the heterostructure will also be investigated.
In preparation for these discussions, this chapter will detail the characteristics, preparation,
reactivity and possible applications of two of these 2D materials: graphene and MoS2. It will
also touch on the insight expected to be gained over the studies presented in this thesis: the
reactivity of graphene towards highly reactive oxidants, the combination of graphene with
1T-MoS2and with 2H-MoS2forming heterostructures, and the novel linking of graphene to
1T-MoS2viafunctionalisation, with a view to producing efficient catalysts for the hydrogen
evolution reaction.
1.2
2D Materials: Introduction to Graphene
Graphene, first isolated in 2004 by Novoselovet al,[1]is a single sheet of graphite or sp2
-hybridised carbon, and is an allotrope of carbon. This unassuming material possesses the
highest electron mobility of any reported material and demonstrates metallic behaviour due
to its lack of a band gap, unlike its parent material graphite, which is well known as a soft,
electron cloud—the highly delocalisedπ electrons have extremely high mobility, in the range
of 250,000 cm2/ V s. Beyond this, graphene has the highest Young’s modulus measured to
date, 1 TPa, and extremely high thermal conductivity (5000 W m-1 K-1). As a result of the
degenerate electrons and holes present in pristine graphene, electrons can behave as massless
particles and travel without resistance within the graphene structure.[2]Shortly after it was
discovered, the properties of graphene attracted great interest for a range of applications;
its remarkable conductivity, the ballistic nature of electrons within its structure attracted
research into its use in transistors and conductive inks.[23, 24]Its transparency and its high
mechanical strength drew interest as a base for flexible electronics and displays[25, 26]and its
excellent chemical and thermal stability also predispose it for use as a protective coating for
reactive metal surfaces.[27]
The structure of graphene is well known—a single layer of graphite in the
thermo-dynamically favoured hexagonal crystal system. Due to its two-dimensional form, the simple
stacking order of the graphite crystal—ABABAB, etc., where A and B are carbon atoms
of one layer fixed in space, can be largely ignored (Figure 1.1).[2] Monolayer graphene
can be understood as comprising only of surface and possessing no bulk. This is partially
responsible for its increased reactivity compared to graphite. Few-layer graphene, or graphite
approaching graphene thinness, has intermediate properties between that of graphite and
graphene. Reports have shown the reactivity of bilayer, trilayer and multilayer graphene
decrease with layer number, so much so that above 11 layers, the properties of few-layer
graphene resemble that of bulk graphite.[28] The edges of a sheet of graphene, possessing
non-aromatic double bonds or bonds to heteroatoms, have in turn been shown to be more
reactive than the basal plane.[28] Two types of edges have been recognised in graphene:
armchair edges, which are aromatic, according to the rules of Clar’s aromatic sextet,[29] and
zig-zag edges, which have more instances of double bond character rather than aromaticity
1.3 2D Materials: Introduction to Transition Metal Dichalcogenides
oxygen or hydrogen. Armchair edges have been shown conclusively to react more readily
than zig-zag edges,[31, 32] and both are more reactive than the basal planes of graphene,
introducing an element of uncertainty into efforts to functionalise or modify graphene for
further use. Aside from the dangling bonds of its edges, the presence of ’π clouds’ above
and below the basal plane also allow modification or functionalisation to occur on either side
of graphene. The electron density of graphene precludes its reactivity as nucleophilic, and
indeed, many of the methods of modifying graphene rely on aromatic chemistry. In this way,
monolayer graphene can be seen as infinitely large polyaromatic molecule.[33]
Fig. 1.1 Ball-and-stick models of (a) graphite and (b) graphene. Grey = carbon, white = hydrogen-terminated edges.
1.3
2D Materials: Introduction to Transition Metal
Dichalco-genides
The isolation of graphene led to a materials version of a gold rush, as the search for other
minerals or atomic species that could be delaminated to form 2D nanosheets began in earnest.
In the years succeeding 2004, other 2D crystals were isolated and added to the growing
family of 2D materials: hexagonal boron nitride, isoelectronic to graphene,[34]other group 14
and bismuthene in 2017[36] from Group 15. 2D crystals based on the transition metals were
also isolated, including various transition metal dichalcogenides such as MoS2 in its 2H
phase in 2005,[37] quickly followed by others like WSe2.[38] These were joined in 2011 by
transition metal hydroxides such as Ni(OH)2[39] and MXenes, Ti3AlC2being an example of
this 60+ strong family.[40, 4]Each of these show distinct properties or enhanced abilities that
set them apart from the bulk material. One branch of this family that has attracted in depth
research are the various transition metal dichalcogenides as mentioned above. This is any
material that contains both a transition metal (most commonly from Group 6, but also from
Groups 4-7) and an element from Group 16, the chalcogens, in the empirical formula MX2,
where M is the metal and X is the chalcogen.[41]This introduction will concentrate on the
TMDs from Group 6 and 16, specifically MoS2.
Like graphite, TMDs are naturally abundant and so, inexpensive and readily available.
Unlike graphene and graphite, Group 6 TMDs are generally semi-conducting and possess an
indirect band gap. Upon delamination, this becomes a direct bandgap.[41]As with graphite,
weak van der Waals forces are all that bind each sheet of the material to the bulk along the Z
axis of the crystal. For MoS2, the TMD employed in this thesis, the material crystallises in
one of three different phases—1T (trigonal), 2H (hexagonal), and 3R (rhombohedral), with
two outer layers of S atoms and one inner layer of Mo atoms making one sheet three atoms
thick. Group 6 TMDs such as MoS2and WS2are found in nature in the 2H phase, in which
the chalcogens and metals of the material stack as AbA BaB. The 3R phase stacks as AbA
CaC BcB, where A, B and C are sulfur atoms, and a, b and c are molybdenum atoms, with a
and A,etc.overlapping on different planes. Once the material has been delaminated, both
2H and 3R possess the same structure and will be henceforth referred to as 2H, regardless
of the original bulk phase. The coordination environment of the Mo atom in the sheet is
trigonal prismatic in the 2H phase. The 1T phase is more common in Group 4 TMDs and has
1.4 Synthesis and Application of 2D Materials
ion (Figure 1.2). Group 6 TMDs can be ’forced’ into this metastable phase by introducing
intercalants, commonly Li+, into the material.[42, 43]By changing the phase of MoS2from
thermodynamically stable 2H to metastable 1T, the reactivity can be greatly enhanced.[44]
This has proven to be extremely useful for functionalisation[45] and further applications of
MoS2nanosheets, such as the increased activity of 1T-MoS2 as an electrocatalyst for the
hydrogen evolution reaction.[12]
(a) (b)
Fig. 1.2 Ball-and-stick models of monolayer (a) 1T-MoS2and (b) 2H-MoS2, showing side
on view and basal plane. Yellow = sulfur, cyan = molybdenum.
1.4
Synthesis and Application of 2D Materials
Graphene was initially producedviamechanical exfoliation, also known as micromechanical
cleavage—the ‘Scotch tape’ method,[1, 46]but several other techniques have been developed to
synthesise graphene from graphite, SiC or hydrocarbons. Shear or solvent exfoliation,[47, 48]
chemical or electrochemical exfoliation,[49] epitaxial growth by thermolysis of SiC on a
Cu/Ni substrate,[50] and chemical vapour deposition (CVD) of CH4onto a metal substrate[51]
As mentioned, the first method by which graphene was obtained was viamechanical
exfoliation of graphite, in which thin flakes of graphite are removed from the parent graphite
using sticky tape and are deposited on a suitable substrate. This process is then repeated until
the thickness approaches that of a few nm, but this is a slow and low-yielding process.[52]
Other problems occur in ensuring the complete removal of tape residue from the graphene, a
problem similarly encountered in surfactant stabilised exfoliation—this residue can
compro-mise the otherwise pristine nature of the graphene.[1]CVD and its related process, epitaxial
growth, give the highest quality monolayer graphene, through the deposition of carbon onto
Cu or Ni. These metals act as catalysts for the thermolysis of the carbon source, usually
a hydrocarbon, as well as a support. However, CVD is time-consuming, expensive and
although the graphene is pristine, it is low yielding. In reactivity studies concerning the effect
of reactants or substrates on a single sheet of graphene, CVD graphene or epitaxial graphene
grown on Si is frequently used.[53, 51]
Liquid phase exfoliation, by sonic or shear methods, were used to prepare graphene
in this project (Figure 1.3). Initially, liquid phase or solvent exfoliation involved only
ultrasonication, in which the sheets are blasted apart by sound energy, of the graphite
source for long periods in stabilising solvents.[48] Later, a second form of liquid phase
exfoliation was developed that uses high shear forces to overcome the attractive forces
between sheets, generated by rapid mixing.[47] For ultrasonic and shear exfoliation, larger,
unexfoliated graphite particles are then removed from the dispersion by centrifugation. A
suitable solvent, which possesses a surface energy similar to that of the graphene sheets
is also required to impede re-aggregation for ultrasonic and shear exfoliated graphene.[54]
Aside from production problems, in dispersion, graphene readily re-aggregates to graphite
without the presence of a support, intercalant or surfactant, and its hydrophobicity renders
chemistry in water or other polar organic solvents difficult. Only a handful of solvents
1.4 Synthesis and Application of 2D Materials
time—N-methyl-pyrrolidone, (NMP) dimethylformamide, (DMF) and o-dichlorobenzene
(o-DCB) to name the most common.[48]These solvents are potentially toxic and the former
two are suspected of reproductive toxicity in mammalian females.[55]It is possible to prepare
graphene in different solvents through the use of surfactants such as sodium cholate and
sodium dodecyl sulfate, or other intercalants which cover the graphene sheets or intercalate
into the graphite lattice to aid exfoliation or limit re-aggregation. However, for the deposition
of films or further reaction of the graphene dispersion, the surfactants must be removed
entirely. This presents a new challenge as many surfactants adsorb strongly on the graphene
surface and can be difficult to remove by washing alone.[56]Graphene has also been prepared
viaball milling, in which the shear forces necessary for exfoliation come from the impact
and attrition of the steel balls in a rotating grinder on bulk graphite. These exfoliate the
graphite to smaller and thinner sheets, though some damage is introduced as monitored by
the growth of the ratio of intensity of the D and G peaks (ID:IG) in the Raman spectrum. To
minimise this, smaller aromatic molecules are included in the milling process as buffering
materials.[57]
By far the most common form of chemical exfoliation involves the oxidation of graphite to
GOviaHummer’s method,[58]which involves excessive oxidation of graphite and subsequent
exfoliation to GO. This is achieved by reaction of bulk graphite with KMnO4in the presence
of H2SO4, refluxing in water, with treatment of the filtrate with H2O2giving graphite oxide.
Sonication of this in water yields graphene oxide (GO). GO can then be mostly reduced
by reductants such as hydrazine to rGO. This procedure gives good synthetic yields and
dispersions of GO/rGO contain a high percentage of mono- and bilayer sheets, as well as
being dispersible in hydrophilic solvents. However, GO production can also be seen as
an extreme version of graphite functionalisation; excessive oxidation greatly reduces the
intrinsic properties of graphene that make it so desirable, and reduction cannot remove 100%
The intercalation of graphite by Na/K, accomplished by stirring graphite and Na/K alloy
in 1,2-dimethoxyethane under an argon atmosphere for several days, has been extensively
employed by the Hirsch group in the production of functionalised graphene from graphite
without the need for prior exfoliation. The addition of further reactants to this negatively
charged ’graphenide’, such as diazonium salts[60] or iodoalkyl species[18] facilitates and
sustains exfoliation of the individual graphene sheets by functionalising either side of the
basal plane and preventing re-aggregationviasteric hindrance. The graphene produced by
this method is very reactive, and therefore is used for immediate functionalisation—it would
be unsuitable for applications that require pristine, inert graphene.
Potential applications for graphene, once it can be exfoliated cheaply and in good yield,
are numerous. The most popular of the applications currently being developed include the
use of graphene as a sensor or drug delivery agent in biomedicine,[6]as the major component
of conductive inks for printing small devices,[61, 23]as a replacement for indium tin oxide in
flexible displays and touchscreens,[62]in organic light-emitting diodes (OLEDs),[63]and other
devices previously dominated by silicon.[5]However, major drawbacks to the widespread
use of graphene lie in its hydrophobic nature and tendency to re-aggregate to graphite, which
makes it difficult to mass-produce and tune its properties to specific applications.[3]Despite
these drawbacks, research into graphene continues to grow and many believe it is only a
matter of time before graphene use becomes widespread. This raises its own concerns about
the possible effects of graphene or more reactive functionalised graphene on organisms and
the environment, were they to be produced and released into the environment on an industrial
scale. This concern forms the basis of one of the studies described in this thesis—the effect
of the Fenton reagent, used in water treatment,[64]and two biomimetic catalysts, based on
enzymes in soil bacteria, on graphene.
MoS2has been producedviamany of the same methods as graphene. The first dispersion
1.4 Synthesis and Application of 2D Materials
Fig. 1.3 The liquid phase exfoliation of graphite or 2H-MoS2by sonication to a dispersion of
few-layer nanosheets.
Morrisonet al[43]chemically exfoliated MoS2to single layers by intercalation with lithium
in 1986, 18 years before the isolation of monolayer graphene. This method is now widely
used to produce aqueous monolayer dispersions of MoS2, up to 70% of which is in the
1T-phase (Figure 1.4). The source of the lithium is normally n-BuLi, and bulk MoS2 is
stirred in a solution of n-BuLi in n-hexane for several days under an inert atmosphere at
room temperature. The intercalated powder is then isolated by filtration and exfoliated by
sonication in water. The product of this is known as chemically exfoliated 1T-MoS2
(ce-1T-MoS2). Modifications to this method have included electrochemically intercalating Li ions
under ambient conditions, using a lithium salt in non-aqueous media and a MoS2cathode,[65]
and heating the combination of n-BuLi and MoS2to reflux for 6–48 h.[66, 67]Liquid phase
exfoliation methods have also been shown to work for the preparation of dispersions of
2H-MoS2. The inclusion of a preliminary sonication and centrifuging step at high rpm is
included to remove residual inorganic salts. Because of its lower surface energy, MoS2can
be dispersed in alcohols such as 2-propanol (IPA) for long periods of time. Dispersibility in
such as NMP and DMF gives the production of two-dimensional MoS2 via liquid phase
exfoliation some advantage over graphene.[48, 68]
Two-dimensional MoS2or MoS2nanoparticles can also be produced from ammonium
molybdenite salts ((NH4)2.MoS4for example) subjected to high pressure and temperature
(200–450 °C) in an autoclave. The ammonium salt is exposed to air at high temperature and
converted to MoO3, which is in turn treated with thiourea in similar hydrothermal conditions
to form MoS2.[69] This produces very small flakes or clusters of MoS2, and is also used
for growing MoS2 on other nanomaterials or supports, and to produce defect-rich MoS2
for improved catalytic activity.[70] Molybdenum oxides (mostly MoO3) are also used when
producing sheets of MoS2for chemical vapour deposition. MoO3is treated with a flow of
sulfur gas, forming large, low-defect structures known as MoS2 triangles. The thickness,
monolayer to bi- or trilayer,etc., can be controlled by the gas flow.[71–73]
Fig. 1.4 n-BuLi mediated chemical exfoliation of bulk 2H-MoS2to monolayer 1T-MoS2.
For MoS2, application development centres on its capacity for lithium ion storage for
lithium-ion batteries, particularly when combined with conductive graphene.[74] Its direct
bandgap gives it an advantage over graphene in electronic applications such as small
de-vices and transistors, and the photoluminescence associated with this bandgap holds great
potential for the development of solar cells, LEDs, and other optoelectronic devices.[75–77]
Its well-documented HER activity would be incredibly useful in a future hydrogen-powered
1.5 Application: Hydrogen Evolution Reaction
1.5
Application: Hydrogen Evolution Reaction
Hydrogen has long been touted as a fuel for a greener future.[9] The hydrogen evolution
reaction is a half reaction of water splitting, the other half of which is oxygen evolution.[10]
The half-equations for hydrogen and oxygen production, (1.1) and (1.2) respectively, as well
as the full equation (1.3) are shown below:
2 H++2 e−−−→H2 (1.1)
O2− −−→1
2O2+2 e
−
(1.2)
H2O−−→H2+
1
2O2 (1.3)
However, the energy required to produce hydrogen from its most abundant source, water, is
extremely high and must first be overcome before hydrogen can seriously be considered for
widespread use. The electrolysis of water requires at least 237 kJ per mole, which would only
produce 2 g of H2.[79] Years of research and investigation have been dedicated to developing
electrocatalysts for both hydrogen evolution and oxygen evolution, in an effort to bypass
this large activation energy. By far the best HER catalyst known to date is the noble metal
Pt, which possesses a Gibbs free energy change of≈0 eV for the adsorption of hydrogen
atoms to its surface.[11]This characteristic has since become a prerequisite for a good HER
catalyst—in order to form a hydrogen molecule, protons must be able to adsorb to the surface
and stay there long enough to come in contact with either other adsorbed protons or protons
in solution. They must also be able to overcome the energy barrier to desorption easily.
The small change in Gibbs’ energy afford by Pt facilitates both of these steps, by adsorbing
hydrogen strongly enough to allow it come in contact with other hydrogen atoms and to be
it can quickly desorb, freeing the Pt surface sites for more hydrogen to adsorb. To use a
Goldilocks analogy, hydrogen atoms are neither adsorbed too weakly or too strongly, but
’just right’ for hydrogen evolution to occur.[80]
The hydrogen evolution half-equation can be expanded into two steps, adsorption of
protons on the surface and the desorption of hydrogen from the catalyst. Either of these
steps can be rate-limiting depending on the∆GH. The former is known as the Volmer step
(equation 1.4 or 1.5 below) and the latter as the Heyrovsky or Tafel step (equation 1.6).
H+(aq) +e−(m)−−→H•(ads) (1.4)
H•(ads) +H+(aq) +e−(m)−−→H2(g) (1.5)
H•(ads) +H•(ads)−−→H2(g) (1.6)
It was demonstrated by Nørskovet al,[81] using DFT calculations, that the exchange current
density of a material is directly related to Gibbs free energy for the adsorbed hydrogen
atom. The Gibbs free energy for hydrogen adsorption on Pt is∆GH ≈0, and hence, it is
an excellent electrocatalyst for HER, with a negligible overpotential compared to RHE and
a Tafel slope of 60 mV/dec in 0.1 M HClO4.[82] However, industrial level usage of Pt for
hydrogen production is prohibitively expensive, and so, the search continues for a cheaper
catalyst. Other materials that have demonstrated HER activity have∆GHeither greater or
less than zero (i.e., the energy of the products and of the reagents are not similar), and this
has different effects on the rate of the reaction. Nørskovet al[81] also demonstrated that the
edges, defects, and steps of MoS2were active for HER catalysis due to the concentration of
unsaturated bonds in these environments. If the bond between the hydrogen atom and the
catalyst is too weak (i.e.,∆GH> 0), the Volmer step is rate limiting. This is observed when
1.6 Combining 2D Materials: Heterostructures
a Tafel slope of 40 mV/dec in 0.5 M H2SO4).[83]The Heyrovsky step becomes rate-limiting
if the bond between the catalyst and the adsorbed hydrogen is too strong (∆GH< 0), leading
to overpotentials of -620 mV and Tafel slopes of 152 mV/dec for example,[84] in bulk MoS2
catalysts.[11]
The Group 6 TMDs have attracted a lot of attention since Jaramilloet al[78] discovered
the HER activity at the edges of bulk MoS2. MoSe2, WS2, and WSe2 have since been
investigated, with MoSe2purported to be the most active. Most of this research however
has centred on MoS2as the most abundant of these naturally occurring, cheap alternative
catalysts.[80]The active sites and mechanism of HER on MoS2took several years to elucidate.
From the results of a detailed report on edge passivation, the edges of bulk MoS2 was
discovered to be active towards HER, with the basal plane not showing any noticeable
activity.[85]However, it was discovered by Jinet al[12]and Chhwallaet al[83]independently
in 2013 that the octahedral 1T phase of MoS2 showed greatly increased activity towards
HER, with both edges and basal plane active towards hydrogen. This then became a hot area
of research, with much of HER research on MoS2concentrating on the 1T-phase.[12, 10]
1.6
Combining 2D Materials: Heterostructures
One of the drawbacks of using MoS2as a catalyst for HER, particularly the 2H phase, is
its lack of conductivity.[78] Attempts to address this have included combining both MoS2
and graphene into composites or heterostructures.[21, 22] However, there are many other
reasons why TMDs such as MoS2 have been employed together with graphene as
com-posites or heterostructures—they have been tested for applications such as components in
lithium/sodium batteries, sensors and hydrogen storage as detailed below.[74, 86, 9] These
are usually prepared via hydrothermal or solution based syntheses,[87–89] derivatives of
exfoliated materials.[56] Most commonly, these heterostructures, as 2D films, 3D foams or
particles[91, 92]are used in applications where not only conductivity, but strength and
cat-alytic activity are required: employing MoS2-graphene hybrids can yield materials with the
catalytic activity of MoS2towards hydrogen evolution,[93, 13]and its semiconducting nature
for transistors and information storage,[94] coupled with the robust, inert, and conductive
nature of graphene.[2]Aside from these, they have found applications as anode materials for
lithium or sodium ion batteries[86, 74]and as sensors for small organics.[88]
The field of MoS2/graphene heterostructures has been dominated by Van der Waals or
other non-covalent interactions in the preparation of heterostructures. The most common
of these methods involve chemical vapour co-deposition of graphene on MoS2 or vice
versa,[95, 96]hydrothermal/solvothermal synthesis of GO together with precursor salts such
as MoO3/NaS2 or (NH4)2MoS4[13, 22] and the use of GO or rGO in the place of pristine
graphene. Interactions between TMDs such as MoS2and graphene, while noted,[56, 97–100]
have been addressed in purely physical terms in the literature. In-depth chemical analysis is
lacking, despite the significant volume of published research combining the two materials as
devices, supports, and catalysts for a wide range of applications as mentioned. Much of the
research approached from a chemistry viewpoint is limited to GO or rGO as a conducting
base for MoS2in applications such as HER.[101]This greatly aids heterostructure formation
as GO and its corresponding reduced product, rGO, are easily dispersed in water and other
accessible solvents that can also disperse MoS2successfully.[102] However, GO and rGO
can be poor quality substitutes for pristine graphene. Significant defects are formed during
oxidation, and reduction often cannot heal holes or remove all oxygenated groups in the
structure of rGO.[101, 103] Therefore, this thesis aims to further the understanding of the
interaction of both 2H-MoS2and 1T-MoS2with graphene during the preparation and use of
1.7 Functionalisation of Graphene and TMDs
Aside from this, reports detailing the covalent linking of graphene and MoS2are few.
As described above, most heterostructures are prepared by mixing layers of different
mate-rials, or the concerted hydrothermal synthesis of both materials together to facilitate close
interaction.[97, 13]The formation of a covalently linked heterostructure was published by Rao
et al[21] in 2016 and utilised Sonogashira coupling (using a Pd(0) catalyst, CuI cocatalyst
and triethyl amine (TEA) in 140°C DMF) between sheets of iodobenzene functionalised
MoS2and iodobenzene functionalised rGO.The heterostructure formed displayed high CO2
adsorption properties, and they used the same chemistry to create 3D assemblies of MoS2
which showed enhanced HER activity. The assemblies were then characterised by XPS,
Raman spectroscopy, ATR-IR, solid state C13-MAS NMR, pXRD and HR-TEM. Other
studies into the covalent linking of graphene or other main group 2D materials and TMDs are
mostly computational, as in Kaxiras’ 2017 study of ’lateral heterojunctions’ of these materials
i.e., where materials are covalently joined together at the edges.[104] Therefore this thesis
will unveil further possibilities for forming covalently linked structures by functionalising
both pristine graphene and ce-1T-MoS2, and creating a link between the materials based
on the reaction of these functional groups. Functionalisation in this way will not only help
to prevent re-stacking of the materials but could also increase the hydrophobicity of the
materials (particularly graphene) through the use of oxygen-containing groups, allowing
them to interact more easily.
1.7
Functionalisation of Graphene and TMDs
As demonstrated earlier, well exfoliated, pristine graphene is notoriously hard to produce en
masse, and its lack of dispersibility in polar solvents limits its potential for industry-scale
production and applications. The use of toxic solvents and energy-intensive processes such
1.7 Functionalisation of Graphene and TMDs
production of graphene. The most common way to aid the dispersibility of graphene in polar
solvents such as water is through functionalisation of the graphene surface. This involves the
introduction of functional groups onto the graphene basal plane and the edges. Hydrophilic
groups such as hydroxy, epoxy, amino, and carbonyl groups facilitate the dispersibility of
graphene in water by forming hydrogen bonds with the solvent. Their presence also disrupts
theπnetwork of graphene, opening a band gap in the structure, and prevents reaggregation,
thereby countering the main problems holding back mass graphene production.[17] Figure
1.5 shows a summary of the main pathways of graphene functionalisation.
The widespread use of GO as a graphene base in the literature because of its ease of
production and dispersibility in polar solvents is a testament to this. However, GO itself has
severely reduced thermal and electronic conductivity, as well as a larger band gap compared
to pristine graphene, and the loss of these properties precludes GO from becoming the basis
of industrial-level production of graphene.[105] Because of this, much research has been
dedicated to developing milder or more selective forms of functionalising graphene. Aside
from increasing the dispersibility and impeding or preventing the re-aggregation of exfoliated
graphene, selective graphene functionalisation can also tune the properties of graphene to
suit various applications such as in field-effect transistors, supports for biosensors, inkjet
printing, and graphene/carbon papers and coatings. For these reasons, graphene reactivity
has been studied in depth and several reactivity methods have come to light in the last 14
years.[106, 17]
Though the parent material graphite is known to be quite inert, graphene, particularly
monolayer graphene, has been shown to undergo attack by sufficiently reactive species.[105]
Graphite treated with KMnO4, H2SO4, NaNO3and H2O2produces graphite oxide, a
yellow-ish powder that is easily dispersed in water or other polar solvents to form GO, as mentioned
above. Although the exact nature of the functional groups on GO is still debated, it is believed
epoxides.[59]Hole formation has also been reported on the basal plane, and the combination of physical holes and high concentration of functionalities, while rendering GO much easier
to produce and store in dispersion than graphene, takes a large toll on the very properties
that aroused interest in graphene originally.[59, 2]To combat this, GO can also be reducedvia
hydrazine, hydrogen iodide, ascorbic acid or strong heating to rGO, that somewhat reinstates
the semimetallic nature and excellent mobility of graphene. However, while regaining a lot
of its original structure, reduction is not perfect and cannot heal holes in the basal plane, the
main cause of damage to the electron cloud network.[107]
Milder forms of functionalisation have been rigorously investigated and graphene has
been found to react with radicals, undergo cycloadditions, take part in Friedel-Crafts reactions
(similar to other aromatic systems) and facilitate reduction/oxidation cycles, either as a
catalyst or a substrate itself.[105, 106]In these types of reactions, graphene can be seen almost
as an extended polyaromatic or conjugated system that readily undergoes aromatic reactions.
Also interesting is the redox activity of graphene, as it easily gains or loses electrons to
substances such as alkali metals and diazonium salts, and has been reported to aid the redox
activity of catalytic nanoparticles.[108]
The hydrogenation of graphene, as a form of functionalisation, stems from an attempt
to convert graphene into ’graphane’, i.e. fully hydrogenated graphene. Over a decade,
several methods of hydrogenation have been employed with varying degrees of success and
therefore, differing levels of hydrogen functionalisation of graphene.[109] A popular form
of hydrogenation is exposing graphene from a variety of sources to a hydrogen atmosphere
at either very low pressures (2 mbar) to very high (100 bar) for at least 2 hr. Annealing at
temperatures above 450°C converted hydrogenated graphene back to pristine graphene.[110]
Another method of hydrogenation employed is Birch reduction, a radical-based technique
used for reducing aromatic species such as benzene to an unconjugated cyclohexadiene.[111]
1.7 Functionalisation of Graphene and TMDs
The best results have been obtained using graphite rather than graphene, Na, and liquid
NH3 with tBu-OH.[112] Another method for producing hydrogenated graphene includes
plasma-assisted chemical vapour deposition using a plasma beam of methyl radicals and
atomic hydrogen. However, none of these techniques have generated graphane, with the
highest weight % of hydrogen measured in hydrogenated graphene at 5% compared to a
theoretical total of 7.7% for graphane.[113]
The use of radical chemistry on graphene has also been employed for the creation of C-C
bonds and incorporating fluorine and hydroxyl groups into graphene. Graphene monofluoride
or fluorinated graphene, has received almost as much attention as graphane for its potential in
applications—unlike graphene and graphane, it is an insulator with a much greater band gap
(3.0 eV) than its other carbon-based cousins.[114]The complete fluorination of graphene has
already been reported and the chemistry of fluorinating carbon species is not new, pathways
to fluorinated graphite, fullerenes, and CNTs have been known for decades.[115]Fluorinated
graphene had been attempted previously by treating graphite with F2gas at high T (400–
600°C) or with F-based plasma.[116]These harsh conditions can etch graphene, so a milder
route through treatment of graphene with XeF2 was established by Robinson et al.[115]
A Si etchant, XeF2had been shown to functionalise CNTs, and was successfully used to
functionalise graphene to C4F or 25% fluorine coverage. Stoichiometric fluorographene has
been produced from carbon monofluoride, the product of the reaction of graphite to F2gas at
high temperatures, with subsequent liquid phase exfoliation in solvents such as IPA[117]and
sulfolane[118]giving the corresponding 2D material.
Aside from the introduction of heteroatoms into the graphene structureviathe formation
of GO, hydrogenation or fluorination of graphene, many other methods of functionalisation
result in the formation of new C-C bonds to graphene. Radical chemistry has been mentioned
previously in the case of Birch reduction of graphene, which proceedsviathe generation of
rely on radical chemistry include the use of carbenes, nitrenes, phenyl and alkyl iodides, and
diazonium salts on graphene.[105, 106, 17]
In particular, Hirsch’s group has developed a method of exfoliation of graphene that
also facilitates extensive functionalisation by a variety of substrates via a radical
mecha-nism. The functionalisation of graphene with diazonium salts has been known since 2009,
with Tour’s group showing the functionalisation of graphene nanoribbons from CNTs in
2009[119, 120]using nitro-substituted benzenediazonium salts, but the most comprehensive report is from Hirsch’s group, which details the diazonium functionalisation of graphene by
combining diazonium salts with ’graphenide’—negatively charged graphite produced from
graphite treated with NaK alloy in 1,2-dimethoxyethane under Ar.[60]The reduction of the
graphite sheets by solvated electrons and the intercalation of potassium cations facilitated
exfoliation and the repulsion generated by the reduction ensured that the dispersed sheets
were prevented from re-aggregating. To this, they added excess 4-tert-butylphenyldiazonium
chloride or 4-sulfonylphenyldiazonium chloride and characterised the resultant graphene
with a host of spectroscopy techniques. This was then adopted by several other groups
and later reports expanded this method of functionalisation of graphene to include epitaxial
graphene,[121]rGO,[122]and liquid exfoliated graphene.[123] Graphenide was also used as
an intermediate towards graphene functionalised with a series of electrophilic phenyl and
alkyl iodides and hypervalent iodine-containing compounds such as
bis(4-(tert-butyl)phenyl)-iodonium hexafluorophosphate.[124] Negatively charged graphenide was generated from
natural graphite, synthetic graphite and from CVD graphene, all of which showed evidence of
functionalisation by statistical Raman spectroscopy and coupled thermogravimetric
analysis-mass spectroscopy when exposed to the chosen electrophiles, showcasing the versatility of
this functionalisation method.[125]
Functionalisation methods, similarly to Birch reduction, can also come from established