Using Confusion Graphs to Understand Classifier Error
Davis Yoshida and Jordan Boyd-Graber
[email protected], [email protected]
Abstract
Understanding the nature of the errors of a machine learning system is often difficult for multiclass classification problems with a large number of classes. This is true even more so if the number of examples for each class is low. To interpret the performance of a mul-ticlass classifier, we form a graph represent-ing the errors, and use average-link clusterrepresent-ing to find groups of classes which are confused with each other. We apply this idea to the QANTA question answering system (Iyyer et al., 2014), and provide a method of analysis of the clusters.
1 Introduction
A typical development process for a machine learn-ing pipeline involves many iterations of error anal-ysis, and changes to each step of the pipeline. One of the most common tools for understanding the er-rors of multiclass classifiers is a confusion matrix. If, however, the number of classes is very large rela-tive to the number of samples, the confusion matrix will be both large and sparse. This is problematic for error analysis, because adding a feature which reduces the confusion between two classes amounts to decreasing the overall error by a tiny increment. If the error is attacked on a class by class basis, the process will be both very lengthy and result in fea-tures which may not discriminate between any pairs of classes other than the one they were created for. While it is certainly possible to engineer features which are widely useful, it would be beneficial to do so this both consistently and quickly.
One example of a multiclass classification system with a large number of classes is QANTA, a factoid question answering system. QANTA is designed to play the Quiz Bowl trivia game, in which players are given questions word by word, and want to answer the question correctly as early as possible. Since the number of answers QANTA is trained on is finite, it can be viewed as a multiclass classifier with a large number of classes. For any given pair of answers, it is highly unlikely that there are more than a few questions for which the system confused one answer with the other. This makes QANTA a perfect ex-ample of a multiclass classifier which has a sparse confusion matrix. To better analyze the errors com-mitted by the system we form a confusion graph for each of three subsets of our data. The construction of these graphs and some of their interesting proper-ties are discussed in Section 2.
In Section 3, we discuss the use of average-link agglomerative clustering to find clusters of answers which are highly confused with each other on a val-idation set.
In Section 4, we apply the Autoslog system (Riloff, 1996) to each cluster to find find textual fea-tures which occur frequently in each cluster.
2 The Confusion Graph
After training QANTA, we use the errors it commits on a validation set to form the confusion graph. In this graph, the vertices are answers (classes), and the undirected weighted edges represent errors. Specif-ically, an edge(u, v)with weightwmeans that the fraction of questions havinguas their correct answer while the system predicted v, or vice versa, is w.
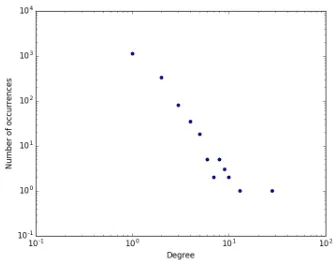
(a) Degree distribution for main validation set (b) Degree distribution for secondary validation set
[image:2.612.335.502.69.199.2](c) Degree distribution for test set
Figure 1: Degree Distributions for confusion graphs. In these graphs the vertices are classes and the edges are misclassifications made by QANTA.
In order to simplify computation, the graph includes only answers that were confused with at least one other, as the rest would just be isolated vertices. We built these graphs for two of our validation sets, and our test set. The question/answer data that comprises these sets is unfortunately proprietary, so we cannot show examples of question/answer pairs here. Refer to the paper (Iyyer et al., 2014) for an example.
2.1 The Giant Component
Recall that our goal is to form groups of answers that are highly confused with each other. An op-timistic plan would be to simply find the compo-nents of the graph, and split each one into a pair of clusters. Unfortunately, it turns out that QANTA’s confusion graph for the primary validation set has very few components. Specifically, 4032 of the 4091 nodes in the graph are in a single, large component.
The reason for the emergence of a giant compo-nent is that there are certain answers (vertices) that have extremely high degrees, i.e. the degree
distri-bution of these graphs is heavy-tailed. The degree distributions of each graph are shown in Figure 1. The existence of these high degree nodes leads to connectivity between seemingly very different an-swers.
For example, in the validation set, the most con-fused answer was the play: Angels in America: A Gay Fantasia on National Themes. It was confused with 131 different answers ranging from the number eight, to Milk, to ASCII. This shows that the errors made on this validation set did not solely include an-swers that are very similar.
2.2 Diameter and Neighborhoods
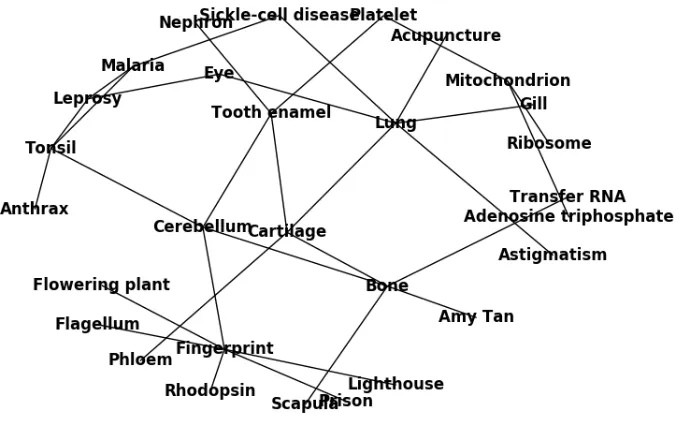
Figure 2: Answers within a short distance of the answer ”Ribosome” where edges represent QANTA an-swering one when the other should be answered.
is a distance of 14 away from the novelRagtime, via the path:
Ribosome → Mitochondrion → Platelet → Tooth enamel → Cartilage → Lung → Acupuncture →
Yoga → Caste system in India → Jacques Cartier
→HMS Beagle→Thor Heyerdahl→ Ragtime→
Ragtime (novel).
So at least one question that should have been an-swered Ribosome was anan-swered as Mitochondrion (or vice versa), the same for Mitochondrion and Platelet, and so on. This is a very characteristic ex-ample of the paths connecting exex-amples. Typically, most of the errors are between related answers, but there will be some jump which switches the topic abruptly. Here, the first few answers in the path are biology related, Acupuncture is used as a medical treatment, and yoga comes from India. The connec-tions Caste System in India→ Jacques Cartier and Thor Heyerdahl → Ragtime, however, are not ex-pected.
A subgraph of the confusion graph, consisting of all nodes within a distance of 6 from Ribosome is shown in Figure 2. Aside from for some exceptions
at maximal distance (e.g. Lighthouse and Amy Tan), all of the nodes are biology related.
The neighborhood of the answer Bessel Function is shown in Figure 3. Note that here is an overlap with the previous neighborhood via the node Astig-matism. In this neighborhood we see a small bunch of computing and mathematical terms, as well as some whose presences again escape an immediate explanation (e.g. Bhagavad Gita).
This exploration hints that although the graph is essentially one component there are clusters of re-lated answers which are confused with each other
3 Clustering Classes
We would like to find clusters of related answers, as in the previous section, but in an algorithmic way. To this end, we run average linkage agglomerative clustering (Murtagh, 1983) on the graph, using the weights defined in the previous section.
Average-link clustering on a confusion graph pro-ceeds by first initializing a singleton cluster for each class. Then, at each step, the two clusters,Ci, Cjare
Figure 3: Answers within a short distance of the answer ”Ribosome” where edges represent QANTA an-swering one when the other should be answered.
between them, i.e.:
i, j= argmax i,j
1
|Ci||Cj| X
u∈Ci
X
v∈Cj
w(u, v)
where w(u, v) is the weight of the edge (u, v)
if it exists, or 0 otherwise. These clusters are then merged into a single cluster, and the process is repeated until all nodes are in a single cluster. There are 4091 nodes in the graph, so there will be 4090 joining steps. Average-linkage clustering isO(N2log(N)), so this computation will become
difficult for much larger class sets.
In the context of a confusion graph, two clusters being merged indicates that the classes in the clus-ters are highly confused. In order to understand our errors better, we examine these clusters. It turns out that many of them are a single answer being added to a larger cluster. To filter out these, we only look at pairs of at least a minimum size, sand having a maximum difference ofd, i.e. Ci andCj such that min(|Ci|,|Cj|)≥sand||Ci| − |Cj|| ≤d.
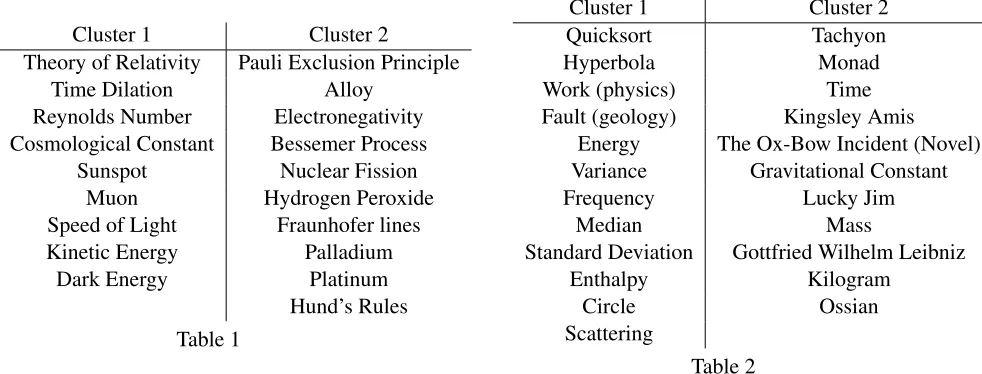
When s = 8 andd = 1, we found 46 pairs of clusters. Examples are shown in Tables 1 and 2.
Cluster 1 of Table 1 seems highly related to high energy physics and cosmology, whereas Cluster 2, while similar looks related to a different branch of physics with a dash of chemistry. Cluster 1 of Table 2 has many quantities (e.g. energy and enthalpy), with a few other technical terms thrown in. Clus-ter 2 has a few units and technical Clus-terms, but also Leibniz, who is understandably related to science. Unlike the previous cluster pair, there are also some totally unrelated classes: the author Kingsley Amis and his novelLucky Jim, and the novelThe Ox-Bow Incident.
Some clusters fail to be remotely interpretable, but a large number are of similar quality to the ones shown here: Largely related, with a few outliers thrown in. These clusters give us a tractable way of interpreting the confusion of our classifier.
4 Cluster Analysis with Autoslog
Cluster 1 Cluster 2
Theory of Relativity Pauli Exclusion Principle Time Dilation Alloy
Reynolds Number Electronegativity Cosmological Constant Bessemer Process
Sunspot Nuclear Fission Muon Hydrogen Peroxide Speed of Light Fraunhofer lines Kinetic Energy Palladium
[image:5.612.73.564.63.250.2]Dark Energy Platinum Hund’s Rules Table 1
Cluster 1 Cluster 2 Quicksort Tachyon
Hyperbola Monad
Work (physics) Time Fault (geology) Kingsley Amis
Energy The Ox-Bow Incident (Novel) Variance Gravitational Constant Frequency Lucky Jim
Median Mass
Standard Deviation Gottfried Wilhelm Leibniz Enthalpy Kilogram
Circle Ossian
Scattering
Table 2 Clusters of answers which QANTA confuses with each other often.
we use the set of questions mapping to an answer in the cluster as a corpus, and run Autoslog on it. We then filter to patterns which occur much more frequently in that correspond to one set of questions but not the other.
For example, in Cluster 1 of Table 1, the pat-tern “[Verb phrase: be] [Adjective Phrase: equal]” was found. It matches any verb phrase with the root verb of “to be” followed by an adjective phrase with the root of “equal”. This pattern should match statements about the various constants and quantities found in the cluster.
For another pair of clusters in which one is com-posed mostly of nations and locations, and the other is mostly chemicals, we find the patterns “[Noun phrase: capital] of” and “[Noun phrase: Nation] with”. However, the pattern “[Verb phrase: Named] for” occurs about equally as much in each cluster. Such patterns may be part of what contributes to the classifier confusing the clusters.
5 Future Work
We have developed and examined confusion graphs for our classifier, but not yet applied them to im-proving its performance. We would like to add the patterns found by Autoslog as features for QANTA, and evaluate its increase in performance. If this is successful, we can again build a confusion graph, find patterns and add them as features, and repeat the process. This is a sort of automatic feature
engi-neering. How much performance improvement we can get out of this method is an open question.
6 Conclusion
Confusion graphs can help us understand the nature of the errors occurring in a classifier when the num-ber of classes is very large. We have applied this to examine the errors of the question answering sys-tem, QANTA. From the graph, we derive clusters of answers which are easily confused, and find textual features which discriminate between the clusters.
References
Mohit Iyyer, Jordan Boyd-Graber, Leonardo Claudino, Richard Socher, and Hal Daum´e III. 2014. A neu-ral network for factoid question answering over para-graphs. In Empirical Methods in Natural Language Processing.
Fionn Murtagh. 1983. A survey of recent advances in hi-erarchical clustering algorithms. The Computer Jour-nal, 26(4):354–359.