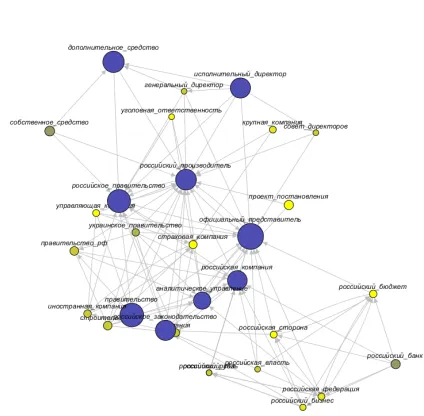
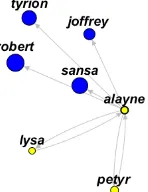
Visualization of Dynamic Reference Graphs
Full text
Figure
Related documents
Because it's warm in Hawaii year-round, most Hawaiian homes don’t have fireplaces, so kids hang their stockings.. anywhere Mom will
Researchers have proposed, the fact that mutations in the UGT1A1 gene disrupts the normal conjugation mechanism of bilirubin and thus causes Crigler-Najjar
According to EcoDistricts (2016), a food desert is a community with more than 20 percent of residents living below the poverty threshold and at least 33 percent of the population
We introduce a natural parameter in the game of Cops and Robbers, the damage number of a graph, which is the minimum number of distinct vertices the robbers can visit without
The Canada Pension Plan is a national public insurance program that provides income pro- tection to workers in the event of a long-term interruption of earnings resulting
The personal agent, representing the user in the system, has the following tasks: (i) interpret the ontology and transform it into a structure that can be used in the AHP
This ethnographic study examines the social effects of the introduction of an enterprise-level quality control program (CMMI) on professional engineers in a complex
