Proceedings of the Workshop on Multilingual and Cross-lingual Methods in NLP, pages 65–74,
Comparing Fifty Natural Languages and Twelve Genetic Languages Using
Word Embedding Language Divergence (WELD) as a Quantitative Measure
of Language Distance
Ehsaneddin Asgari and Mohammad R.K. Mofrad
Departments of Bioengineering University of California, Berkeley
Berkeley, CA 94720, USA
[email protected], [email protected]
Abstract
We introduce a new measure of distance be-tween languages based on word embedding, called word embedding language divergence (WELD). WELD is defined as divergence be-tween unified similarity distribution of words between languages. Using such a measure, we perform language comparison for fifty nat-ural languages and twelve genetic languages. Our natural language dataset is a collection of sentence-aligned parallel corpora from bible translations for fifty languages spanning a va-riety of language families. Although we use parallel corpora, which guarantees having the same content in all languages, interestingly in many cases languages within the same fam-ily cluster together. In addition to natural languages, we perform language comparison for the coding regions in the genomes of 12 different organisms (4 plants, 6 animals, and two human subjects). Our result confirms a significant high-level difference in the ge-netic language model of humans/animals ver-sus plants. The proposed method is a step to-ward defining a quantitative measure of simi-larity between languages, with applications in languages classification, genre identification, dialect identification, and evaluation of trans-lations.
1 Introduction
Classification of language varieties is one of the prominent problems in linguistics (Smith, 2016). The term language variety can refer to different styles, dialects, or even a distinct language (Mar-jorie and Rees-Miller, 2001). It has been a long-standing argument that strictly quantitative methods
can be applied to determine the degree of similar-ity or dissimilarsimilar-ity between languages (Kroeber and Chr´etien, 1937; Sankaran et al., 1950; Kr´amsk`y, 1959; McMahon and McMahon, 2003). The meth-ods proposed in the 1990’s and early 2000’ mostly relied on utilization of intensive linguistic resources. For instance, similarity between two languages was defined based on the number of common cognates or phonological patterns according to a manually extracted list (Kroeber and Chr´etien, 1937; McMa-hon and McMaMcMa-hon, 2003). Such an approach, of course, is not easily extensible to problems involv-ing new languages. Recently, statistical methods have been proposed to automatically detect cognates (Berg-Kirkpatrick and Klein, 2010; Hall and Klein, 2010; Bouchard-Cˆot´e et al., 2013; Ciobanu and Dinu, 2014) and subsequently compare languages based on the number of common cognates (Ciobanu and Dinu, 2014).
In this paper our aim is to define a quantitative measure of distance between languages. Such a met-ric should reasonably take both syntactic and seman-tic variability of languages into account. A measure of distance between languages can have various ap-plications including quantitative genetic/typological language classification, styles and genres identifica-tion, and translation evaluation. In addiidentifica-tion, compar-ing the biological languages generatcompar-ing the genome in different organisms can potentially shed light on important biological facts.
1.1 Problem Definition
graphΩL(V, e), whereV is a set of vertices (words),
ande : (V ×V) → < is a weight function map-ping a pair of words to their similarity value. Then our goal of approximating the distance between the two languagesLandL0can be transferred to the
ap-proximation of the distance between ΩL(V, e) and
ΩL0(V0, e0). In order to approach such a problem
firstly we need to address the following questions:
• What is a proper weight functioneestimating a similarity measure between wordswi, wj ∈V
in a languageL?
• How can we relate words inV to words inV0?
• And finally, how can we measure a distance between languagesΩL andΩL0, which means D(ΩL,ΩL0)?
In the following section we explain how re-searchers have addressed the above mentioned ques-tions until now.
1.1.1 Word similarity within a language
The main aim of word similarity methods is to measure how similar pairs of words are to each-other, semantically and syntactically (Han et al., 2013). Such a problem has a wide range of appli-cations in information retrieval, automatic speech recognition, word sense disambiguation, and ma-chine translation (Collobert and Weston, 2008; Glo-rot et al., 2011; Mikolov et al., 2013c; Turney et al., 2010; Resnik, 1999; Schwenk, 2007).
Various methods have been proposed to measure word similarity, including thesaurus and taxonomy-based approaches, data-driven methods, and hybrid techniques (Miller, 1995; Mohammad and Hirst, 2006; Mikolov et al., 2013a; Han et al., 2013). Taxonomy-based methods are not easily extensible as they usually require extensive human interven-tion for creainterven-tion and maintenance (Han et al., 2013). One of the main advantages of data-driven methods is that they can be employed even for domains with shortage of manually annotated data.
Almost all of the data-driven methods such as ma-trix factorization (Xu et al., 2003), word embed-ding (Mikolov et al., 2013a), topic models (Blei, 2012), and mutual information (Han et al., 2013) are based on co-occurrences of words within de-fined units of text data. Each method has its own convention for unit of text, which can be a sen-tence, paragraph or a sliding window around a word.
Using distributed representations have been one of the most successful approaches for computing word similarity in natural language processing (Collobert et al., 2011). The main idea in distributed represen-tation is characterizing words by the company they keep (Hinton, 1984; Firth, 1975; Collobert et al., 2011).
Recently, continuous vector representations known as word vectors have become popular in natural language processing (NLP) as an effi-cient approach to represent semantic/syntactic units (Mikolov et al., 2013a; Collobert et al., 2011). Word vectors are trained in the course of training a language model neural network from large amounts of textual data (words and their contexts) (Mikolov et al., 2013a). More precisely, word representa-tions are the outputs of the last hidden layer in a trained neural network for language modeling. Thus, word vectors are supposed to encode the most relevant features to language modeling by observing various samples. In this representation similar words have closer vectors, where similarity is defined in terms of both syntax and semantics. By training word vectors over large corpora of natural languages, interesting patterns have been observed. Words with similar vector representations display multiple types of similarity. For instance,
−−−→
King −−−−→Man+−−−−−→W oman is the closest vector to that of the word −−−−→Queen (an instance of semantic regularities) and−−−→quick−−−−−−→quickly ≈−−→slow−−−−−→slowly
(an instance of syntactic regularities). A recent work has proposed the use of word vectors to detect linguistic changes within the same language over time (Kulkarni et al., 2015). The fact that various degrees of similarity were captured by such a representation convinced us to use it as a notion of proximity for words.
1.1.2 Word alignment
As we discussed in section 1.1, in order to com-pare graphs ΩL and Ω0L, we need to have a
uni-fied definition of words (vertices). Thus, we need to find a mapping function from the words inV to the words inV0. Obviously when two languages have
we compare biological languages (DNA or protein languages) for different species (Asgari and Mofrad, 2015). However, when our goal is to compare dis-tributional similarity of words for two different lan-guages, such as French and German, we need to find a mapping from words in French to German words.
Finding a word mapping function between two languages can be achieved using a dictionary or using statistical word alignment in parallel cor-pora (Och and Ney, 2003; Lardilleux and Lep-age, 2009). Statistical word alignment is a vi-tal component in any statistical machine transla-tion pipeline (Fraser and Marcu, 2007). Various methods/tools has been proposed for word align-ment, such as GIZA++ (Och, 2003) and Any-malign (Lardilleux and Lepage, 2009), which are able to extract high quality word alignments from sentence-aligned multilingual parallel corpora.
One of the data resources we use in this project is a large collection of sentence-aligned parallel cor-pora we extract from bible translations in fifty lan-guages. Thus, in order to find a word mapping func-tion among all these languages we used statistical word alignment techniques and in particular Any-malign (Lardilleux and Lepage, 2009), which can process any number of languages at once.
1.1.3 Network Analysis of Languages
The rather intuitive approach of treating lan-guages as networks of words has been proposed and explored in the last decade by a number of re-searchers (i Cancho and Sol´e, 2001; Liu and Cong, 2013; Cong and Liu, 2014; Gao et al., 2014). In these works, human languages, like many other aspects of human behavior, are modeled as com-plex networks (Costa et al., 2011), where the nodes are essentially the words of the language and the weights on the edges are calculated based on the co-occurrences of the words (Liu and Cong, 2013; i Cancho and Sol´e, 2001; Gao et al., 2014). Clus-tering of 14 languages based on various parameters of a complex network such as average degree, aver-age path length, clustering coefficient, network cen-tralization, diameter, and network heterogeneity has been done by (Liu and Cong, 2013). A similar ap-proach is suggested by (Gao et al., 2014) for anal-ysis of the complexity of six languages. Although, all of the above mentioned methods have presented
promising results about similarity and regularity of languages, to our understanding they need the fol-lowing improvements:
Measure of word similarity: Considering co-occurrences as a measure of similarity between nodes, which is the basis of the above mentioned complex network methods, is a naive estimate of similarity, (Liu and Cong, 2013; i Cancho and Sol´e, 2001; Gao et al., 2014). The most trivial cases are synonyms, which we expect to be marked as the most similar words to each other. However, since they can only be used interchangeably with each other in the same sentences, their co-occurrences rate is very low. Thus, raw co-occurrence is not nec-essarily a good indicator of similarity.
Independent vs. joint analysis: Previous meth-ods have compared the parameters of language graphs independently, except for some relatively small networks of words for illustration (Liu and Cong, 2013; i Cancho and Sol´e, 2001; Gao et al., 2014). However, two languages may have similar settings of the edges but for completely different concepts. Thus, a systematic way for joint compari-son of these networks is essential.
Language collection: The previous analysis was performed on a relatively small number of lan-guages. For instance in (Liu and Cong, 2013), four-teen languages were studied where twelve of them were from the Slavic family of languages, and (Gao et al., 2014) studied six languages. Clearly, study-ing more languages from a broader set of language families would be more indicative.
1.2 Our Contributions
In this paper, we suggest a heuristic method toward a quantitative measure of distance between languages. We propose divergence between unified similarity distribution of words as a quantitative measure of distance between languages.
within sliding windows, they are capable of attribut-ing a reasonable degree of similarity to close words that do not co-occur.
Joint analysis of language graphs: By having word vector proximity as a measure of word similar-ity, we can represent each language as a joint sim-ilarity distribution of its words. Unlike the meth-ods mentioned in section 1.1.3 which focused on network properties and did not consider a mapping function between nodes across various languages, we propose performing node alignment between different languages (Lardilleux and Lepage, 2009). Consequently, calculation of Jensen-Shannon diver-gence between unified similarity distributions of the languages can provide us with a measure of distance between languages.
Language collection: In this study we perform language comparison for fifty natural languages and twelve genetic language.
Natural languages: We extracted a collection of sentence-aligned parallel corpora from bible trans-lations for fifty languages spanning a variety of lan-guage families including Indo-European (Germanic, Italic, Slavic, Indo-Iranian), Austronesian, Sino-Tibetan, Altaic, Uralic, Afro-Asiatic, etc. This set of languages is relatively large and diverse in com-parison with the corpora that have been used in pre-vious studies (Liu and Cong, 2013; Gao et al., 2014). We calculated the Jensen-Shannon divergence be-tween joint similarity distributions for fifty language graphs consisting of 4,097 sets of aligned words in all these fifty languages. Using the mentioned diver-gence we performed cluster analysis of languages. Interestingly in many cases languages within the same family clustered together. In some cases, a lower degree of divergence from the source language despite belonging to different language families was indicative of a consistent translation.
Genetic languages: Nature uses certain lan-guages to generate biological sequences such as DNA, RNA, and proteins. Biological organisms use sophisticated languages to convey information within and between cells, much like humans adopt languages to communicate (Yandell and Majoros, 2002; Searls, 2002). Inspired by this conceptual analogy, we use our languages comparison method for comparison of genetic languages in different organisms. Genome refers to a sequence of
nu-cleotides containing our genetic information. Some parts of our genome are coded in a way that can be translated to proteins (exonic regions), while some regions cannot be translated into proteins (in-trons) (Saxonov et al., 2000). In this study, we per-form language comparison of coding regions in 12 different species (4 plants, 6 animals, and two hu-man subjects). Our language comparison method is able to assign a reasonable relative distance between species.
2 Methods
As we discussed in 1.1, we transfer the problem of finding a measure of distance between languagesL
andL0to finding the distance between their language
graphsΩL(V, e)andΩL0(V0, e0).
Word Embedding: We define the edge weight functione: (V×V)→ <to be the cosine similarity between word vectors.
Alignment: When two languages have different words, in order to find a mapping between the words inV andV0 we can perform statistical word
align-ment on parallel corpora.
Divergence Calculation: Calculating Jensen-Shannon divergence between joint similarity distri-butions of the languages can provide us with a notion of distance between languages.
Our language comparison method has three com-ponents. Firstly, we need to learn word vectors from large amounts of data in an unsupervised manner for both of the languages we are going to compare. Secondly, we need to find a mapping function for the words and finally we need to calculate the diver-gence between languages. In the following section we explain each step aligned with the experiment we perform on both natural languages and genetic lan-guages.
2.1 Learning Word Embedding
ba-sically words and their corresponding contexts. In this project, in particular we use an implementa-tion of the skip-gram neural network (Mikolov et al., 2013b).
In training word vector representations, the skip-gram neural network attempts to maximize the av-erage probability of contexts for given words in the training data:
argmax v,v0
1
N
N
X
i=1
X
−c≤j≤c,j6=0
logp(wi+j|wi)
p(wi+j|wi) = exp (v
0T wi+jvwi)
PW
k=1exp (v0Twkvwi) ,
(1)
where N is the length of the training, 2c is the window size we consider as the context, wi is the
center of the window,W is the number of words in the dictionary andvwandv0ware the n-dimensional
word representation and context representation of wordw, respectively. At the end of the training the average ofvwandv0wwill be considered as the word
vector forw. The probabilityp(wi+j|wi)is defined
using a softmax function. In the implementation we use (Word2Vec) (Mikolov et al., 2013b) nega-tive sampling has been utilized, which is considered as the state-of-the-art for training word vector repre-sentation.
2.1.1 Natural Languages Data
For the purpose of language classification we need parallel corpora that are translated into a large number of languages, so that we can find the alignments using statistical methods. Recently, a massive parallel corpus based on 100 transla-tions of the Bible has been created in XML for-mat (Christodouloupoulos and Steedman, 2015), which we choose as the database for this project. In order to make sure that we have a large enough corpus for learning word vectors, we pick the lan-guages for which translations of both the Old Tes-tament and the New TesTes-tament are available. From among those languages we pick the ones contain-ing all the verses in the Hebrew version (which is the source language for most of the data) and fi-nally we end up with almost 50 languages, con-taining 24,785 aligned verses. For Thai, Japanese, and Chinese we use the tokenized versions in
the database (Christodouloupoulos and Steedman, 2015). In addition, before feeding the skip-gram neural network we remove all punctuation.
In our experiment, we use the word2vec imple-mentation of skip-gram (Mikolov et al., 2013b). We set the dimension of word vectorsdto 100, and the window sizecto 10 and we sub-sample the frequent words by the ratio 1
103.
2.1.2 Genetic Languages Data
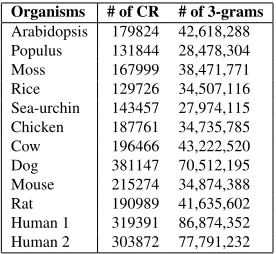
In order to compare the various genetic languages we use the IntronExon database that contains coding and non-coding regions of genomes for a number of organisms (Shepelev and Fedorov, 2006). From this database we extract a data-set of coding regions (CR) from 12 organisms consisting of 4 plants (ara-bidopsis, populus, moss, and rice), 6 animals (sea-urchin, chicken, cow, dog, mouse, and rat), and two human subjects. The number of coding regions we have in the training data for each organism is sum-marized in Table 1. The next step is splitting each sequence to a number of words. Since the genome is composed of the four DNA nucleotides A,T,G and C, if we split the sequences in the character level the language network would be very small. We thus split each sequence into n-grams (n = 3,4,5,6), which is a common range of n-grams in bioinfor-matics(Ganapathiraju et al., 2002; Mantegna et al., 1995). As suggested by(Asgari and Mofrad, 2015) we split the sequence into non-overlapping n-grams, but we consider all possible ways of splitting for each sequence.
Organisms # of CR # of 3-grams
Arabidopsis 179824 42,618,288
Populus 131844 28,478,304
Moss 167999 38,471,771
Rice 129726 34,507,116
Sea-urchin 143457 27,974,115
Chicken 187761 34,735,785
Cow 196466 43,222,520
Dog 381147 70,512,195
Mouse 215274 34,874,388
Rat 190989 41,635,602
Human 1 319391 86,874,352
[image:5.612.358.496.517.644.2]Human 2 303872 77,791,232
Table 1:The genome data-set for learning word vectors in dif-ferent organisms. The number of coding regions and the total occurrences of 3-grams are presented. Clearly, the total number of all n-grams (n=3,4,5,6) is almost the same.
skip-gram neural network implementation (Mikolov et al., 2013b). We set the dimension of word vectorsd
to 100, and window size ofcto 40. In addition, we sub-sample the frequent words by the ratio10−3.
2.2 Word Alignment
The next step is to find a mapping between the nodes inΩL(V, e) and ΩL0(V0, e0). Obviously in case of
quantitative comparison of styles within the same language we do not need to find an alignment be-tween the nodes inV andV0. However, when we are
comparing two distinct languages we need to find a mapping from the words in languageLto the words in languageL0.
2.2.1 Word Alignment for Natural Languages
As we mentioned in section 2.1.1, our parallel corpora contain texts in fifty languages from a va-riety of language families. We decided to use statis-tical word alignments because we already have par-allel corpora for these languages and therefore per-forming statistical alignment is straightforward. In addition, using statistical alignment we hope to see evidences of consistent/inconsistent translations.
We use an implementation of Anyma-lign (Lardilleux and Lepage, 2009), which is designed to extract high quality word alignments from sentence-aligned multilingual parallel corpora. Although Anymalign is capable of performing alignments in several languages at the same time, our empirical observation was that performing alignments for all languages against a single language and then finding the global alignment through that alignment is faster and results in better alignments. We thus align all translations with the Hebrew version. To ensure the quality of alignments we apply a high threshold on the score of alignments. In a final step, we combine the results and end up with a set of 4,097 multilingual alignments. Hence we have a mapping from any of the 4,097 words in one language to one in any other given language, where the Hebrew words are unique, but not necessarily the others.
2.2.2 Genetic Languages Alignment
In genetic language comparison, since the n-grams are generated from the same nucleotides (A,T,C,G), no alignment is needed andV would be the same asV0.
2.3 Calculation of Language Divergence
In section 2.1 we explained how to make language graphs ΩL(V, e) and ΩL0(V0, e0). Then in
sec-tion 2.2 we proposed a statistical alignment method to find the mapping function between the nodes in
V andV0. Having achieved the mapping between
the words inV and the words inV0, the next step is
comparison ofeande0.
In comparing language graphs what is more cru-cial is therelativesimilarities of words. Intuitively we know that the relative similarities of words vary in different languages due to syntactic and seman-tic differences. Hence, we decided to use the di-vergence between relative similarities of words as a heuristic measure of the distance between two lan-guages. To do so, firstly we normalize the rela-tive word vector similarities within each language. Then, knowing the mapping between words in V
andV0 we unify the coordinates of the normalized
similarity distributions. Finally, we calculate the Jensen-Shannon divergence between the normalized and unified similarity distributions of two languages:
DL,L0 =JSD(ˆe,eˆ0),
where eˆ and eˆ0 are normalized and unified
simi-larity distributions of word pairs in ΩL(V, e) and
ΩL0(V0, e0)respectively.
2.3.1 Natural Languages Graphs
For the purpose of language classification we need to find pairwise distances between all of the fifty languages we have in our corpora. Using the mapping function obtained from statistical align-ments of Bible translations, we produce the nor-malized and unified similarity distributions of word pairse(ˆk) for languageL(k). Therefore to compute
the quantitative distance between two languagesL(i)
andL(j)we calculateD
Li,Lj =JSD( ˆe(i),eˆ(j)).
Consequently, we calculate a quantitative distance between each pair of languages. In a final step, for visualization purposes, we perform Unweighted Pair Group Method with Arithmetic Mean (UPGMA) hi-erarchical clustering on the pairwise distance matrix of languages (Johnson, 1967).
2.3.2 Genetic Languages Graphs
Pair-wise distances of genetic languages were calculated using Jensen-Shannon divergence between normal-ized and unified similarity distributions of word pairs for each pair of languages.
We calculate the pairwise distance matrix of lan-guages for each n-gram separately to verify which length of DNA segment is more discriminative be-tween different species.
3 Results
3.1 Classification of Natural Languages
The result of the UPGMA hierarchical clustering of languages is shown in Figure 1. As shown in this figure, many languages are clustered together according to their family and sub-family. Many Indo-European languages (shown in green) and Aus-tronesian languages (shown in pink) are within a close proximity. Even the proximity between lan-guages within a sub-family are preserved with our measure of language distance. For instance, Roma-nian, Spanish, French, Italian, and Portuguese, all of which belong to the Italic sub-family of Indo-European languages, are in the same cluster. Simi-larly, the Austronesian langauges Cebuano, Tagalog, and Maori as well as Malagasy and Indonesian are grouped together.
Although the clustering based on word em-bedding language divergence matches the ge-netic/typological classification of languages in many cases, for some pairs of languages their distance in the clustering does not make any genetic or topo-logical sense. For instance, we expected Arabic and Somali as Afro-Asiatic languages to be within a close proximity with Hebrew. However, He-brew is matched with Norwegian, a Germanic Indo-European language. After further investigations and comparing word neighbors for several cases in these languages, it turns out that the Norwegian bible translation highly matches Hebrew because of be-ing a consistent and high-quality translation. In this translation, synonym were not used interchangeably and language usage stays more faithful to the struc-ture of the Hebrew text.
3.1.1 Divergence between Genetic Languages
The pairwise distance matrix of the twelve ge-netic languages for n-grams (n= 3,4,5,6) is shown in Figure 2. Our results confirm that evolutionar-ily closer species have a reasonably higher level of
proximity in their language models. We can ob-serve in Figure 2, that as we increase the number of n-grams the distinction between animal/human genome and plant genome increases.
4 Conclusion
In this paper, we proposed Word Embedding Lan-guage Divergence (WELD) as a new heuristic mea-sure of distance between languages. Consequently we performed language comparison for fifty natural languages and twelve genetic languages. Our nat-ural language dataset was a collection of sentence-aligned parallel corpora from bible translations for fifty languages spanning a variety of language fami-lies. We calculated our word embedding language divergence for 4,097 sets of aligned words in all these fifty languages. Using the mentioned diver-gence we performed cluster analysis of languages.
The corpora for all of the languages but one con-sisted of translated text instead of original text in those languages. This means many of the poten-tial relations between words such as collocations and culturally influenced semantic connotations did not have the full chance to contribute to the mea-sured language distances. This can potentially make it harder for the algorithm to detect related guages. In spite of this, however in many cases lan-guages within the same family/sub-family clustered together. In some cases, a lower degree of diver-gence from the source language despite belonging to different language families was indicative of a con-sistent translation. This suggests that this method can be a step toward defining a quantitative measure of similarity between languages, with applications in languages classification, genres identification, di-alect identification, and evaluation of translations.
Indo-European Germanic Indo-European Italic Indo-European Slavic Indo-European Indo-Iranian Indo-European
[image:8.612.94.539.36.335.2]Austronesian Sino-tibetan Altaic Uralic Afro-Asiatic Others Others
Figure 1:Hierarchical clustering of fifty natural languages according to divergence of joint distance distribution of 4097 aligned words in bible parallel corpora. Subsequently we use colors to show the ground-truth about family of languages. For Indo-European languages we use different symbols to distinguish various sub-families of Indo-European languages. We observe that the obtained clustering reasonably discriminates between various families and subfamilies.
[image:8.612.118.488.415.667.2]Acknowledgments
Fruitful discussions with David Bamman, Meshkat Ahmadi, and Mohsen Mahdavi are gratefully ac-knowledged.
References
Ehsaneddin Asgari and Mohammad RK Mofrad. 2015. Continuous distributed representation of biological se-quences for deep proteomics and genomics. PloS one, 10(11):e0141287.
Taylor Berg-Kirkpatrick and Dan Klein. 2010. Phyloge-netic grammar induction. InProceedings of the 48th Annual Meeting of the Association for Computational Linguistics, pages 1288–1297. Association for Com-putational Linguistics.
David M Blei. 2012. Probabilistic topic models. Com-munications of the ACM, 55(4):77–84.
Alexandre Bouchard-Cˆot´e, David Hall, Thomas L Grif-fiths, and Dan Klein. 2013. Automated reconstruc-tion of ancient languages using probabilistic models of sound change. Proceedings of the National Academy of Sciences, 110(11):4224–4229.
Christos Christodouloupoulos and Mark Steedman. 2015. A massively parallel corpus: the bible in 100 languages. Language resources and evaluation, 49(2):375–395.
Alina Maria Ciobanu and Liviu P. Dinu. 2014. An et-ymological approach to cross-language orthographic similarity. application on romanian. InProceedings of the 2014 Conference on Empirical Methods in Natural Language Processing (EMNLP), pages 1047–1058, Doha, Qatar, October. Association for Computational Linguistics.
Ronan Collobert and Jason Weston. 2008. A unified ar-chitecture for natural language processing: Deep neu-ral networks with multitask learning. InProceedings of the 25th international conference on Machine learn-ing, pages 160–167. ACM.
Ronan Collobert, Jason Weston, L´eon Bottou, Michael Karlen, Koray Kavukcuoglu, and Pavel Kuksa. 2011. Natural language processing (almost) from scratch.
The Journal of Machine Learning Research, 12:2493– 2537.
Jin Cong and Haitao Liu. 2014. Approaching human lan-guage with complex networks. Physics of life reviews, 11(4):598–618.
Luciano da Fontoura Costa, Osvaldo N Oliveira Jr, Gonzalo Travieso, Francisco Aparecido Rodrigues, Paulino Ribeiro Villas Boas, Lucas Antiqueira, Matheus Palhares Viana, and Luis Enrique Cor-rea Rocha. 2011. Analyzing and modeling Cor-real-world
phenomena with complex networks: a survey of appli-cations. Advances in Physics, 60(3):329–412. John Rupert Firth. 1975. Modes of meaning. College
Division of Bobbs-Merrill Company.
Alexander Fraser and Daniel Marcu. 2007. Measuring word alignment quality for statistical machine transla-tion. Computational Linguistics, 33(3):293–303. Madhavi Ganapathiraju, Deborah Weisser, Roni
Rosen-feld, Jaime Carbonell, Raj Reddy, and Judith Klein-Seetharaman. 2002. Comparative n-gram analysis of whole-genome protein sequences. InProceedings of the second international conference on Human Lan-guage Technology Research, pages 76–81. Morgan Kaufmann Publishers Inc.
Yuyang Gao, Wei Liang, Yuming Shi, and Qiuling Huang. 2014. Comparison of directed and weighted co-occurrence networks of six languages. Physica A: Statistical Mechanics and its Applications, 393:579– 589.
Xavier Glorot, Antoine Bordes, and Yoshua Bengio. 2011. Domain adaptation for large-scale sentiment classification: A deep learning approach. In Proceed-ings of the 28th International Conference on Machine Learning (ICML-11), pages 513–520.
David Hall and Dan Klein. 2010. Finding cognate groups using phylogenies. InProceedings of the 48th Annual Meeting of the Association for Computational Linguistics, pages 1030–1039. Association for Com-putational Linguistics.
Lushan Han, Tim Finin, Paul McNamee, Akanksha Joshi, and Yelena Yesha. 2013. Improving word similarity by augmenting pmi with estimates of word polysemy.
Knowledge and Data Engineering, IEEE Transactions on, 25(6):1307–1322.
Geoffrey E Hinton. 1984. Distributed representations.
Computer Science Department, Carnegie Mellon Uni-versity.
Ramon Ferrer i Cancho and Richard V Sol´e. 2001. The small world of human language. Proceedings of the Royal Society of London B: Biological Sciences, 268(1482):2261–2265.
Stephen C Johnson. 1967. Hierarchical clustering schemes. Psychometrika, 32(3):241–254.
Jiˇri Kr´amsk`y. 1959. A quantitative typology of lan-guages. Language and speech, 2(2):72–85.
Alfred L Kroeber and C Douglas Chr´etien. 1937. Quan-titative classification of indo-european languages.
Language, 13(2):83–103.
Adrien Lardilleux and Yves Lepage. 2009. Sampling-based multilingual alignment. InRecent Advances in Natural Language Processing, pages 214–218. Omer Levy and Yoav Goldberg. 2014. Neural word
embedding as implicit matrix factorization. In Ad-vances in Neural Information Processing Systems, pages 2177–2185.
HaiTao Liu and Jin Cong. 2013. Language clustering with word co-occurrence networks based on parallel texts.Chinese Science Bulletin, 58(10):1139–1144. RN Mantegna, SV Buldyrev, AL Goldberger, S Havlin,
C-K Peng, M Simons, and HE Stanley. 1995. System-atic analysis of coding and noncoding dna sequences using methods of statistical linguistics. Physical Re-view E, 52(3):2939.
M Marjorie and Janie Rees-Miller. 2001. Language in social contexts. Contemporary Linguistics, pages 537–590.
April McMahon and Robert McMahon. 2003. Find-ing families: quantitative methods in language clas-sification. Transactions of the Philological Society, 101(1):7–55.
Tomas Mikolov, Kai Chen, Greg Corrado, and Jeffrey Dean. 2013a. Efficient estimation of word representa-tions in vector space. arXiv preprint arXiv:1301.3781. Tomas Mikolov, Ilya Sutskever, Kai Chen, Greg S Cor-rado, and Jeff Dean. 2013b. Distributed representa-tions of words and phrases and their compositionality. InAdvances in neural information processing systems, pages 3111–3119.
Tomas Mikolov, Wen-tau Yih, and Geoffrey Zweig. 2013c. Linguistic regularities in continuous space word representations. In HLT-NAACL, pages 746– 751.
George A Miller. 1995. Wordnet: a lexical database for english. Communications of the ACM, 38(11):39–41. Saif Mohammad and Graeme Hirst. 2006.
Distribu-tional measures of concept-distance: A task-oriented evaluation. InProceedings of the 2006 Conference on Empirical Methods in Natural Language Processing, pages 35–43. Association for Computational Linguis-tics.
Franz Josef Och and Hermann Ney. 2003. A system-atic comparison of various statistical alignment mod-els. Computational linguistics, 29(1):19–51.
FJ Och. 2003. Giza++ software.
Philip Resnik. 1999. Semantic similarity in a taxonomy: An information-based measure and its application to problems of ambiguity in natural language. J. Artif. Intell. Res.(JAIR), 11:95–130.
CR Sankaran, AD Taskar, and PC Ganeshsundaram. 1950. Quantitative classification of languages. Bul-letin of the Deccan College Research Institute, pages 85–111.
Serge Saxonov, Iraj Daizadeh, Alexei Fedorov, and Wal-ter Gilbert. 2000. Eid: the exon–intron databasean ex-haustive database of protein-coding intron-containing genes.Nucleic acids research, 28(1):185–190. Holger Schwenk. 2007. Continuous space language
models. Computer Speech & Language, 21(3):492– 518.
David B Searls. 2002. The language of genes. Nature, 420(6912):211–217.
Valery Shepelev and Alexei Fedorov. 2006. Advances in the exon–intron database (eid). Briefings in bioinfor-matics, 7(2):178–185.
Andrew DM Smith. 2016. Dynamic models of language evolution: The linguistic perspective.
Efstathios Stamatatos, Nikos Fakotakis, and George Kokkinakis. 2000. Text genre detection using com-mon word frequencies. In Proceedings of the 18th conference on Computational linguistics-Volume 2, pages 808–814. Association for Computational Lin-guistics.
Peter D Turney, Patrick Pantel, et al. 2010. From fre-quency to meaning: Vector space models of semantics.
Journal of artificial intelligence research, 37(1):141– 188.
Wei Xu, Xin Liu, and Yihong Gong. 2003. Document clustering based on non-negative matrix factorization. InProceedings of the 26th annual international ACM SIGIR conference on Research and development in in-formaion retrieval, pages 267–273. ACM.