A Method of Proactive MANET Routing Protocol Evaluation
Applied to the OLSR Protocol
Michael S. Thompson
Electrical Engineering Dept.Bucknell University Lewisburg, PA, USA
[email protected]
Allen B. MacKenzie
Dept. of Electrical and Computer EngineeringVirginia Tech Blacksburg, VA, USA
[email protected]
Luiz A. DaSilva
CTVR Trinity College Dublin, Ireland[email protected]
ABSTRACT
Traditional evaluation studies of MANET routing protocols have concentrated on quantitative, traffic-based metrics like throughput and packet loss. These metrics provide a lim-ited evaluation of protocol performance because they do not measure how well the protocol finds and maintains routes, only how well functional routes perform, once established. This work proposes a method for assessing how well a proac-tive MANET routing protocol tracks the network topology by comparing the reported routes to the actual topology. This study exposes the impact of routing message propa-gation and message loss on MANET routing by showing the existence of errant routes and protocol-reported informa-tion, specifically broken routes, incorrect routing table hop counts, and existing routes that were not found by the pro-tocol. We use this approach to analyze the performance of the OLSR protocol in a medium-sized MANET, using data from the MANIAC Challenge. The results favor OLSR, but expose errant routes, how often they occur and for how long.
Categories and Subject Descriptors
C.2 [Computer Systems Organization]: Computer-Communication Networks
General Terms
Performance, Experimentation
Keywords
MANET, ad hoc routing, OLSR
1.
INTRODUCTION
Traditionally, the evaluation of proactive MANET routing protocols1 has concentrated on evaluating the performance 1For the remainder of this paper, we will use the term “rout-ing protocol” to refer to proactive rout“rout-ing protocols.
Permission to make digital or hard copies of all or part of this work for personal or classroom use is granted without fee provided that copies are not made or distributed for profit or commercial advantage and that copies bear this notice and the full citation on the first page. To copy otherwise, to republish, to post on servers or to redistribute to lists, requires prior specific permission and/or a fee.
WiNTECH’11,September 19, 2011, Las Vegas, Nevada, USA. Copyright 2011 ACM 978-1-4503-0867-0/11/09 ...$10.00.
of the reported routes and the overhead required to maintain them. In this context, route performance has been defined in multiple ways including, but not limited to, the percentage of packets that arrived [1,3,7,10,13,20], throughput (usually TCP throughput) [2, 4, 7, 9, 12, 13, 16] and round trip time or latency [1, 9, 10]. While these metrics provide quantitative points for evaluation, they concentrate on the performance of reported routes and do not directly evaluate how well a routing protocol performs its primary task: to find and maintain routes in a MANET based on decision metrics. The underlying assumption in using only route performance to assess protocol performance is that a protocol is finding all routes and maintaining those routes correctly all of the time. Our group’s anecdotal experience with MANETs has been that this assumption is not always true and that a more direct measure of how well a protocol is accomplishing its primary tasks is needed to complement the traditional metrics.
The main purpose of conventional route performance met-rics is to provide some indication of how wellreported routes
perform. These metrics do not accurately convey how effec-tive the protocol is at finding and maintaining those routes nor do they identify specific route errors. Using traditional metrics, an errant route simply yields no throughput, 100% packet loss, and infinite delay. There are a number of ad-ditional questions that are of interest when evaluating rout-ing protocols that traditional metrics cannot answer. These points of interest are captured in the following questions.
• How close is the routing-viewed topology to the actual topology?
• How many of the possible routes did the protocol lo-cate?
• How many of the reported routes work correctly, i.e. is there a complete and functional path?
• If a route does not work correct, what is wrong with it?
• Is the reported hop count information accurate? If not, how different is it from the actual hop count?
• How often do errant routes occur and for how long?
experience has shown that this does not happen in real-world MANETs. Answering the previous questions com-bined with traditional performance metrics will yield a more holistic picture of routing protocol and route performance in MANETs.
In addition to the limited scope of evaluation, route per-formance metrics and overhead values are dependent on the type of networking technology in use and the particular topology of the MANET. For example, a MANET using IEEE 802.11g network cards will have much higher through-put and lower latency than an identical IEEE 802.11b-based network. Additionally, since IEEE 802.11g packets are trans-mitted faster than IEEE 802.11b packets they will be in transit for less time. In the case of overhead, a network with more routes, a more connected network topology, will have greater overhead as there is more routing data to exchange between nodes even if the frequency of the exchanges stays the same. This dependence on the specific characteristics of each MANET has yet to be addressed by the commu-nity. In order for disparate MANET evaluation data to be comparable, technology-independent metrics are needed.
Similarly, hop count is often used as a decision metric in MANET route selection; the “shorter” route is the desired route. As a result, routing tables with a collection of shorter routes are seen as better than routing tables with longer routes. However, the authors of [8] show that shorter paths are not always better and other metrics should be used in choosing routes. Likewise, unless explicitly selected as a metric of interest, it is not worthwhile to use route hop count as a performance comparison metric between protocols.
In this paper we create a scheme to answer the aforemen-tioned questions by grouping routes based on their validity and presence in the network. The purpose of these groups is to expose the number, duration, and type of errant and correct routes in a network. Using publicly available data from the Virginia Tech MANIAC Challenge Project [11, 14], we analyze routing data from medium-sized MANETs and apply our grouping and analysis to assess performance of the Optimized Link State Routing (OLSR) [5] protocol. We rely solely on routing table data in this study, removing a number of network technology-based dependencies. Our study begins with an explanation of the route classes and our methodology for grouping followed by an application of these groups to the MANIAC Competition data.
2.
PREVIOUS WORK
Among papers that experimentally assess the performance of proactive MANET routing protocols, the most common evaluative metric was throughput, typically TCP through-put [2, 4, 7, 9, 12, 13, 16]. Other popular metrics were packet delivery or loss rates [1,3,7,10,13,20], “ping” success rates [4, 20], latency [1, 9, 10], overhead [3, 10, 13], and average hop count [10]. We could not find any further evaluation of pro-tocol performance in an experimental setting.
None of these metrics gives direct indication of the cor-rectness of the routes that are created by the routing pro-tocols, other than that a broken route has 100% packet loss and zero throughput. For example, a path with a different length than reported by the routing protocol will still de-liver a packet, but incorrect information may be provided to an application that makes decisions based on routing table information. In such a case, the routing protocol should be evaluated on its ability to provide accurate hop count
in-formation, as well. Additionally, an evaluation of whether the routing protocol found all of the possible routes in the network is not included in these metrics.
We hypothesize that part of the reason for the lack of data beyond route performance is the logistical and analytical challenges of creating MANETs and collecting this informa-tion. Running a traffic generator on one or two nodes and collecting data is simple when compared to the complex-ities of continuously logging node connection information, compiling it to get a global picture, and then processing it to determine how well the protocol found and maintained routing information. We found this to be challenging as it required working with a relatively large amount of data when compared to previous studies.
The IETF MANET working group detailed a set of qual-itative and quantqual-itative metrics related to routing protocol performance and “suitability” [6]. The quantitative metrics are: end-to-end throughput, route acquisition time, out-of-order delivery percentage, and efficiency in terms of the data cost of delivering messages, similar to overhead. We found it interesting that only a subset of these suggestions have been used by researchers in practice. Like other evaluations, the IETF’s metrics assume that all routes are discovered and are perfect. However, this work does suggests that perfor-mance should be evaluated in context to allow for an “apples to apples” analysis of data from different contexts. Unfortu-nately, the authors do not suggest how this can be done and the community has done little to normalize results across different MANETs.
3.
MANET ROUTE CLASSIFICATION
In order to determine the effectiveness of a MANET rout-ing protocol, we propose four classification metrics for routes. They are: route existence,route correctness,route direction-ality, androute symmetry. These four metrics concentrate on the goodness of the routing protocolandthe routes found by the protocol. The first two are major metrics that iden-tify the quality and accuracy of the information provided by the routing protocol via the routing table. These two metrics are unique to this work. The latter two metrics are minor metrics and only apply to protocols that claim to ful-fill such requirements; these metrics are commonly analyzed in other work. By analyzing these areas, we can quantita-tively assess how well a routing protocol is fulfilling its core requirements, finding and maintaining routes by exposing how often and what types of errant routes occur.
In this paper we make a clear distinction between apath
and a route. We define a path as a collection of links that connect from one node, the source, to another node, the des-tination. We define aroute as a specific set of links between a source and a destination node as specified by the rout-ing tables along the way. We define a routrout-ing table entry as a triple including the destination, the next hop or gate-way, and the number of hops to the destination. This paper will concentrate on evaluating how well routing table entries reflect available paths in a network.
3.1
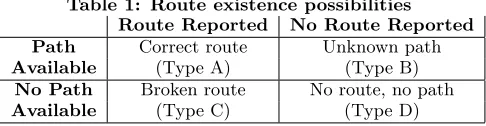
Route Existence
Table 1: Route existence possibilities Route Reported No Route Reported Path Correct route Unknown path
Available (Type A) (Type B)
No Path Broken route No route, no path
Available (Type C) (Type D)
for a destination. The second item of interest is whether a path is available through the network from the source to the destination. Each of these has a binary value, available or not available. Table 1 includes the four possible combina-tions of these items and a type that we will use throughout the paper to refer to them.
The first step in the process is to create the set of all possible source and destination combinations. In the case of a network with n nodes, the complete list of all possi-ble combinations would be (n−1)2 entries long; all 2-node combinations are needed to in order to check routes and paths in both directions. This complete list is needed, com-pared to just the list of existing routes, to determine if paths exist but corresponding routing table entries do not. For each entry, the source node’s routing table and the network topology would be compared to see if they match with re-gard to route and path availability. If the route exists in the source’s routing table and a corresponding path exists in the network, then the route is categorized as Type A. If a path exists from the source to the destination but a routing table entry is not present in the source node’s routing table, the route is classified as Type B. If a route exists in the source’s routing table but a corresponding pathdoes not exist in the network, the route is classified as Type C. Finally, if neither a path nor a routing table entry exist, the route is classified as Type D.
In order to fully evaluate how well a protocol is perform-ing, the reported routes must be evaluated for validity and if traffic will arrive at the destination. Similarly, the topology must be analyzed to identify instances where at least one path is available, but no corresponding route is reported. Correct operation of a protocol means that all routes should be either Type A or Type D.
The network topology can be found in a number of ways. For this paper, we used the one-hop routes from node routing tables to construct the topology. Note that these classifica-tions do not include any sense of route or path quality as the quality changes constantly in a wireless network and may be defined in various ways depending on the context.
3.2
Routing Table Correctness
The next metric is the correctness of routes that are re-ported in a node’s routing table; Types A and C as defined in Table 1. In this context, we define “correctness” as con-gruency between the network topology and the routing table information, and not mathematical correctness. This metric indicates how well the routing protocol is synchronized with the network topology. It goes a step further than existence and evaluates the correctness of the routing table informa-tion compared to the corresponding path. The attributes of interest are where the route terminates, the last valid node in the route, and the corresponding path length versus the reported route length found in the routing table.
The possible categories for reported routes are: OK routes,
DIFF routes, broken routes, and circular routes. These are defined as follows.
• OK routes: A route is defined as OK if it terminates at the destination node and the hop count reported in the source node’s routing table matches the path length.
• DIFF routes: A route is defined as DIFF if it termi-nates at the destination node but the path length dif-fers from the hop count reported in the source node’s routing table.
• Broken routes: A route is defined as broken if it termi-nates before arriving at the destination and all nodes on the path are traversed only once.
• Circular routes: A route is defined as circular if a node in the path is traversed more than once. Due to their nature, circular routes will never arrive at the destina-tion node.
Existing routes are categorized in the following manner. Each existing route entry is compared to the topology for completeness. The specific interest is whether or not the path terminates at the destination node. If the last node in the path is not the destination node, we define the path as incomplete. If the path is in complete, the path is tested for circularity. If any node is traversed more than once in the path, the route is marked as CIRCULAR, and if not, it is marked as BROKEN. If the path is complete, the correctness of the hop count is compared to the known topology. If the length of the corresponding path is equal to the reported hop count, the route is categorized as OK, and if not, it is categorized as a DIFF route.
Assuming no packet loss occurs, packets that traverse OK and DIFF routes should arrive at their destination. We dif-ferentiate between these two types of routes because, while both deliver traffic, only OK routes are correctly described in the routing table. Packets that traverse broken and cir-cular routes should not arrive at their destination.
To create the topology of the network we used the one-hop routes provided by the nodes’ routing tables. We did this because we did not have an external mechanism in place to map the network in another manner. Advantages of this are that we are using the information known to OLSR to test it and no additional, external applications were needed. The disadvantages of this approach are that OLSR does not add a one-hop route until a bidirectional exchange has happened between the two nodes. Thus, short-lived or unstable links are not ever added to the routing table. Using this approach, we evaluated OLSR’s performance using its own data.
3.3
Route Directionality
The next area of classification is the directionality of routes in a network. We define two states of directionality: unidi-rectional and bidiunidi-rectional. Unidiunidi-rectional routes include an existing route in only one direction between 2 nodes. Bidi-rectional routes exist in both directions between 2 nodes; these two routes may not include the same nodes, though.
3.4
Route Symmetry
The final area of classification is symmetry. Symmetric routes are bidirectional routes that share the same path in opposite directions.
4.
PROTOCOL EVALUATION
Our main goal regarding this work is to create quanti-tative metrics that describe how well a routing protocol does its primary jobs of finding and maintaining routes in a MANET. As such, the metrics introduced in this work are designed to show if and to what level errors occur and identify correct operation during the lifetime of a MANET. A protocol designer should use these values to decide if an approach fulfills its requirements and to identify problems with the protocol’s operation. A protocol user should use this information to evaluate if a protocol offers a required level of service in a specific context.
We believe that these metrics could also be used to com-pare multiple protocols in a link-technology independent manner and could be further used to help select protocol parameters, such as “HELLO” message interval in the case of OLSR. Currently, both of these uses are untested and areas for future investigation.
5.
EXPERIMENTAL DATA
The remainder of this paper presents data and discussion in regard to the prevalence and duration of the routing clas-sifications discussed in the previous section. We analyzed ex-perimental data from the MANIAC Challenge competition. More information is available about the MANIAC Challenge on the website [14] and in [18, 19], and the data is available via the CRAWDAD repository [11].
The MANIAC Challenge included six separate experiments with a collection of 15-20 heterogeneous mobile nodes par-ticipating in a MANET. The first competition (MANIAC07) took place in November of 2007 and the second (MANIAC09) took place in March 2009; each competition event included three experiments. The experimenters logged each node’s routing table every second for approximately 20 minutes, the length of an experiment; this comprises the data set that was used to create the following tables and figures. During this time, the competition participants were encouraged to move their nodes around the venue in order to maximize the amount of traffic that they received. The competition was based on the amount of traffic that participants received and their level of participation in the network with regard to forwarding packets for neighboring nodes.
Other relevant technical details of the experiments are as follows.
• Participants were from all over the world and brought their own hardware to the competition, resulting in a heterogenous network.
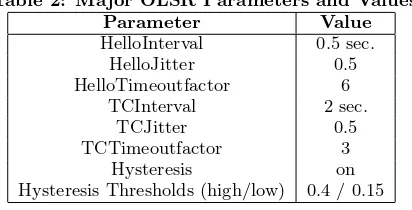
• The NRL implementation of the OLSR routing proto-col was used as the MANET routing protoproto-col. We used only the default parameter values for OLSR. These are shown in Table 2.
• Participants used IEEE 802.11b networking hardware in MANIAC07 and IEEE 802.11b and g in MANIAC09.
• All nodes were time synchronized using the Network Time Protocol (NTP) prior to each competition
exper-Table 2: Major OLSR Parameters and Values
Parameter Value
HelloInterval 0.5 sec. HelloJitter 0.5 HelloTimeoutfactor 6
TCInterval 2 sec.
TCJitter 0.5
TCTimeoutfactor 3 Hysteresis on Hysteresis Thresholds (high/low) 0.4 / 0.15
iment, allowing for correlation of logged information across all nodes in the network.
Participants moved throughout the venue (a different venue for each competition) in both competitions. The partic-ipants typically exhibited nomadic behavior; moving to a specific location and staying there for some time before mov-ing to another location. As they moved, participants care-fully monitored their connectivity to the network via their node’s routing table, paying special attention to their con-nectivity to the four source nodes with whom they would communicate at some point during the competition. Par-ticipant movement reflected the desire to maintain routes to the source nodes, usually requiring them to stay within range of a subset of their neighbors.
The raw form of the MANIAC Challenge data, relevant to this work, is a collection of text files that contain the col-lection of routing tables that were collected during each test run. Each node logged each routing table once per second. To build a complete topology view from this data, all of the log files were parsed and inserted into a MySQL database. Each record included competition, test, and time informa-tion as well all of the routing table informainforma-tion for the route (source, destination, gateway, and hop count). Once all of this data was inserted into the database, a Python script queried the database for all of the routing entries for a sin-gle time instance. The script followed each route entry from source to terminating node using only the one-hop routes in the returned routing table entries. This information, the path between the source and destination, was cached for later use This process was following for every time instance of the competitions.
The remainder of this section explores each of the route classifications and the prevalence and duration of the routes that fall into each category. The tables in this section include data from the two MANIAC Challenge competitions. Each table includes individual experiment results, the average of the results from experiments in the same competition, and an average across all experiments in the two competitions. Columns and rows marked “Avg.” denote a average values while “Stdev.” columns denote the standard deviation of relevant values.
5.1
Route Existence
[image:4.612.334.540.67.172.2]Table 3: Percentages of each classification group
Year Test A B C D
2007 1 91.3 1.2 1.5 5.9 2007 2 87.4 1.2 2 9.3 2007 3 85.8 1.4 2.1 10.7 2007 Avg. 88.2 1.3 1.9 8.6 2009 1 67.1 1.5 2.4 29 2009 2 86.3 1.8 1 10.9 2009 3 77.6 2.1 1.3 18.9 2009 Avg. 77 1.8 1.6 19.6 All Avg. 82.6 1.5 1.7 14.1
table entries reflect a link in the topology and are updated frequently enough to be valid.
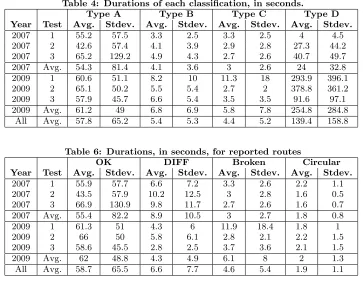
Table 4 shows the average and standard deviation of the duration, in seconds, of routes in each of the four categories. A large portion, over 96% on average, of OLSR’s routes were Type A or D. As previously stated, these are the two desired types of routes. Those of Type B and C have relatively short durations in the 4-6 second range showing that OLSR is fairly quick to update routes in error.
From a user’s or application’s perspective, this data shows that valid routes persisted longer than incorrect routes and most of the routes in the routing table did exist. Also, it shows that incorrect routes and paths that OLSR did not find were short lived and were resolved in a matter of sec-onds. However, the standard deviation values for the dura-tions are close to or larger than the average values, indicating a large amount of variation.
The unexpected part of this data is the amount of discon-nection in the network, indicated by the values in the Type D column. This is especially true for MANIAC09, where al-most 20% of the total possible source/destination pairs were not connected by any path. This data shows that there were a number of node pairs for which there was no connecting route suggesting that nodes were completely detached from the network. This indication further supports our observa-tion that it was difficult to create and maintain a multi-hop MANET with more than just a few hops. We attribute this difficulty to the indoor venues used for the competition and the relatively short communication range of IEEE 802.11 in such conditions. In practice, we found it difficult to maintain a sparse MANET, but found it relatively simple to maintain a dense almost fully-connected mesh.
5.2
Route Correctness
Table 5 shows the percentages of each route type for routes that were found by the routing protocol; these were the routes reported in the nodes’ routing tables. These values were found by comparing the path traversed by a packet with the source’s routing table entry. Table 6 includes the average and standard deviation of the duration, in seconds, of routes organized by type.
[image:5.612.316.557.63.352.2]The percentage of OK routes is very high, over 95%, indi-cating that OLSR did an excellent job of maintaining routes in the network over time. However, this data also shows that, while infrequent, incorrect routes did occur. The dura-tion of these incorrect routes was relatively short, 5 seconds or less. Also, a small percentage of routes, on the order of 0.1%-0.2%, were circular. All standard deviation values for the duration data are close to or above the average value,
Table 5: Percentages of route types Year Test OK DIFF Broken Circular
2007 1 96.9 1.5 1.6 0.1 2007 2 95.1 2.7 2.2 0.1 2007 3 94.6 3 2.3 0.1 2007 Avg. 95.5 2.4 2 0.1 2009 1 95.4 1.2 3.2 0.2 2009 2 97.4 1.5 0.9 0.2 2009 3 97.1 1.2 1.5 0.2 2009 Avg. 96.6 1.3 1.9 0.2 All Avg. 96.1 1.9 2 0.2
30
25
m
e
MANIAC07
MANIAC09
15 20
e
of
T
im MANIAC09
10 15
rcen
ta
g
e
5
Pe
r
0
1 10 100 1000 10000
1 10 100 1000 10000
Duration (sec.)
Figure 1: Distribution of route duration in seconds
indicating that the duration varied widely during the tests. Figure 1 shows the distribution of route duration for these four types of routes. This data shows that while most routes existed for 10 seconds or less, there were a small number of routes that existed for hundreds of seconds.
5.2.1 Level of DIFF-ness
The distribution of difference is shown in Figure 2. This figure shows the distribution of difference for each individual test during the two competitions. Tests from MANIAC07 are denoted M1-Ttest numberand MANAIC09 tests are de-noted the same but prefaced by M2. The average DIFF length, when there was a difference, across all tests was ap-proximately 0.31 for MANIAC07 and−0.06 for MANIAC09. In the context of the entire set of routes, the average value of the reported length minus the actual length for exist-ing routes was 0.0078 for MANIAC07 and−0.001 for MA-NIAC09. From this data, we conclude that a majority, ap-proximately 97%, of the existing route lengths were reported correctly. Those routes that were incorrectly reported varied by level of difference with greater difference being less promi-nent and the overall average reported length was slightly longer than the actual route length. For comparison, the av-erage and standard deviation of the hop count for all nodes is included in Table 7.
informa-Table 4: Durations of each classification, in seconds.
Type A Type B Type C Type D
Year Test Avg. Stdev. Avg. Stdev. Avg. Stdev. Avg. Stdev.
2007 1 55.2 57.5 3.3 2.5 3.3 2.5 4 4.5 2007 2 42.6 57.4 4.1 3.9 2.9 2.8 27.3 44.2 2007 3 65.2 129.2 4.9 4.3 2.7 2.6 40.7 49.7 2007 Avg. 54.3 81.4 4.1 3.6 3 2.6 24 32.8 2009 1 60.6 51.1 8.2 10 11.3 18 293.9 396.1 2009 2 65.1 50.2 5.5 5.4 2.7 2 378.8 361.2 2009 3 57.9 45.7 6.6 5.4 3.5 3.5 91.6 97.1 2009 Avg. 61.2 49 6.8 6.9 5.8 7.8 254.8 284.8
All Avg. 57.8 65.2 5.4 5.3 4.4 5.2 139.4 158.8
Table 6: Durations, in seconds, for reported routes
OK DIFF Broken Circular
Year Test Avg. Stdev. Avg. Stdev. Avg. Stdev. Avg. Stdev.
2007 1 55.9 57.7 6.6 7.2 3.3 2.6 2.2 1.1 2007 2 43.5 57.9 10.2 12.5 3 2.8 1.6 0.5 2007 3 66.9 130.9 9.8 11.7 2.7 2.6 1.6 0.7 2007 Avg. 55.4 82.2 8.9 10.5 3 2.7 1.8 0.8 2009 1 61.3 51 4.3 6 11.9 18.4 1.8 1 2009 2 66 50 5.8 6.1 2.8 2.1 2.2 1.5 2009 3 58.6 45.5 2.8 2.5 3.7 3.6 2.1 1.5 2009 Avg. 62 48.8 4.3 4.9 6.1 8 2 1.3 All Avg. 58.7 65.5 6.6 7.7 4.6 5.4 1.9 1.1
1 8 2
1 4 1.6 1.8
R
outes
1 1.2 1.4
f To
ta
l
R
M1-T1 M1-T2
0.6 0.8 1
n
tag
e o
f
M1-T3 M2-T1
0.2 0.4
Per
ce
n
M2-T2 M2-T3 0
-4 -3 -2 -1 1 2 3
[image:6.612.122.485.64.354.2]Level of Difference (Reported - Actual)
[image:6.612.55.293.375.529.2]Figure 2: Distribution of hop difference
Table 7: Average and standard deviation hop count for each test run
Year Test Avg. Stdev.
2007 1 1.0958 0.5238 2007 2 1.3733 0.5862 2007 3 1.3711 0.6072 2009 1 1.1056 0.4968 2009 2 1.0877 0.5080 2009 3 1.0925 0.4525
tion is used to make routing decisions could problems arise. Ironically, hop count is commonly used by routing protocols themselves, including OLSR, to evaluate and choose which route will be added to a node’s routing table. Whenever hop count information is used to make decisions, the possibility of inaccurate information should be taken into considera-tion. In the case of MANIAC, DIFF routes accounted for 1-3% of the existing route population.
In the cases of both positive and negative DIFF values, the cause is that an intermediate node in the path has been inserted, ifDIF F >0, or removed, ifDIF F <0, from the path. Possible causes of the path change are node movement and change in the interference pattern. Regardless, the in-sertion or removal of a node happened in such a manner that up and downstream nodes’ routes changed such that the entire path was still valid. In the event that a node was added, the inserted node may have already had a route to the destination via the node that is being moved further out. A similar situation occurs when a node is removed, as an intermediate node may simply drop a link to one node in favor of a closer, better node. In both cases, the route to the destination is still valid and functional.
5.3
Route Directionality
Table 8 shows the percentage of each route type that has bidirectional paths. Only OK and DIFF routes were in-cluded because broken and circular routes cannot be bidi-rectional by nature; they are incomplete. Table 9 shows the average and standard deviation of the duration in seconds of bidirectional paths for each route type.
[image:6.612.99.241.624.701.2]Table 8: Percentages of bidirectional routes Year Test OK DIFF
[image:7.612.104.275.60.185.2]2007 1 91.9 63.2 2007 2 88.4 78 2007 3 87 71.8 2007 Avg. 89.1 71 2009 1 83.2 55.6 2009 2 89.2 61.3 2009 3 87.1 69.9 2009 Avg. 86.5 62.3 All Avg. 87.8 66.6
Table 9: Durations, in seconds, of bidirectional routes
OK DIFF
Year Test Avg. Stdev. Avg. Stdev.
2007 1 58.3 58.2 6.6 7.8 2007 2 43.8 55.2 10.3 12.9 2007 3 59.3 105.8 9.2 10.9 2007 Avg. 53.8 73.1 8.7 10.5
2009 1 63 48.1 5 7
2009 2 69.7 50.3 6.2 6.4 2009 3 60.3 44.8 2.7 2.4 2009 Avg. 64.3 47.7 4.6 5.3 All Avg. 59.1 60.4 6.7 7.9
measure of how well OLSR is doing its job. Tables 8 and 9 show the percentage and duration of bidirectional routes during the MANIAC competitions. This data suggests that OLSR was synchronized with the network over 85% of the time, with regard to OK routes. OK routes had an aver-age duration of about a minute. DIFF routes, which are unsynchronized by definition, were less prevalent and had a much shorter duration. This shorter duration shows that OLSR “caught up” to the topology fairly quickly. While OLSR did experience some problems in correctly maintain-ing routes from the perspective of directionality, a majority of the routes were correct and had a reasonable duration.
5.4
Route Symmetry
Table 10 shows the percentage of each route type that has symmetric paths, meaning the forward and reverse paths are composed of the same nodes in reverse order. By definition this is only applicable to OK and DIFF routes. Also be definition, symmetric routes are bidirectional routes, as well. Table 11 shows the average and standard deviation of the duration of symmetric routes, grouped by route type.
Accordingly to the specification [5], OLSR does not guar-antee symmetric routes, so this metric is only informational. From these results, we found that 88% of OK routes were bidirectional and only 79% were symmetric. There was a much larger disparity with DIFF routes where 67% were bidirectional, but only 15% were symmetric. The average duration of OK bidirectional and symmetric routes were similar, differing by less than 10%. The average duration of DIFF routes was about 7 seconds for bidirectional routes and almost twice that for symmetric routes. In both cases, symmetric routes had a longer average duration. This fur-ther strengthens the observation that more correct routes will persist longer than problematic routes.
Table 10: Percentages of symmetric routes Year Test OK DIFF
[image:7.612.53.284.86.341.2]2007 1 85.6 15.2 2007 2 75 31.7 2007 3 73.2 22.1 2007 Avg. 77.9 23 2009 1 77.5 7.2 2009 2 83.6 7.2 2009 3 80.1 5.6 2009 Avg. 80.4 6.7 All Avg. 79.2 14.8
Table 11: Durations, in seconds, of symmetric routes
OK DIFF
Year Test Avg. Stdev. Avg. Stdev.
2007 1 61.7 58.7 12.4 11.1 2007 2 49.4 57.8 18.7 15.9 2007 3 67.8 112.9 14.5 13.1 2007 Avg. 59.6 76.5 15.2 13.4 2009 1 66.5 47.5 10.6 10.7 2009 2 73.6 49.4 13 8.4 2009 3 64.4 44 3.9 2.9 2009 Avg. 68.2 47 9.2 7.3 All Avg. 63.9 61.7 12.2 10.4
6.
CONCLUSIONS
In this paper we introduced categories for grouping and characterizing routes in MANETs. By analyzing the distri-bution and the duration of the routes in these categories, we can evaluate the performance of routing protocols with regard to how well they find and maintain routes. This differs from previous evaluations of routing protocols that were largely based on the performance of the routes that were found.
We applied this work to routing and network topology data from the MANIAC Challenge project, specifically eval-uating the OLSR routing protocol. From this analysis, we made the following observations.
• OLSR found and maintained a large percentage of the available routes and that those that were found were largely valid.
• While most routes were valid, there were a small per-centage of broken and circular (errant) routes. Even though their duration was relatively short, 4-6 seconds, they were observed in practice.
• A small percentage, 1-3% of the reported routes in the network, had incorrectly reported hop counts. This difference ranged from -3 to +3 hops. The duration of these routes were longer than the duration of errant routes, but only 10% of the duration of correct routes.
• Symmetric and bidirectional routes, both correct routes, have longer durations than errant routes with an av-erage of about a minute in length. This information supports the idea that “better” routes have the longest duration of any route type in a MANET.
[image:7.612.316.554.87.357.2]Over-all, we believe that OLSR is successful in accomplishing its stated objectives as a MANET routing protocol.
In conclusion, we believe that a thorough evaluation of MANET routing protocols should augment traditional per-formance metrics with an evaluation of how well a protocol finds and maintains routes in a network. These two eval-uations combined provide a more complete assessment of proactive MANET routing protocols.
7.
ACKNOWLEDGEMENTS
We would like to thank all of the MANIAC participants and the people at Virginia Tech and Bucknell who con-tributed to the MANIAC software. This work was partially supported by the National Science Foundation under Grant No. NSF-0519825.
8.
REFERENCES
[1] G. L. A. Herms and S. Ivanov. Realism in design and evaluation of wireless routing protocols. InMSPE ’06: Proceedings of Workshop on Mobile Services and Personalized Environments. ACM, 2006.
[2] L. Barolli, M. Ikeda, G. D. Marco, A. Durresi, and F. Xhafa. Performance analysis of OLSR and BATMAN protocols considering link quality parameter. InAINA ’09: Proceedings of the 2009 International Conference on Advanced Information Networking and Applications, pages 307–314,
Washington, DC, USA, 2009. IEEE Computer Society. [3] E. Borgia. Experimental evaluation of ad hoc routing
protocols. InPERCOMW ’05: Proceedings of the Third IEEE International Conference on Pervasive Computing and Communications Workshops, pages 232–236, Washington, DC, USA, 2005. IEEE Computer Society.
[4] C. M. T. Calafate, R. G. Garcia, and P. Manzoni. Optimizing the implementation of a MANET routing protocol in a heterogeneous environment. InISCC ’03: Proceedings of the Eighth IEEE International
Symposium on Computers and Communications, page 217, Washington, DC, USA, 2003. IEEE Computer Society.
[5] T. Clausen. and P. Jacquet. Optimized link state routing protocol (OLSR). RFC 3626 (Informational), Oct. 2003.
[6] S. Corson and J. Macker. Mobile ad hoc networking (MANET): Routing protocol performance issues and evaluation considerations. RFC 2501 (Informational), Jan. 1999.
[7] D. S. J. De Couto, D. Aguayo, B. A. Chambers, and R. Morris. Performance of multihop wireless networks: Shortest path is not enough.SIGCOMM Comput. Commun. Rev., 33(1):83–88, 2003.
[8] D. S. J. De Couto, D. Aguayo, B. A. Chambers, and R. Morris. Performance of multihop wireless networks: Shortest path is not enough.SIGCOMM Comput. Commun. Rev., 33(1):83–88, 2003.
[9] R. Draves, J. Padhye, and B. Zill. Comparison of routing metrics for static multi-hop wireless networks. InSIGCOMM ’04: Proceedings of the 2004 Conference on Applications, Technologies, Architectures, and Protocols for Computer Communications, pages 133–144, New York, NY, USA, 2004. ACM.
[10] R. S. Gray, D. Kotz, C. Newport, N. Dubrovsky, A. Fiske, J. Liu, C. Masone, S. McGrath, and
Y. Yuan. Outdoor experimental comparison of four ad hoc routing algorithms. InMSWiM ’04: Proceedings of the 7th ACM International Symposium on Modeling, Analysis and Simulation of Wireless and Mobile Systems, pages 220–229, New York, NY, USA, 2004. ACM.
[11] A. Hilal, J. N. Chattha, V. Srivastava, M. S. Thompson, A. B. MacKenzie, L. A. DaSilva, and P. Saraswati. CRAWDAD data set VT/MANIAC (v. 2008-11-01).
http://crawdad.cs.dartmouth.edu/vt/maniac, Nov. 2008.
[12] M. Ikeda, L. Barolli, M. Hiyama, G. D. Marco, T. Yang, and A. Durresi. Performance evaluation of link quality extension in multihop wireless mobile ad-hoc networks.Complex, Intelligent and Software Intensive Systems, International Conference, pages 311–318, 2009.
[13] Y. Lin, A. H. M. Rad, V. W. S. Wong, and J.-H. Song. Experimental comparisons between SAODV and AODV routing protocols. InWMuNeP ’05:
Proceedings of the 1st ACM workshop on Wireless Multimedia Networking and Performance Modeling, pages 113–122, New York, NY, USA, 2005. ACM. [14] A. B. MacKenzie and L. A. DaSilva. MANIAC
challenge website. http://www.maniacchallenge.org. [15] M. K. Marina and S. R. Das. Routing performance in
the presence of unidirectional links in multihop wireless networks. InMobiHoc ’02: Proceedings of the 3rd ACM International Symposium on Mobile Ad Hoc Networking and Computing, pages 12–23, New York, NY, USA, 2002. ACM.
[16] T. Plesse, C. Adjih, P. Minet, A. Laouiti, A. Plakoo, M. Badel, P. Muhlethaler, P. Jacquet, and J. Lecomte. OLSR performance measurement in a military mobile ad hoc network.Ad Hoc Netw., 3(5):575–588, 2005. [17] R. Prakash. Unidirectional links prove costly in
wireless ad hoc networks. InDIALM ’99: Proceedings of the 3rd International Workshop on Discrete Algorithms and Methods for Mobile Computing and Communications, pages 15–22, New York, NY, USA, 1999. ACM.
[18] V. Srivastava, A. B. Hilal, M. S. Thompson, J. N. Chattha, A. B. MacKenzie, and L. A. DaSilva. Characterizing mobile ad hoc networks: The MANIAC challenge experiment. InWiNTECH ’08: Proceedings of the third ACM International Workshop on Wireless Network Testbeds, Experimental
Evaluation and Characterization, pages 65–72, New York, NY, USA, 2008. ACM.
[19] M. S. Thompson, A. E. Hilal, A. S. Abdallah, L. A. DaSilva, and A. B. MacKenzie. The MANIAC challenge: Exploring MANETs through competition. InModeling and Optimization in Mobile, Ad Hoc and Wireless Networks (WiOpt), 2010 Proceedings of the 8th International Symposium on, pages 443–452, May 2010.