Negative Equity in the Irish Housing Market: Estimates Using
Loan Level Data
David Duffy, ESRI and Niall O’Hanlon, CSO
Abstract
: The sharp decline in house prices since 2007 has led to the emergence of
widespread negative equity in Ireland. For a large sample of borrowers in negative
equity the paper provides details on the characteristics of the borrowers and their
mortgages by analysing loans taken out to purchase a primary residence in the
period 2005 to 2012. The emergence of negative equity is not just about price drops.
Loan characteristics such as the loan-to-value ratio and the length of the mortgage
term also have a role to play. The analysis finds the situation in Ireland to be much
more severe than that being experienced in other housing market downturns at
present, with 64 per cent of borrowers from the period 2005-2012 in negative
equity. Analysis by age gives rise to concern, with the majority of those in negative
equity aged under 40 years. Traditionally, this is the age group most active in the
housing market. The paper also points to the large wealth loss, in the order of €43
billion, experienced by Irish households as a result of the fall in prices. With only
moderate house price growth expected in the years ahead there is a generation of
mortgage borrowers whose housing market experience will have been
overwhelmingly negative and who will remain in negative equity for some time.
Corresponding Author: david.duffy@esri.ie
* We are grateful to John Walsh ESRI for his assistance with SAS, Alan Barrett and Pete Lunn, ESRI, participants at the Central Bank Mortgage Conference, October 2011 and an internal ESRI seminar for helpful comments and suggestions.
ESRI working papers represent un-refereed work-in-progress by researchers who are solely responsible for the content and any views expressed therein. Any comments on these papers will be welcome and should be sent to the author(s) by email. Papers may be downloaded for personal use only.
Negative equity in Ireland: Estimates using Loan Level Data
1.
Introduction
The sharp decline in residential property prices since 2007 has led to the emergence of widespread negative equity in Ireland. Indeed, the incidence appears to be much worse than has been experienced in other economies. Negative equity occurs when the price of a property falls below the value of the outstanding mortgage secured on that property. As well as impacting on the financial wellbeing of households affected, it can also have implications for financial stability and even monetary policy (Hellebrandt et al. 2009).
Early estimates for Ireland have had to use aggregate published data to estimate the total number of borrowers affected and the total value of negative equity1. For example, Duffy
(2010) estimated that there were 196,000 borrowers in negative equity at the end of 2010. In recent times a number of different loan level datasets have become available, enabling a micro analysis of the issue; for example, see Kennedy and McIndoe-Calder (2011). This paper aims to extend the existing analysis of those in negative equity by providing further detail on the characteristics of borrowers and of their mortgages by analysing loans taken out to purchase a primary residence in the period 2005 to 2012. We look at who have negative equity and the extent of that negative equity.
As negative equity has become more widespread, many of its wider effects impact on the economy via the indebted home owner. Households in negative equity may consume less as they feel less wealthy but also feel that they no longer have access to funds through housing equity (Disney et al. 2010). In an Irish context, Gerlach-Kristen (2013) finds that the extent of negative equity in Ireland is having an impact on consumption, particularly by younger households. Negative equity is also associated with lower mobility in the housing market (Henley, 1998, Ferreira et al., 2008, Gyourka and Siaz, 2003).2 It is also associated with
mortgage default, although by itself negative equity does not cause problems repaying a mortgage (Foote et al., 2008, 2009). However, Ghent and Kudlyak (2010), examining mortgage defaults across US states with both recourse and non-recourse3 borrowing, find
that recourse borrowing decreases the probability of default, even if the borrower is in negative equity.
The on-going debate as to what measures can be taken to assist struggling mortgage holders can be informed by greater detail about those in negative equity. It is important to understand who has been affected and how they have been affected. Other papers show the role that mortgage characteristics have on the likelihood of being in negative equity. This
paper adds to the existing analysis by showing who has negative equity – in different regions, different age-groups, by year of purchase and by initial loan-to-value ratio. Knowing who has negative equity helps to understand where we might find reduced consumption and household mobility.
The emergence of negative equity is not just about price drops. Loan characteristics such as the initial loan-to-value ratio and the length of the mortgage term also have a role to play. As part of our analysis we examine not only how these characteristics contribute to negative equity but also how have changed since the peak of the market. We find that loan terms and loan-to-value ratios have fallen as access to credit becomes tighter.
The paper is structured as follows: in the next section we provide details of the dataset on which the analysis is based. Section 3 examines the evolution of the Irish housing and mortgage market over the course of the boom and bust. In Section 4 we set out how we estimate negative equity, and in Section 5 we examine the incidence of negative equity and the role played by mortgage characteristics. In Section 6 we analyse the characteristics of borrowers in negative equity. Section 7 estimates the negative wealth effect caused by the fall in Irish house prices, while Section 8 provides an estimate of the number of households in negative equity. Section 9 presents our concluding comments.
2.
The Dataset
The data are drawn from monthly mortgage returns submitted by eight of the main mortgage lenders in Ireland to the Department of Environment, Heritage and Local Government (DoEHLG) under the Housing (Miscellaneous Provisions) Act of 2002 and to the Central Statistics Office. Unfortunately data is not available for two lenders who were prominent in the Irish market during the early period under observation. The returns contain data on both mortgage approvals (occurring where a formal letter of mortgage offer has issued) and mortgage drawdowns (where the loan has been drawn down – i.e. the transaction completed). The data should consist of an individual record for every loan approval and loan drawdown made by the lender in the reference month. However in practice not all mortgages are reported either because certain banks did not report or reporting banks did not provide usable records for every drawdown.
This study is confined to mortgages for the purchase of primary residences only. These mortgages accounted for just over 50 per cent of all mortgages drawdown between 2005 and 2012. Mortgage top-ups, mortgages for investment or second homes and mortgages for the purchase of local authority housing are excluded. It is likely that a significant number of these mortgages are also affected by negative equity; however they are outside the scope of this study.
The original dataset used for this study covers the period January 2005 to December 2012 and amounted to almost 165,700 individual records, representing almost 50 per cent of the value and volume of the overall mortgage market for primary residences, as reported by the Irish Banking Federation. The purchase price of property was clearly recorded incorrectly in a small number of cases. A simple threshold edit on purchase prices could not be applied however as the highly heterogeneous nature of residential property means that large variations in prices between different property times are expected. Instead, erroneous values for the purchase price of properties were identified by using a simple regression of the log of price against year of purchase, region of property, house or apartment, new or second hand property and buyer type (first time, assisted, previous owner). Records with very large studentized residuals were excluded from the subsequent analysis. This amounted to just over 800 records (or 0.5%). A further 0.5% of records were removed due to spurious values for loan terms and very implausible relationships between loan terms and the age profile of borrowers. A number of other edits were imposed. After data cleaning and taking account of the exclusions outlined above the final dataset for our analysis amounted to over 162,500 cases.
3.
The Evolution of the Irish Housing/Mortgage Market
Accompanying Ireland’s economic boom the Irish housing market grew significantly over the period 1997 to 2007. This growth, apart from a short interruption in 2001, is reflected not only in house prices but also in other indicators. For example, Department of Environment statistics show that the number of mortgage loans paid in a single year rose to over 111,000 in 2006, compared to a level of around 57,000 in 1996. Between 2000 and 2008 over 760,700 mortgages were issued. Accompanying this was a large increase in the level of residential mortgage debt outstanding, from close to €14 billion in December 1996 to nearly €148 billion in December 2008.4
The housing market boom also saw financial product development which encouraged or facilitated homeownership. Tracker mortgages were introduced5. Mortgage products with
terms longer than the traditional 20 years were introduced. Loan-to-value (LTV) ratios6
began to increase and borrowers were able to access 100 per cent mortgages compared to the previous maximum of 92 per cent for most borrowers. Interest only mortgages were also introduced. Finally, lenders began to target the subprime mortgage sector. Lending criteria moved from income multiples to a limit based on the ratio of mortgage service cost to income. Addison-Smyth et al, (2009) model the availability of mortgage credit and find
evidence of excess credit7 in the Irish market, especially since 2004, contributing to the rise
in house prices. Ellis (2008a) attributes some of the blame for the rise in the number of borrowers in negative equity to the easing of lending standards that occurred there.
The current situation is now very different to the experience of the boom. House prices have declined substantially, mortgage lending volumes are now much lower and credit conditions have been tightened. In addition, housing market activity has been adversely affected by income cuts, higher taxation and rising unemployment.
According to Ellis (2008b) the characteristics of the borrowers mortgage have an important role in determining if they end up in negative equity, with negative equity depending on:
• initial equity, determined by the LTV ratio;
• the equity built up by housing price appreciation between the start of the mortgage and the peak of housing prices;
• any reduction in principal via repayment since the loan was taken out.
In addition the repayment type determines how quickly the principal is repaid. Ellis (2008a) argues that, in part, the depth of the housing downturn in the US was caused by an easing of lending standards. This included the use of second mortgages, (resulting in higher overall LTV ratios), higher initial LTV ratios on new mortgages, and the availability of 100 per cent mortgages. Furthermore, the introduction of interest only8 mortgages meant that not only
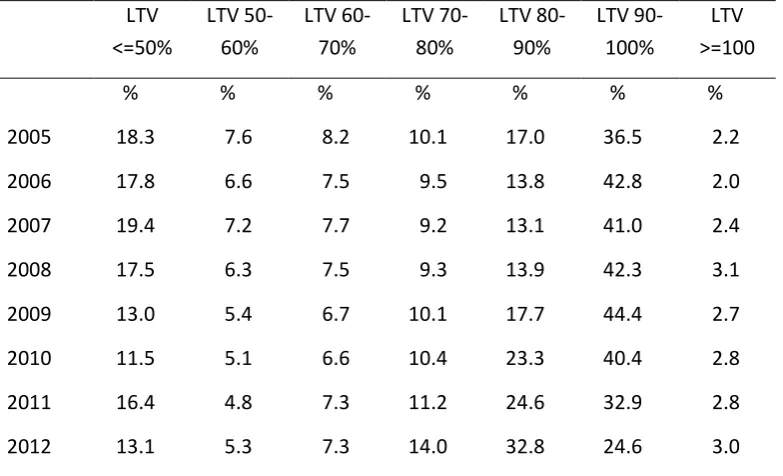
were initial LTV ratios high, but they stayed high on an ongoing basis. Looking at these variables for the dataset points to the role these variables may have played in an Irish context. Table 1 shows the distribution of LTVs by year of mortgage drawdown.
7Excess credit is considered to occur when the actual mortgage level is above the long-run mortgage
level.
8An interest only mortgage means that the borrower does not repay any of the principal but instead
Table 1: Distribution of Loan-to-Value ratios by year of mortgage drawdown LTV
<=50%
LTV 50-60%
LTV 60-70%
LTV 70-80%
LTV 80-90%
LTV 90-100%
LTV >=100
% % % % % % %
2005 18.3 7.6 8.2 10.1 17.0 36.5 2.2
2006 17.8 6.6 7.5 9.5 13.8 42.8 2.0
2007 19.4 7.2 7.7 9.2 13.1 41.0 2.4
2008 17.5 6.3 7.5 9.3 13.9 42.3 3.1
2009 13.0 5.4 6.7 10.1 17.7 44.4 2.7
2010 11.5 5.1 6.6 10.4 23.3 40.4 2.8
2011 16.4 4.8 7.3 11.2 24.6 32.9 2.8
2012 13.1 5.3 7.3 14.0 32.8 24.6 3.0
Source: Own estimates based on CSO data
Analysis of the data shows that median loan-to-value ratios rose from 85 per cent in 2005 to 89 per cent in the following year. Median loan to value ratios of 90 per cent persisted into 2009 and 2010, despite rapidly falling prices. This appears to be the result of higher LTV ratios for repeat buyers who, at a time when house prices were declining and the overall housing market was weak, may have been taking out higher mortgages to compensate for lower housing equity. However, median LTV ratios declined to 87 per cent in 2011, and have stabilized around this level, possibly reflecting tighter credit conditions.
Table 2: Initial mortgage term by year of drawdown, % of mortgages each year
2005 2006 2007 2008 2009 2010 2011 2012
% of mortgages each year
<= 20 yrs 20.3 15.0 16.8 15.8 15.8 15.9 21.8 22.0 21-25 yrs 22.2 16.1 15.6 15.9 16.0 16.8 19.3 21.5 26-30 yrs 31.7 29.3 23.4 22.8 24.4 24.1 29.1 28.7 31-35 yrs 25.8 39.6 44.0 40.2 40.9 42.0 29.8 27.8
36 yrs + 0.0 0.0 0.2 5.2 2.9 1.2 0.1 0
Total 100.0 100.0 100.0 100.0 100.0 100.0 100.0 100.0
Source: Own estimates based on CSO data
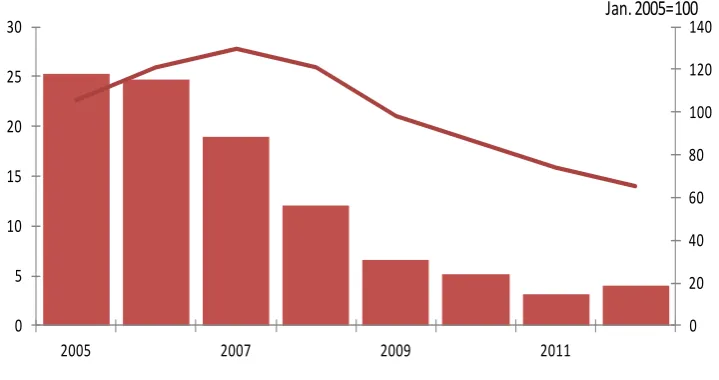
When the mortgage was drawn down can also affect whether or not the borrower is in negative equity. Just over 65 per cent of the mortgages in our sample were taken out before peak of the CSO Residential Property Price Index in September 2007.
Figure 1: Irish house prices and distribution of mortgages by year of drawdown
Source: Own estimates based on CSO data
4.
How we estimate negative equity
Negative equity occurs when the value of a property falls below the balance of the mortgage secured against the property. Thus, in order to determine if a borrower is experiencing negative equity we need to estimate the current value of the property and the current
0 20 40 60 80 100 120 140
0 5 10 15 20 25 30
2005 2007 2009 2011
Mortgages Residential Property Price Index - all
[image:7.595.115.475.419.609.2]mortgage balance. The dataset provides a substantial amount of information on the loan taken out by the individual. For example, the type of mortgage, the initial interest rate and the type of interest rate, as well as the initial loan amount and the month of mortgage drawdown. This enables us to calculate the remaining balance at the end of 2012 using a standard annuity formula:
R=P[i(1+i)n]/[(1+i)n-1]
where R is the mortgage repayment, P is the initial loan amount, i is the mortgage interest rate, and n is the mortgage term.
In doing so we have to make a number of assumptions. Firstly, while we have the initial interest rate we do not have details of the interest rate path followed by the mortgage. Therefore we assume that the interest rate for subsequent months is the representative mortgage interest rate as published by the Central Statistics Office. For those on fixed mortgages once the fixed term finishes we assume that the mortgage reverts to a standard variable rate mortgage, again using the representative mortgage interest rate as published by the CSO. We assume that borrowers are making full payments, there are no arrears and borrowers have not released any equity from their property as the available dataset does not have information on the repayment history of borrowers. Research using an alternative loan level dataset for the Irish mortgage market shows that of the mortgage properties found to be in negative equity, 8 per cent had also accrued more than three months worth of arrears on their mortgage books, (Kennedy and McIndoe-Calder 2012). In addition it is worth noting that Central Bank data on mortgage restructuring shows that in December 2011, 79,852 mortgages had been restructured, 10.1 per cent of the total number of residential mortgage loans outstanding (Central Bank, 2013).
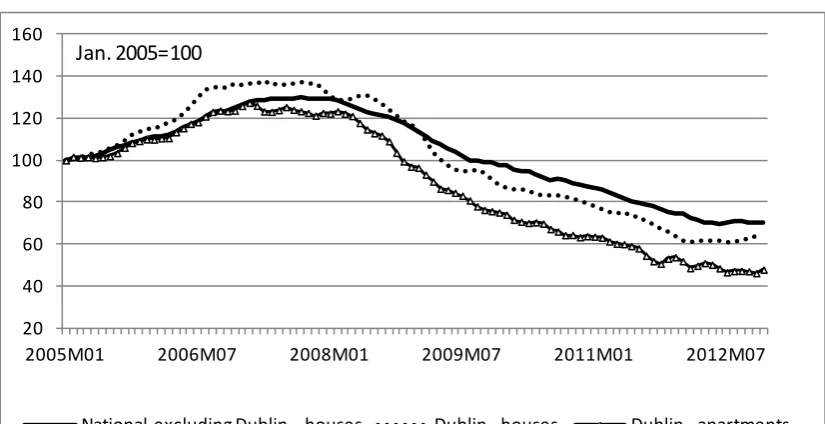
Figure 2: Residential property price trends in Ireland, 2005 to end-2012
Source: CSO, Residential Property Price Index
5.
The Incidence of Negative Equity
We can estimate the numbers who are in negative equity from the pool of borrowers who took out mortgages for primary residential properties between the beginning of 2005 and the end of 2012. This is done by weighting the loan level data to the total number of mortgages for purchases of primary residences as reported by the Irish Banking Federation. Our analysis suggests that approximately 214,000 mortgages drawn down since 2005 are in negative equity. This estimate is higher than some other estimates that have been published for the Irish market using alternative loan level data. Our higher estimate probably reflects a number of factors. The data set used to produce this current estimate is for the period immediately prior to the peak in house prices and the subsequent crash, i.e. from 2005 to 2012. Other estimates calculate negative equity as a proportion of the stock of all outstanding mortgages and so would include mortgages drawn down before 2005. In addition, our estimates are based on a period when the Irish mortgage market experienced competition and product innovation, for example the introduction of interest only mortgages or mortgages with a 100 per cent loan-to-value ratio.
The data allows us to examine the different key factors outlined above that contribute to the incidence of negative equity as well as provide some insights into who is experiencing negative equity.
20 40 60 80 100 120 140 160
2005M01 2006M07 2008M01 2009M07 2011M01 2012M07
National excluding Dublin - houses Dublin - houses Dublin - apartments
The Role played by Timing of Purchase
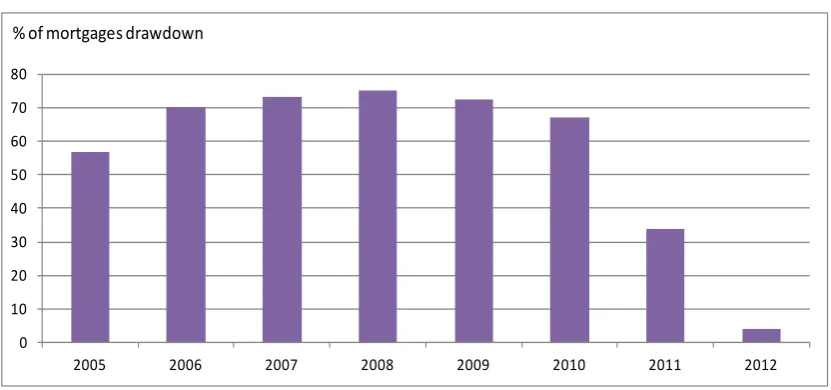
[image:10.595.90.506.388.583.2]A key factor is when the property was purchased, in other words how close to the peak in property prices did the buyer take out a mortgage. Figure 3 shows the proportion of mortgages in negative equity by the year in which they were drawn down. Those who borrowed towards the end of the boom and close to the peak in house prices are more likely to be experiencing negative equity, with 70 per cent or over of mortgages drawn down in each year between 2006 and 2009 in negative equity. The extent of house price falls means that some mortgages taken out since the downturn are in negative equity, for example, over 67 per cent of those drawn down in 2010 and over 34 per cent of mortgages drawn down in 2011 were already in negative equity by the end of 2011. The slower pace of price decline in 2012, coupled with some month-on-month increases in the latter half of the year means that just 4 per cent of mortgages drawn down in 2012 were in negative equity by the end of the year. In the UK negative equity cases are more concentrated in one year, 2007, with nearly 30 per cent of mortgages in negative equity drawn down in 2007, while mortgages drawn down in 2006 and 2008 each account for between 10-15 per cent of cases, (Purdey 2011).
Figure 3: Mortgages in Negative Equity by Year of Drawdown
Source: Own estimates based on CSO data
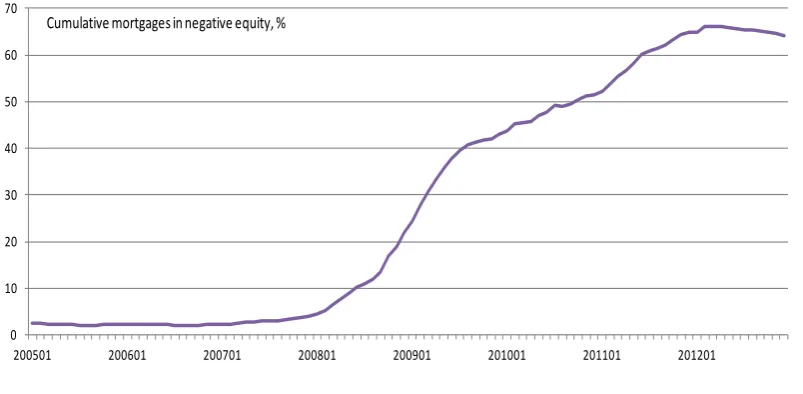
Figure 4 shows the cumulative numbers in negative equity as a proportion of the cumulative mortgages drawn down. The incidence of negative equity increased substantially between the beginning of 2008 and the second half of 2009. The numbers of those experiencing negative equity continued to rise, although the pace of the increase is not as rapid. The
0 10 20 30 40 50 60 70 80
2005 2006 2007 2008 2009 2010 2011 2012
Figure 4: Numbers in negative equity, cumulative January 2005 – December 2012, as a % of cumulative mortgages drawdown to that date
Source: Own estimates based on CSO data
The Impact of the Initial Loan-to-Value ratio
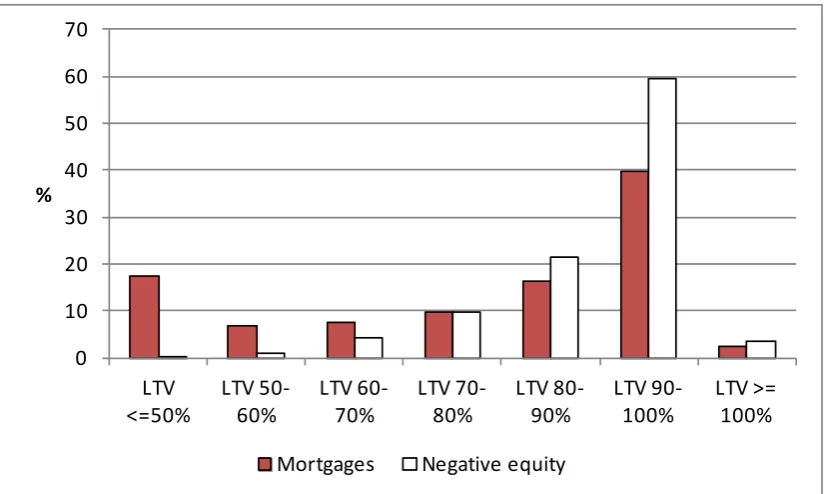
In Figure 5 we show the distribution of mortgages and the distribution of borrowers who purchased between January 2005 and December 2012 who are in negative equity in December 2012 distributed by their initial loan-to-value ratio. Unsurprisingly, borrowers with higher initial loan-to-value ratios are more likely to have negative equity, as found by Ellis (2008a) using US mortgage data. The depth of the housing market decline is such that, based on the data available to us, a small proportion of mortgages with an initial LTV of 50 per cent or less are now in negative equity.
0 10 20 30 40 50 60 70
Figure 5: Distribution of mortgages and negative equity by initial loan-to-value ratio, %.
Source: Own estimates based on CSO data
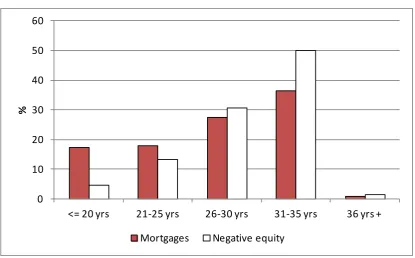
The Influence of Mortgage Term
The pace at which the mortgage is repaid is at least in part determined by the mortgage term. Mortgages with a longer term repay the principal at a slower pace. Figure 6 shows the distribution of borrowers in negative equity by the length of the original mortgage. Nearly 50 per cent of those in negative equity have a mortgage term between 31 and 35 years. The role that mortgage term plays is further confirmed when we look at the proportion within each mortgage term in negative equity. Just over 17 per cent of those who took out a 20 year mortgage are in negative equity. In contrast, nearly 88 per cent of borrowers who took out a mortgage with a term of between 31 and 35 years are now in negative equity.
0 10 20 30 40 50 60 70
LTV
<=50% LTV 50-60% LTV 60-70% LTV 70-80% LTV 80-90% LTV 90-100% LTV >= 100%
%
Figure 6: Distribution of mortgages and negative equity by original mortgage term, %
Source: Own estimates based on CSO data
6.
Who has Negative Equity
Negative Equity and Buyer Type
Micro-data allows us to examine the incidence of negative equity by type of buyer. The housing boom in Ireland lead to a diversity of buyer types beyond the traditional first-time buyer (FTB) and previous owner. For some joint loans, one applicant may be a FTB, while the other applicant may have already purchased a dwelling. In addition, there may be buyers who had previously owned but are now buying again, returning to home-ownership from a different tenure. In the above cases, these borrowers may have some equity to put towards the purchase of their property and so will be different to “new” FTBs. There were also assisted FTBs, those who benefited from assistance from a relative or third party, either direct financial assistance or indirectly through a joint mortgage or through the parent acting as guarantor. The need to take account of a greater range of buyer types is not unique to Ireland. For example, recent analysis by the Council of Mortgage Lenders (2011) in the UK distinguishes between first-time buyers and assisted first-time buyers. Based on our dataset the incidence of “assisted” FTBs is much lower than that of the UK, with just over 7 per cent of FTBs being formally identified as having received assistance via a joint mortgage or guarantor. Analysis of the loan level data shows that the mortgage characteristics of Assisted FTBs are very similar to “new” FTBs. For example, over the period, both new and assisted FTBs took out mortgages with an average term of approximately 31 years, while repeat buyers had a shorter average term of approximately 25 years.
0 10 20 30 40 50 60
<= 20 yrs 21-25 yrs 26-30 yrs 31-35 yrs 36 yrs +
%
The data shows that first-time buyers are more likely to be in negative equity, over 79 per cent of first-time buyers between 2005 and 2012. This compares to just over 47 per cent of previous owners. Joint applications where one of the borrowers is an FTB and the other is a previous owner are also likely to be in negative equity, just over 79 per cent, similar to first-time buyers.
Negative equity and Borrower Age
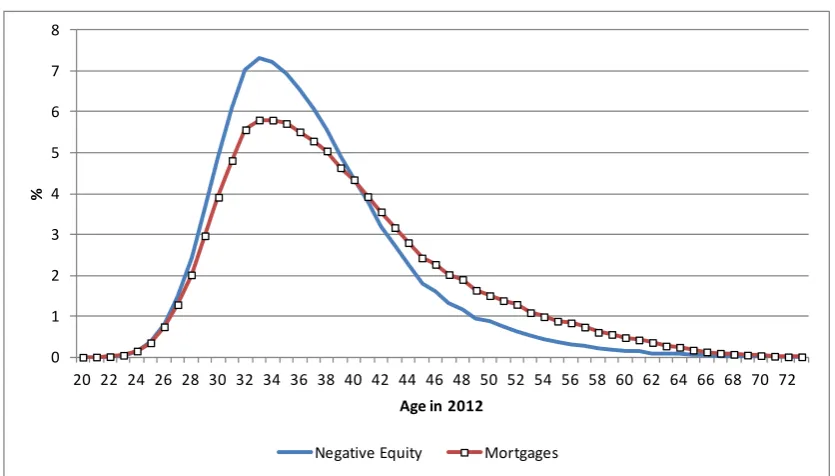
[image:14.595.89.507.433.671.2]There are concerns that the widespread negative equity is being experienced by young borrowers who had entered the housing market in the years immediately leading up to the house price peak. As the micro-data contains details of age at time of drawdown we are able to calculate the age of the borrower in 2012. Thus, Figure 7 shows the distribution of mortgages and the incidence of negative equity by the current age of the main borrower. Just over 63 per cent of those who took out a mortgage between 2005 and the end of 2012 are now aged less than 40 years. These younger borrowers are much more likely to be experiencing negative equity, with 76 per cent affected, corresponding to two thirds of all permanent private households living in own accommodation with a mortgage or loan attached to it. They also account for almost 78 per cent of the total amount of negative equity accruing from mortgages for purchases of primary residences drawn down during the period under observation.
Figure 7: Distribution of mortgages and negative equity by age in 2012, %
Source: Own estimates based on CSO data
0 1 2 3 4 5 6 7 8
20 22 24 26 28 30 32 34 36 38 40 42 44 46 48 50 52 54 56 58 60 62 64 66 68 70 72
%
Age in 2012
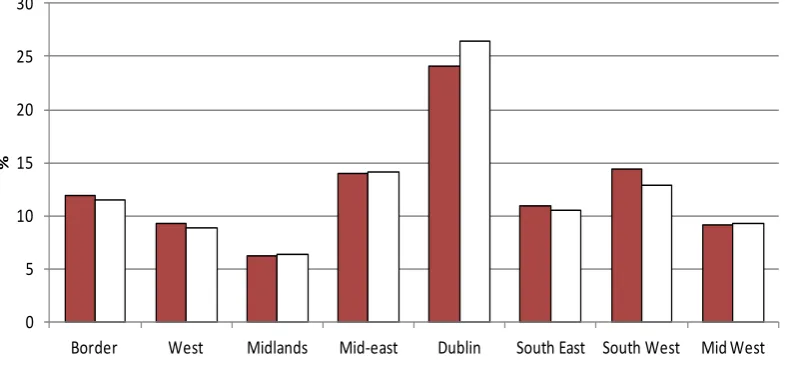
Regional distribution of negative equity
Figure 8 shows the distribution of mortgages and negative equity by region. The distributions are closely aligned, suggesting that no particular region has been affected in adverse proportion to the share of mortgages in the region taken out between 2005 and 2012, except perhaps Dublin which accounts for 24 per cent of mortgages, but 26.4 per cent of borrowers in negative equity. This contrasts with finding in the UK showing a strong geographic dimension to the incidence of negative equity (Purdey 2011).
[image:15.595.105.498.345.535.2]Looking at the proportion of mortgages within a region that are in negative equity shows that for most regions over 60 per cent of the mortgages taken out between 2005 and 2012 are now in negative equity, with Dublin the worst hit with over 70 per cent of mortgages from that period in negative equity. The region with the lowest proportion is the South West, with 58 per cent, although this still represents a very high proportion of mortgages.
Figure 8: Distribution of mortgages and negative equity by region, %
Source: Own estimates based on CSO data
Depth of negative equity
Much of the attention to date has been on those who are in negative equity, regardless of the depth of the negative equity. In Table 3 we show the extent of equity, both positive and negative, for those who took out their mortgage between 2005 and 2012. As before, approximately 64 per cent are in negative equity. Over 1 in five of mortgage borrowers since 2005 is in negative equity that is above €75,000. In addition to those in negative equity, UK research suggests that there is another group to consider, those in “insufficient” equity (Thomas, 1996, Tatch, 2009). Mortgage borrowers in “insufficient” equity are still in positive equity but do not have sufficient positive equity to move house without borrowing
0 5 10 15 20 25 30
Border West Midlands Mid-east Dublin South East South West Mid West
%
additional funds. Assuming a 10 per cent deposit requirement, and taking account of stamp duty, estate agency and legal fees, we estimate that these costs would amount to approximately €25,000. Based on these moving costs, we estimate that an additional 9.3 per cent of borrowers do not have sufficient funds to move house as the equity they hold is insufficient to finance a move, see Table 3. Analysis of the extent of negative equity by buyer type shows that, again, assisted FTBs show a distribution that is similar to new FTBs and markedly different to repeat buyers, with approximately one in three new or assisted FTBs in negative equity greater than €75,000, compared with 15 per cent of repeat buyers.
Table 3: Housing equity, % of borrowers, 2005-2012 % Positive equity, >€75,000 14.9 Positive equity, €50-75,000 5.1 Positive equity, €25-50,000 6.5 Positive equity, €0-25,000 9.3 Negative equity, €0 to -€25,000 12.9 Negative equity, -€25 to -€50,000 15.0 Negative equity, -€50 to -€75,000 13.7 Negative equity, >-€75,000 22.6
Source: Own estimates based on CSO data
Even though we have produced our estimate of the number in negative equity this estimate is dependent on the data we have and the assumptions we have made. Our estimate of approximately 214,000 mortgages in negative equity is based on data from 2005 to 2012. Kennedy and McIndoe-Calder (2011), also using loan level data find that nearly 90 per cent of mortgages in negative equity were taken out after 2005. If we assume a similar distribution then the total number of the mortgage stock in negative equity could be close to 238,000.
pace, for example, moving to interest only repayment, a reduced payment, term extension, arrears capitalization, or a payment moratorium.
7.
Falling House Prices and Wealth Loss
While the main focus of this paper is on the issue of negative equity the data allows us to draw attention to an additional, related issue. The occurrence of negative equity implies that a borrower has seen the value of their loan exceed any equity they might have. However the majority of mortgage financed transactions are not financed in full by the mortgage. An additional payment, often referred to as a deposit and constituting the difference between the transaction price and the mortgage, is also required. Such payments can be funded via savings, equity release by the sale or remortgage of other property, gifts or non-mortgage borrowing. By taking account of these deposits (i.e. estimating the difference between current value and original purchase price rather than the outstanding mortgage principal) we can estimate the loss of wealth directly associated with falling residential property prices. The total loss amounts to just under €43 billion. Interestingly when we examine the distribution of loss by age we can see that it is more evenly distributed among age groups than negative equity, reflecting the lower loan to value ratios for mortgages drawn down by older borrowers.
[image:17.595.91.465.418.637.2]
Table 4: Amount of wealth loss by age and year of drawdown (age is current age) under
30 years 30-39 years
40-49 years
50-59 years
60 plus years
2005 -234 -4,341 -3,226 -1,202 -323
2006 -693 -6,086 -3,739 -1,352 -304
2007 -923 -5,135 -2,722 -1,069 -245
2008 -863 -3,339 -1,608 -560 -126
2009 -392 -1,130 -492 -161 -24
2010 -233 -573 -244 -74 -8
2011 -65 -170 -77 -19 -2
2012 -4 -8 -4 -1 0
Total -3,478 -21,191 -12,355 -4,535 -1,057 Distribution by
age group 8.2 49.7 29.0 10.6 2.5
Source: Own estimates based on CSO data
8.
Number of Households in Negative Equity
with a mortgage or loan attached to it9. We estimate in turn, that these 214,000 mortgages
had €14.3 billion of negative equity associated with them at the end of 2012.
The publication of the Census 2011 volume The Roof over our Heads – Housing in Ireland
[image:18.595.91.445.346.586.2]allows us to provide an estimate of the number of households in negative equity by the age of the household reference person. Overall nearly one in five of households with a mortgage are in negative equity. Table 5 confirms the earlier finding that it is the younger age groups who are more likely to be experiencing negative equity. Close to 14 per cent of households where the head of household is aged under 30 years are in negative equity – these households account for just 6 per cent of households with a mortgage. In addition, 62 per cent of households where the head of household is aged between 30 and 39 years are in negative equity, while these households account for 34 per cent of households with a mortgage.
Table 5: Estimated number of households in negative equity
Households Households % of
Number in negative
equity
9.
Concluding Comments
Using loan level data from the period 2005 to 2012 this paper provides an estimate for the proportion of these loans in negative equity. The analysis finds that, in common with the international evidence, the characteristics of the original mortgage (LTV ratio, mortgage term) are very important in determining if a borrower will experience negative equity as house prices start to fall.
On the basis of the above analysis the situation in Ireland is much more severe than that being experienced in other housing market downturns at present. Recent analysis, (Purdey 2011), finds that fewer than 8 per cent of those in the UK with a mortgage had some negative equity in the first quarter of 2011. However, house prices in the most of the UK did not experience as large a decline as in Ireland and there has been some recovery in UK house prices. The IMF (2012) report that the proportion of mortgage loans in negative equity in Iceland peaked at 38 per cent in 2010. In the United States it is estimated that 22.8 per cent of residential properties with a mortgage were in negative equity at the end of the fourth quarter of 2011 (CoreLogic, 2012). Overall the numbers in negative equity in Ireland began to grow strongly from quarter 2, 2007, the period during which the CSO Residential Property Price Index shows its peak. We estimate that over 214,000 mortgages from the period 2005 to 2012 are in negative equity, approximately 37 per cent of households with a mortgage. While more recent data shows some stabilization in house prices, worries about the impact of and the depth of negative equity remain.
Use of loan level data allows us to examine some of the characteristics of those in negative equity. What we find is that those first-time buyers who got assistance to purchase a dwelling during the boom have a similar experience of the depth of negative equity as FTBs who purchased without assistance. This reflects the fact that even with assistance that group of FTBs took out mortgages similar in characteristic to “new” FTBs.
The wealth loss experienced by Irish households is substantial, estimated at almost €43 billion, indicating that the impact of the price crash is much broader than negative equity. Households still in positive equity may also be experiencing effects similar to those in negative equity due to the loss in wealth. For example, they may feel the need to increase savings to compensate for the decline in equity. Data permitting this would be an interesting area for future research.
References
Addison-Smyth, D., McQuinn, K. & O'Reilly, G. (2009) "Modelling Credit in the Irish Mortgage Market," The Economic and Social Review, Economic and Social Studies, vol. 40(4), pages 371-392.
Central Bank, 2013, Residential Mortgage Arrears, Restructures and Repossessions Statistics: Q4 2012, 7 March.
Central Statistics Office, (2012), Profile 4: The Roof over our Heads – Housing in Ireland.
CoreLogic (2012) CoreLogic reports negative equity increase in Q4 2011, Press release March 1st.
Council of Mortgage Lenders (2011) First-time buyers and affordability: a fresh perspective,
CML News and Views, Issue no. 24, December.
Disney, R., Gathergood, J. & Henley, A. (2010) House Price Shocks, Negative Equity and Household Consumption in the United Kingdom, Journal of European Economic Association,
Vol. 8, Issue 6, December.
Ellis, L., (2008a) “The housing meltdown: Why did it happen in the United States” Bank for International Settlements Working Papers No. 259, September.
Ellis, L., (2008b) “How many in negative equity? The role of mortgage contract characteristics”, Bank for International Settlements Quarterly Review, December.
Ferreira, F., Gyourko, J. & Tracy, J. (2008) “Housing Busts and Household Mobility” National Bureau of Economic Research Working paper 14310, September.
Foote, C.L., Gerardi, K. & Willen, P.S. (2008) Negative Equity and Foreclosure: Theory and Evidence, Federal Reserve Bank of Boston Public Policy Discussion Papers No.08-3, June. Foote, C., K. Gerardi, L. Goette and P. Willen, (2009), Reducing Foreclosures: No Easy Answers, NBER Working Paper 15063, June.
A. C. Ghent & M. Kudlyak, (2011), "Recourse and Residential Mortgage Default: Evidence from US States" Review of Financial Studies, Society for Financial Studies, vol. 24(9).
Gyourko, J., & Saiz, A. (2003) “Urban Decline and Housing Reinvestment: the role of construction costs and the supply side”, Federal Reserve Bank of Philadelphia Working Paper no. 03-9, May.
Hellebrandt, T., Kawar, S. and Waldron, M. (2009) “”, Bank of England Quarterly Bulletin, vol. 49 pp.110-121.
Lyons, R., (2010) “House price falls of 40% suggest 100,000 in severe negative equity”, available at www.ronanlyons.ie.
Purdey, C. (2011) Housing equity: a market update, CML Housing Finance, Issue no. 1, August.
Schulhofer-Wohl, S. (2010) “Negative equity does not reduce homeowners’ mobility”, Federal reserve bank of Minneapolis Working paper No. 682.
Tatch, J. (2009) Homeowner housing equity through the downturn, CML Housing Finance, Issue no. 1, April.
Borrower Loan Property
Number of Male Total Loan Price of Property Number of Female Month of Location NUTSIII
Age of Main Loan Term New or Second Hand
Age of Second Loan Type House or Apartment
Gender Main Initial Gross IR
Gender Second Rate Type
Marital Status Main Years Fixed
Marital Status Second Means of funding Employment Status Main Other Costs Employment Status Second
Employment Sector Main Employment Sector Second Occupation Main
Occupation Second Buyer Status Main Buyer Status Second Gross A Income Main
Gross A Income Second Net M Income Main
Net M Income Second
Other Non Rental Income Other Non Rental Income Rental Income Main
Year
Number
Title/Author(s)
ESRI Authors/Co-authors
Italicised
2013
462 Decomposing patterns of emission intensity in the EU and China: how much does trade matter?
Valeria Di Cosmo and Marie Hyland
461 When to invest in carbon capture and storage technology in the presence of uncertainty: a mathematical model
D.M. Walshab, K. O’Sullivanc, W.T. Leec, and M. Devinec
460 The HERMES-13 macroeconomic model of the Irish economy
Adele Bergin, Thomas Conefrey, John FitzGerald, Ide Kearney and
Nuša Žnuderl
459 Smoking Outside: The Effect of the Irish Workplace Smoking Ban on Smoking Prevalence Among the Employed
Michael Savage
458 Climate policy, interconnection and carbon leakage: the effect of unilateral UK policy on electricity and GHG emissions in Ireland
John Curtis, Valeria Di Cosmo, Paul Deane
457 The effect of unemployment, arrears and negative equity on consumption: Ireland in 2009/10
Petra Gerlach-Kristen
456 Crisis, Response and Distributional Impact: The Case of Ireland
T. Callan, B. Nolan C. Keane, M. Savage, J.R. Walsh
455 Are Consumer Decision-Making Phenomena a Fourth Market Failure?
Pete Lunn
454 Income-Related Inequity in the Use of GP Services: A Comparison of Ireland and Scotland
Richard Layte, Anne Nolan
453 Socioeconomic Inequalities in Child Health in Ireland Richard Layte, Anne Nolan
452 Irish and British historical electricity prices and implications for the future Paul Deane, John FitzGerald, Laura Malaguzzi Valeri, Aidan Tuohy and
Darragh Walsh
451 Globalisation and Ireland’s Export Performance
Frances Ruane, Iulia Siedschlag and Gavin Murphy
For earlier Working Papers see