Predicting and Explaining Human Semantic Search in a Cognitive Model
Filip Miscevic Cognitive Science Program, Complex Networks & Systems Indiana University Bloomington
Aida Nematzadeh Department of Psychology
University of California Berkeley
Suzanne Stevenson Department of Computer Science
University of Toronto [email protected]
Abstract
Recent work has attempted to character-ize the structure of semantic memory and the search algorithms which, together, best approximate human patterns of search re-vealed in a semantic fluency task. There are a number of models that seek to cap-ture semantic search processes over net-works, but they vary in the cognitive plau-sibility of their implementation. Existing work has also neglected to consider the constraints that the incremental process of language acquisition must place on the structure of semantic memory. Here we present a model that incrementally updates a semantic network, with limited computa-tional steps, and replicates many patterns found in human semantic fluency using a simple random walk. We also perform thorough analyses showing that a combi-nation of both structural and semantic fea-tures are correlated with human perfor-mance patterns.
1 Human Semantic Processing
The study of human semantic memory—word meanings, their relations, and their storage—is challenging due to the complexity of factors in-volved. Finding (1) the right representation for word meanings and their relations, (2) the mech-anism responsible for learning the representation, (3) the appropriate search algorithm to efficiently retrieve information from semantic memory, and (4) the suitable empirical data to evaluate the pro-posed representations and algorithms is a diffi-cult task. Previous research has extensively ex-plored each of these (e.g., Collins and Loftus, 1975; Steyvers and Tenenbaum, 2005; Griffiths et al., 2007).
Psychologists frequently use a task known as semantic fluency (or verbal fluency) to exam-ine human semantic representation and processing (Troyer et al., 1997; Ardila et al., 2006). Partici-pants are asked to produce as many words as they can from a given category (e.g., animal) in a fixed amount of time (e.g., three minutes). The result-ing data—which words people recall and in what order—can shed light on how people represent word meanings and their relationships, and how they search such semantic information. For exam-ple, Hills et al. (2012) found that participants tend to reply in semantically-related bursts of words—
e.g., they recall words from the pet subcategory of animals (dog, cat) then switch to a different subcategory, such as African animals (lion,zebra), etc.—indicating that people tend to follow a strat-egy of exploiting a semantically-related patch of words, thenexploring to find a new patch, much like animals foraging in their environment.
Recent work has investigated the properties of semantic representations and processing algo-rithms that can account for this type of behavior in the semantic fluency task. Different researchers have found that a match to human behavior can be achieved in either of two ways: (a) using a simple (vector-based) semantic representation in combi-nation with an informed, two-stage algorithm to exploit and explore the space (Hills et al., 2012); or (b) creating a richer representation—structured as a semantic network—and using a simple ran-dom walk to access it (Abbott et al., 2015; Ne-matzadeh et al., 2016). These findings suggest that the choice of representation and search al-gorithm are interdependent, such that the same empirical data can be replicated through different combinations of representation and algorithm that make different trade-offs on the locus of complex-ity (Abbott et al., 2015).
However, if both combinations account for the
human data considered thus far, the question of which model more plausibly captures what occurs in a search in human semantic memory remains open. As Abbott et al. (2015) suggest, further ex-periments, such as those performed by Hills et al. (2015), can help elucidate the differences between these approaches to modelling human semantic memory. In particular, if there are key aspects of human semantic search that can be explained by one model and not the other, then this goes towards disconfirming the latter. One of the goals of the current paper is to show that a random walk over a semantic network reproduces even the additional empirical patterns of human semantic fluency task examined by Hills et al. (2015).
In addition to these experimental approaches, other findings and theoretical considerations may come to bear on resolving the question of which model most aptly reflects human semantic search. For example, people appear to have a structured semantic memory that encodes many kinds of re-lational knowledge (Miller and Fellbaum, 1991). In this way, complexity costs are incurred during learning (while creating the structured representa-tion) rather than every time the representations are accessed. As such, accessing the knowledge later becomes a more efficient process. Hence, it may be reasonable to suggest that a simple search al-gorithm operating over a structured semantic net-work is a preferable model.
Another open issue is precisely what kind of se-mantic representations realistically capture word relations, especially semantic similarity, which typically form the basic structure of a semantic network (e.g., Miller and Fellbaum, 1991). Work modeling human semantic fluency behavior us-ing a simple random walk over a semantic net-work has drawn on several different kinds of se-mantic word representations. Abbott et al. (2015) constructed their semantic network using human association norms (Nelson et al., 1998), so that weighted edges between words directly capture the similarities between them that are relevant to the fluency task (Jones et al., 2015). Nematzadeh et al. (2016) built two networks based on differ-ent semantic represdiffer-entations learned from text cor-pora: a simple vector-based representation model, called BEAGLE, learned from Wikipedia (Jones and Mewhort, 2007, previously used by Hills et al. (2012)), and probability distributions learned from child-directed corpora (Fazly et al., 2010).
Given that a random walk over semantic networks from each of these sources—human association norms, vector-space representations, and probabil-ity distributions—all model human fluency behav-ior, how do we choose between them?
An important set of considerations that we ex-plore here involves the cognitive plausibility of how a semantic representation could be learned. While the human association norms used by Ab-bott et al. (2015) accurately reflect human judg-ments of word relatedness, it is unclear how the similarity assessments captured in such norms can be learned through language exposure.
The BEAGLE vector-space representations, on the other hand, are learned from instances of nat-ural language. However, acquisition is a batch process over Wikipedia data, which is arguably not a good proxy for the linguistic input from which individuals acquire their semantic lexicon. The probability distributions used by Fazly et al. (2010), however, are learned by a cognitive model from a corpus of child-directed speech. These rep-resentations thus meet important criteria for cogni-tive plausibility, in that they are learned from nat-uralistic linguistic input.
One final crucial issue that has remained unad-dressed to date is the incremental learnability of the semantic network structure itself. Children si-multaneously learn word meanings as well as the relations between them (Jones et al., 1991). Thus, it is important to model the simultaneous incre-mental learning of both semantic word represen-tations and their structure in a semantic network. This has been neglected by previous work dis-cussed so far. Even in the work where semantic representations are learned, only the word repre-sentations and not their relations are learned. In-stead, the semantic network is created by exhaus-tively comparing all the word representations after training—a process that is too computationally de-manding to be cognitively plausible.
task, despite having noisy and incomplete connec-tions as a result of being generated from partial knowledge acquired at each time step. Second, as mentioned, we show that the new approach to creating the semantic network produces a structure that also mimics other aspects of human behavior in semantic fluency, going beyond earlier models in the scope of empirical data accounted for (Ab-bott et al., 2015; Nematzadeh et al., 2016).
Finally, we extend previous analyses of seman-tic organization to determine more precisely which network properties are correlated with the ob-served human performance patterns. While other work has focused on the importance of structural properties of the network in determining human behavior (Go˜ni et al., 2010; Steyvers and Tenen-baum, 2005), we find that both structuraland se-mantic properties are necessary to generate pat-terns observed in human semantic fluency data.
2 Incremental Network Creation
We use the approach of Nematzadeh et al. (2014) to incrementally build a semantic network, which draws on the probabilistic cross-situational word learning model developed by Fazly et al. (2010).
2.1 Incremental Word Learning Model
The semantic network is generated from word meanings (representations) learned by the model of Fazly et al. (2010), trained on the Manchester corpus (Theakston et al., 2001) of the CHILDES database (MacWhinney, 2000). Each input to the model consists of anutterancefrom the corpus, la-belled with asceneconsisting of semantic features for each word. For example, consider the follow-ing utterance (U) and selected features from its ac-companying scene (S):
U:{look,at,the,monkey,eat,a,banana}
S:{. . . ,VERTEBRATE,MAMMAL, . . . ,FRUIT, . . .} Just as a child must learn the referent of each word in a sentence, the learner must infer which fea-tures in the scene are associated—or aligned— with each word. The model captures this associ-ation as the probability of a feature f given a word
w, P(f|w), which it incrementally updates from the co-occurrence of f withwacross all observed utterance–scene pairs. The meaning of each word
w is then represented as the probability distribu-tion P(·|w) over all semantic features, which is estimated through latent variables that model the possible alignments of words and features in an
utterance–scene pair. An incremental Expectation Maximization algorithm is used to update P(·|w) (Neal and Hinton, 1998). Hence, as in children, word meanings are gradually learned after many exposures to utterances and scenes.
In particular, for a single utterance–scene pair processed at timet, the alignment (a) probability of each feature (fi) in the scene and word in the utterance (wj) is calculated by:
Pt(ai j|fi) =∑wPt−1(fi|wj)
0∈uPt−1(fi|w0)
Pt=0(fi|wj) is initially randomly uniformly dis-tributed. Once the alignment probabilities are cal-culated, the word meanings are updated:
Pt(fi|wj) = ∑u∈UtPt(ai j|u,fi) ∑f0∈Mt∑u∈UtPt(ai j|u,f0) Here,Ut represents the set of utterances processed up to and including timet, andMtis the set of fea-tures observed up to and including timet. Note that the summations do not have to be calculated anew each time; the terms from the firstt−1
ut-terances can be stored and updated with the con-tributions from thetthutterance–scene pair.
The learned representation for a word, P(·|w), can be treated as a vector representation of the word over all semantic features. In the present study, we focus on animal nouns, as they are the target of the semantic fluency task in humans. The semantic features of noun meanings used are de-rived from WordNet hypernyms (Fellbaum, 1998,
http://wordnet.princeton.edu), and embed
hierarchical conceptual knowledge of nouns. The more features (hypernyms, in this case) two animal words (e.g., “CAT”,“DOG” vs.
“CAT”,“FROG”) have in common, the more
simi-lar their learned representations. The model learns not only the features associated with that particu-lar word, however, but also features that often oc-cur in the same context as the word. For exam-ple, in the above utterance–scene pair, the model may come to associate a non-zero probability with the feature FRUIT and the wordmonkey. Hence,
the learned meanings of words capture not only a conceptual hierarchy for that word but also infor-mation learned from the context of their usage.
2.2 Incremental Learning of Semantic Networks
ap-proach taken by Nematzadeh et al. (2014) to en-able the model to learn word meanings and the re-lationships between them simultaneously, without exhaustively considering all possible relationships between the words.
Since the probability distribution P(·|w) for a given wordwis stored as a vector over all semantic features, the cosine of the angle between them can be computed as a measure of their similarity. A semantic network can thus be constructed by rep-resenting each word as a node in the network, with an edge between them if the cosine similarity be-tween two words is greater than a thresholdρ.
Whenever a new utterance–scene pair U–S is processed, the probabilitiesP(·|wu)of allwu∈U are updated, affecting the cosine similarities be-tween words wu and all other words. The se-mantic network must be updated to reflect these changes in cosine similarities—i.e., some edges may be added, some removed, some changed in weight. However, rather than calculating the (new) cosine similarities between eachwu andall other words, the model use a limited set of calculations. It first updates the current edges connectingwu to its neighbors. Then it selects a small set of new wordswi thatpotentially have a high probability of being similar towu. This is accomplished by in-crementally forming semantic clusters over word meanings that are adjusted when a word’s meaning is updated (Anderson and Matessa, 1992). Each newly updated word meaningwu is compared to an average (i.e., prototype) representation of each cluster to determine its probability of belonging to that cluster. Finally, nwords are selected from each cluster and their cosine similarity to wu up-dated, where n is proportional to the probability of wu belonging to that cluster. The number of computations is limited aswuis only compared to the cluster prototypes and a restricted number of words from each cluster.
By limiting the number of computations at each step of learning, the model is more cognitively plausible than exhaustively updating the seman-tic network after each utterance. However, it also means that the resulting semantic network will be noisy—it may have missing, superfluous or incorrectly-weighted edges.
3 Experimental Data and Approach
In this section, we explain the details of the se-mantic fluency experiment as well as the
seman-Figure 1: The difference between categorical and associa-tive patch switches, based on Hills et al. (2015).
tic representation and search algorithm used in our simulations. All of the code and data necessary to reproduce our experiments are available athttps:
//github.com/FilipMiscevic/random_walk.
3.1 Evaluation: Semantic Fluency Data
We evaluate our simulations using data from a se-mantic fluency experiment in which participants were tasked with naming as many animals as they can in three minutes (Hills et al., 2012, 2015). Hills et al. (2012) inferred that the recalled words (e.g., dog, cat, lion, zebra) form semantically-related categories or “patches”, based on their inter-item retrieval times (IRT)—the time elapsed between the naming of two sequential items that have not previously been recalled. They find that the IRT increases as search within a semantically-related category progresses. A switch into a dif-ferent semantic category occurs when the IRT ex-ceeds the participant’s average IRT across the en-tire trial. The IRT then decreases and the pattern begins again (see Figure 2a). This result shows that participants exhibit different behavior when recalling words from within a semantic category compared to switching into a new semantic cat-egory. Hills et al. (2012) argue that this pattern is a consequence of an informed two-stage search process: local cues, such as similarity to the most recent response, are used to search within patches, and global cues, such as the overall frequency of a word, are used to switch into new patches. Here we replicate previous results that demonstrate that the IRT pattern (Figure 2a) can be predicted by a simple search given structured representations (Abbott et al., 2015; Nematzadeh et al., 2016). In addition, we show that this process matches other patterns observed in the semantic fluency experi-ment (Hills et al., 2015).
3.2 Representation: A Semantic Network
[image:4.595.314.514.63.149.2]word meanings. We compare two sets of semantic networks, one set created after trainingthe word learner explained in Section 2.1, while the other is built incrementally during the training, as de-scribed in Section 2.2. While the model learns many words, we only consider animal words, as we can evaluate those against the semantic fluency experiment of Hills et al. (2012). We also include the wordanimalitself in the semantic networks, as this is the cue word used in the experiment.
Two words wi andwj are connected in the se-mantic network if the cosine similarity between their feature vectors,P(·|wi)andP(·|wj), is above the threshold,ρ=0.8. An exception is made for
words connected to the wordanimal: because an-imalis a hypernym of the other animals, its cosine similarity will be less than the cosine between an-imals of the same subcategory. As such, to ensure thatanimal remains connected to some words in the network, edges radiating from it are kept if the similarity is at least ρanimal =0.4. Both models
learn the representations of all 93 animal words present in the corpus; however, not all nodes are guaranteed to be connected to the rest of the net-work due to this thresholding. These thresholds were determined by a grid search over the possi-ble values ofρandρanimal(i.e.,(0,1]). The model
predicts the human data over a notable range of parameter values; nonetheless, there are still more networks in that parameter space that do not pre-dict the data. In Section 5, we will explore what characteristics of the networks are responsible for their successful prediction of data.
Batch Network. The word learner was trained on 120k utterance–scene pairs, with the meaning representation of a word,P(·|w), calculated as de-scribed in Section 2.1. After training has con-cluded, a semantic network is constructed using the final learned representations. A total of 70 words is present in this network.
Incremental Network. The learner is trained on 28k utterance–scene pairs.1 After each utterance– scene pair is processed, the connections in the se-mantic network are updated as described in Sec-tion 2.2. A total of 75 words is present in this net-work.
Note that although the word representations of each model are learned by the same learning al-gorithm, they produce very different semantic
net-1Even with the smaller corpus (28k as opposed to 120k
input pairs), the model predicts the semantic fluency data; thus, we used the smaller corpus to speed up our simulations.
works. In the Batch Network, the edges are cre-ated only after training is completed, and is ac-complished by exhaustively computing the co-sine similarity between all word-pair combina-tions. The Incremental Network, on the other hand, uses a more cognitively plausible approxi-mation of this process whereby edges are incre-mentally created by comparing only a small per-centage of the word pairs.2 This means that re-lations captured by the edges of the Incremental Network are noisier and incomplete.
The Incremental Network still only approxi-mates the process of semantic acquisition in peo-ple, albeit more plausibly compared with previous work. As described above, however, we empir-ically set two thresholds that determine whether words are connected or not: one for the word an-imal and another one for all other animal words. Future work will need to explore whether this dis-tinction can be learned while the network is incre-mentally created.
3.3 Search Algorithm: A Random Walk
We model the search process as a random walk in which semantic information is retrieved by ran-domly visiting nodes in the semantic network. Recall that in the semantic fluency experiment, the participants were cued by the word animal
and were asked to name as many animals they can in three minutes. Following Abbott et al. (2015), we simulate this experiment by perform-ing a weighted random walk on each network, be-ginning with the wordanimal. At each step in the random walk, a neighboring node is visited with a probability proportional to the edge weight con-necting them, and the visited word is stored. Just as repeated words are not considered in the hu-man recall data, we assume the output of a ran-dom walk to be the sequence of unique words encountered—i.e., each word is counted in the out-put only when retrieved for the first time. The number of steps taken before the walk terminates (including steps to already-visited nodes) is 70, which produces about the same number of words on the networks as human participants on average do (i.e., 37±5). The results we report are averages over 300 such walks.
2This ends up being only 8% of alln(n−1)
2 possible
3.4 Analyzing Random Walks
In the semantic fluency task, the human response patterns are reflected in changes in the inter-item retrieval time (IRT) over the list of responses. In the empirical data, IRT is the time elapsed from one word until the next word is recalled, and increases and decreases are observed as people switch from one semantic patch of words to an-other, as noted above. Thus, to evaluate the ran-dom walks in our semantic networks against this IRT pattern, we must define a measure of time in the simulated walks (since actual model speed is not an appropriate proxy). We also must determine what constitutes a patch and a switch between two patches.
3.4.1 Measuring Time and Semantic Distance
We follow Abbott et al. (2015) in defining the IRT in a random walk on a semantic network as the number of steps taken (i.e., number of edges crossed) between two words. More specifically, we define IRTs for our walks as follows: for each word that has not previously been visited by the random walk, the IRT is the number of steps taken in the random walk since the last word that was seen for the first time. For example, if the model visits the sequence of nodes “CAT,DOG,CAT,RAT”,
the random walk output is “CAT,DOG,RAT”, and
the IRT between CAT andDOG is 1, whereas the
IRT betweenDOGandRATis 2.
The IRT is considered a proxy for semantic distance between the words. Hills et al. (2015) also looked directly at semantic distances in the sequences generated in the human fluency task: They used vector-space representations (of the BEAGLE model) to calculate cosine similarity be-tween consecutive words. As such, in addition to using IRT in assessing our walks, we also draw on the cosine similarities between words.
3.4.2 Identifying Patch Switches
Each word in a random walk is labeled by the cate-gory/categories it belongs to, as defined by Troyer et al. (1997). Words (e.g., DOG) can belong to
more than one category (e.g.,PETS, CANINE). As
a result, there are different possibilities for defin-ing what constitutes a patch and where the patch switches occur. We explore two different ways of defining patches over Troyer’s categories, follow-ing Hills et al. (2015), as summarized in Figure 1.
Categorical patch switch. A patch switch occurs when a word in the sequence has no category in
(a) Human data
[image:6.595.309.529.61.251.2](b) Batch Network (c) Incremental Network
Figure 2: (a) Human IRTs reproduced from Hills et al. (2012). (b,c) IRTs from random walks generated from the simulated semantic networks. Bars are SEM.
common withallof the words in the current patch. In the sequence “CAT,DOG,WOLF”, “DOG,WOLF”
is a patch switch becauseWOLFis not in the same
category asCAT(is not aPET).
Associative patch switch. A patch switch occurs when a word in the sequence has no category in common with thelastword in the patch. For ex-ample, “DOG,WOLF” is not a patch switch because
both words share the Troyer categoryCANINE, but
“WOLF,COW” is a patch switch because they have
no categories in common.
From this definition it follows that all asso-ciative patch switches are also categorical patch switches. However, a categorical patch switch may not be associative; one such “categorical only” patch switch is illustrated in Figure 1. Hills et al. (2015) argue that human search through memory is more like an associative search, and that the associative patch switch model better ex-plains human IRT patterns. We use the associative patch switch model except where explicitly com-paring the differences between the alternatives.
4 Predicting Semantic Fluency Data
Here we compare the results of random walks over the Batch and Incremental Networks in mimicking human semantic fluency data. First, we focus on predicting the pattern of recall observed in human data, then we examine the properties of each patch switch model.
4.1 Recall Patterns
succes-sive words that do not share a semantic category, presumably reflecting their greater distance in se-mantic memory (Hills et al., 2012, 2015). This is referred to as a patch switch. In the figure, a patch entry position of 1 indicates the average IRT between the first item in a patch and the item re-trieved before it. Similarly, a patch entry position of−1 is the average IRT between the two items preceding a patch switch. Human IRTs in patch entry position 1 (patch switch) are higher than the average IRT, as people take longer to switch to a new patch, then dip below the average IRT at patch position 2 as people recall words within a patch.
As Hills et al. (2012) point out, this behavior is consistent with the marginal value theorem (MVT) of optimal foraging for patches of food in phys-ical space (Charnov, 1976). In particular, MVT demonstrates that to maximize foraging gains, the optimal moment to leave a current patch is when the instantaneous reward drops below the average reward. In the human semantic search task, since participants are asked to retrieve as many words as they can, shorter IRTs lead to a bigger ‘reward’, as more words can thus be retrieved within the time limit. Indeed, Hills et al. (2012) demonstrated that those subjects whose search patterns conformed with MVT retrieved the most words. We eval-uate whether the IRT patterns of our models also conform to the predictions of MVT as observed in the human data. As such, the first patch-entry position IRT must be significantly greater than the mean IRT (e.g., the ratio between the two is greater than 1) and all other patch entry positions must be no greater than the mean IRT. Finally, succes-sive IRTs within the same patch should be non-decreasing.
As shown in Figure 2, we observe a similar pat-tern to the human IRT data in both the Batch and Incremental Networks: the IRT drops between the first and second items in a patch, then steadily in-creases until the IRT exceeds the long-term av-erage IRT, reflecting a patch switch. A single-sided t-test confirms that the first patch entry IRT is greater than the average IRT (p0.001). We
accept the null hypothesis that the patch entry IRT at position -1 is no greater than the average IRT (0.08≤ p≤0.20). The other IRTs are
sig-nificantly less than the average IRT (p <0.02)
and successive IRTs within a patch are indeed non-decreasing. This demonstrates, for the first time, that the combination of a simple search
(a) Human data
[image:7.595.308.530.62.268.2](b) Batch Network (c) Incremental Network
Figure 3: Cosine similarities between words in successive patch positions normalized by the average long-term cosine similarity in (a) BEAGLE vectors for items retrieved by hu-mans (Hills et al., 2012), (b,c) our semantic networks.
and structured representation that is incrementally created—simultaneously, as words are learned— can predict basic patterns observed in human se-mantic fluency. Next, we model additional aspects of the human data that have not been considered in previous work (Abbott et al., 2015; Nematzadeh et al., 2016).
A roughly analogous pattern with respect to patch entry positions is found with the average cosine similarities, although here, because cosine represents similarity rather than distance, the di-rection is reversed, as seen in Figure 3. Words at a patch switch are the least similar to one an-other. Again, the first patch entry position cosine similarity is significantly less than the average co-sine simimlarity (p<0.05). The other patch
en-try position cosines are on average no smaller than the average (p≥0.05). This supports the notion
that words within patches are more similar (and hence, closer in semantic memory) to each other than words between patches.
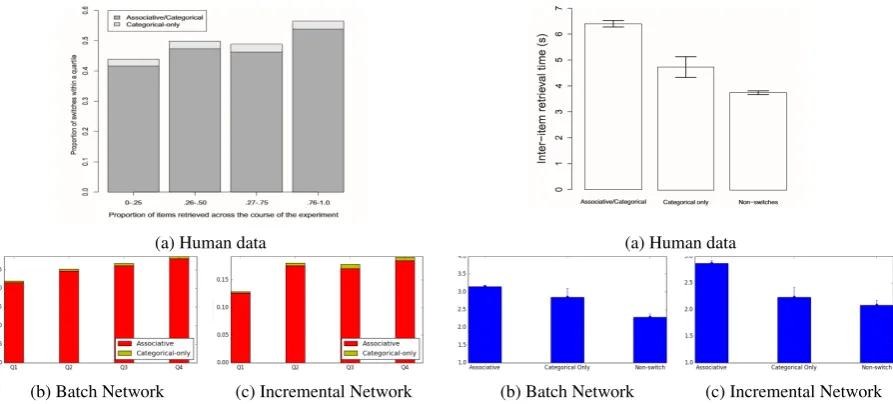
4.2 Patch Switch Type Proportion and Duration
(a) Human data
[image:8.595.80.527.65.267.2](b) Batch Network (c) Incremental Network
Figure 4:Average proportion of patch switch type on each quartile of the random walk for (a) human data (Hills et al., 2012), (b,c) our semantic networks.
This suggests that as more words are retrieved and semantic patches are depleted, new seman-tic patches must be explored. However, the categorical-only switches do not change in fre-quency. We speculate this may either be because they do not contribute to the need to explore dif-ferent patches, or that they are so uncommon to begin with.
Secondly, as in Figure 5a, associative and categorical-only switches take longer than non-switches, which is expected, as non-switches search within a patch of semantically-related words. Associative switches take the longest, as they delineate the boundaries between the most semantically-different categories (compared to categorical-only switches).
Model Predictions. When we subject the ran-dom walks on our networks to these analyses, we observe the same pattern (Figures 4,5). This is the first work to confirm that a random walk on semantic network is consistent with the observed pattern on the duration and proportion of different types of switches.
Hills et al. (2015) point out the associative patch switch model has a Markov property, insofar as that only the proceeding word’s category affects the existence of a patch switch with the next word. This is an interesting observation because it sug-gests that the associative switches may simply be easier to make, as only the previous word’s cat-egories affect the transition to the current word. In contrast, a categorical-only switch demands higher memory overhead as the next word is
af-(a) Human data
[image:8.595.80.283.66.264.2](b) Batch Network (c) Incremental Network
Figure 5:Average IRTs based on patch switch types for (a) human data (Hills et al., 2012), (b,c) our semantic networks.
fected by the overall category/categories shared by members in the current patch. Our results show that a random walk on a structured seman-tic network can predict the timing and proportion of these different types of switches.
5 Explaining Semantic Fluency Data
While our results confirm that a simple search on an incrementally-created semantic network mim-ics many aspects of semantic fluency behavior, not all the semantic networks predict aspects of the human data, such as adherence to MVT. Adding edges to the semantic network depends on the sim-ilarity between words reaching a certain old. We experimented with a wide range of thresh-olds on similarity of word pairs (see Section 3.2) and observed that patterns consistent with MVT, as in the human IRT data (Figure 2a), appear only within a certain parameter range. Since the choice of threshold affects the overall structure of the se-mantic network, we explore the features that dis-tinguish those semantic networks that reproduce human semantic fluency patterns from those that do not.
whether semantically similar words are connected through a path—affects a network’s ability to replicate findings in human semantic search. We hypothesize that this semantic quality is also im-portant in predicting semantic fluency data, be-cause even two networks identical except for node labels would produce very different behavior as the relationships between the words they represent would be completely different.
Here we perform an extensive analysis consid-ering both structural and semantic properties of the networks to assess which features contribute to the model’s adherence to MVT, a major pattern in the human data. By identifying these features, we can better understand the salient aspects of semantic memory that give rise to patterns in human seman-tic search. We first explain how we measure the structural and semantic features of the networks. Then we discuss how we build a regression model to determine which features are responsible in pre-dicting the semantic fluency data.
5.1 Measuring Structure and Semantics
A network exhibits small-world structure if it is sparse and highly connected at the same time— there are not a lot of edges in the network, but most nodes are connected through a set of high-degree nodes. As a result, the network consists of a set of highly-connected components that are connected through the high-degree nodes. Small-worldness is often quantified byσ:
γ= C
Crandom, λ=
L
Lrandom, σ= γ λ whereCis the average local clustering coefficient andLis the average path length, and the subscript
randomrefers to the metric of an equivalent Erd˝os-Renyi network. A network is considered to be small-world whenσ>1 (or more strictly,γ1,
λ≈ 1) (Watts and Strogatz, 1998). Intuitively, γ1 reflects a structure of tightly connected
com-ponents in the network, and λ ≈1 reflects
rel-atively short path distances between nodes com-pared to a random network.
We observe that all of the semantic networks ca-pable of reproducing the human patterns are small-world, but not all small-world networks generate these patterns, which is consistent with the find-ings of Nematzadeh et al. (2016). As a result, we consider other structural and semantic features. The structural features include the number of ver-tices (|V|), number of edges (|E|), and the sparsity
of the network (average nodal degree).
Quality of semantic connections. In addition to the structure of a network, we examine the qual-ity of its semantic connections. We explore this by first identifying the semantic clusters formed in each network using the HDBSCAN algorithm (Campello et al., 2013), and then evaluating these clusters using Troyer’s categories as our gold-standard data Troyer et al. (1997). We assume that each cluster in the network can have exactly one category (e.g., pets). To determine the category label of a cluster, we examine the Troyer category memberships of each of its words, and assign the category label based on which category is shared by the most words of the cluster.
We use the standard measures of precision, re-call, and F-score to assess the quality of each clus-ter, and average these across all clusters, weighted by cluster size, to obtain weighted precision, weighted recall, and weighted F-score for a net-work. We also consider the number of clusters in each network as a feature,|H|.
5.2 Analyzing the Contribution of Features
We characterize which structural and semantic features of a network are most important (in pre-dicting human data) by fitting logistic regression models on all possible combinations of features.
Prior to training, feature values were trans-formed into z-scores (i.e., for a given feature x
for a given network i, the standardized value is (xi−x¯)/sˆ; ¯xis the sample mean of the feature for all networks and ˆs is sample standard deviation). This permits the coefficients of regression to be compared directly in terms of their contribution in predicting the data.3
5.2.1 Experimental Set-Up
Logistic classifier models were trained on a set of Batch and Incremental networks. During training, we ensure an equal representation of networks that adhere to and do not adhere to MVT. This is a binary condition satisfied according to the crite-ria explained in Section 4.1. Networks were first generated across the entire parameter space of the similarity thresholds (i.e., all combinations of ρ andρanimal ranging from 0 to 1, in increments of
3Although some of these features are dependent (e.g.,|E|
0.1). We excluded networks where the number of nodes reachable by the starting word ‘animal’ was smaller than 30, as they would not be able to produce as many words as human participants did (37±5) (Hills et al., 2012). Since the num-ber of non-IRT producing networks outnumnum-bered the IRT producing networks, we uniformly sam-pled the parameter space in which IRT pattern-producing networks occurred so that the number of each would be equal. Using this procedure, 42 Batch and 56 Incremental networks were gener-ated. In each case, exactly half of the networks produce the IRT pattern consistent with MVT.
Model selection. For each set of Batch and In-cremental networks, we examine which features best predict the human data by building and eval-uating logistic regression models for all combina-tions of features. Model selection was performed in two steps. First, the models with the highest stratified-3-fold (SKF) cross-validation score were taken. From these, the model with the fewest num-ber of features was selected.
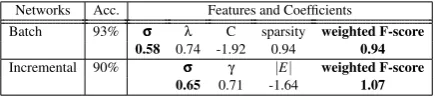
5.2.2 Results of Logistic Regression
Table 1 shows the features that appeared in the logistic regression model that achieved the best SKF cross-validation score for each of the types of networks. Since each feature was standardized (with mean =0 and variance=1), the magni-tude of the coefficients can be interpreted directly. We note that small-worldness (σ) and weighted F-score are influential predictors for both Batch and Incremental networks. In both models, weighted F-score is the most influential predictor. Al-though σ is the least influential predictor, we find it significant that it is a shared predictor for both networks. Structural properties relating to the number of edges (|E|,sparsity) as well as clustering coefficient (C,γ), are structural proper-ties that have been previously characterized in se-mantic networks (Steyvers and Tenenbaum, 2005; Go˜ni et al., 2010). Hence, we conclude that both topological features—namely, small world-ness (high clustering coefficient and short aver-age path length)—and semantic features—high weighted F-score (good precision and recall in clusters)—are jointly associated with reproducing the IRT pattern.
6 Conclusions
Learning word meanings and representing them in semantic memory are processes that often
oc-Networks Acc. Features and Coefficients
Batch 93% σσσ λ C sparsity weighted F-score 0.58 0.74 -1.92 0.94 0.94
[image:10.595.307.525.63.112.2]Incremental 90% σσσ γ |E| weighted F-score 0.65 0.71 -1.64 1.07
Table 1:Features used to train the logistic regression mod-els for predicting IRT pattern production with the highest stratified 3-fold cross-validation accuracy (Acc.). Shared fea-tures are bolded.
cur simultaneously, notably in early language ac-quisition. A cognitive model capable of integrat-ing these two processes will therefore more real-istically capture language acquisition and usage. It is noteworthy that both the Batch and Incre-mental Networks perform comparably on all of the data examined here. We consider this strong support for the hypothesis that semantic networks learned incrementally on a naturalistic language corpus can replicate search patterns in the free re-call task, a claim that is neither obvious nor trivial to demonstrate. Furthermore, some of the perfor-mance characteristics we use in measuring the fit of the model to the human data—namely, whether the IRT patterns produced by the model are con-sistent with MVT or not—are binary conditions: either the behavior is replicated or it is not, so, bar-ring additional criteria, a graded scale by which to score performance is not possible. Future work will seek to better characterize the performance differences between the two models.
We deploy a model that can generate seman-tic networks incrementally from naturalisseman-tic lan-guage use,i.e.child-directed speech, while it grad-ually learns the word meanings, lending it plausi-bility as a cognitive model. We show this model replicates human performance on semantic flu-ency tasks; namely, with regards to patch entry IRT, patch entry cosine similarity patterns, patch switch type proportions, and patch switch type IRTs. We show, furthermore, that the Markov property of the random walk does indeed align with the associative nature of search in the human semantic fluency task (Hills et al., 2015).
References
Joshua T Abbott, Joseph L Austerweil, and Thomas L Griffiths. 2015. Random walks on semantic net-works can resemble optimal foraging. Psyc. Rev. 122(3).
John R. Anderson and Michael Matessa. 1992. Explo-rations of an incremental Bayesian algorithm for cat-egorization.Machine Learning9(4):275–308. Alfredo Ardila, Feggy Ostrosky-Sols, and Byron
Bernal. 2006. Cognitive testing toward the future: The example of semantic verbal fluency (animals). International Journal of Psychology41(5):324–332. https://doi.org/10.1080/00207590500345542. Ricardo J. G. B. Campello, Davoud Moulavi, and Joerg
Sander. 2013. Density-based clustering based on hi-erarchical density estimates. PAKKD 2013.
Eric L Charnov. 1976. Optimal foraging, the marginal value theorem. Theoretical Population Biology 9(2):129–136.
Allan M. Collins and Elizabeth F. Loftus. 1975. A spreading-activation theory of semantic processing. Psyc. Rev.82(6):407.
Afsaneh Fazly, Afra Alishahi, and Suzanne Stevenson. 2010. A probabilistic computational model of cross-situational word learning. Cog. Sci. 34(6):1017– 1063.
Christiane Fellbaum, editor. 1998. WordNet, An Elec-tronic Lexical Database. MIT Press.
Joaqu´ın Go˜ni, Gonzalo Arrondo, Jorge Sepulcre, I˜nigo Martincorena, Nieves V´elez de Mendiz´abal, Bernat Corominas-Murtra, Bartolom´e Bejarano, Sergio Ardanza-Trevijano, Herminia Peraita, Dennis P. Wall, and Pablo Villoslada. 2010. The semantic or-ganization of the animal category: evidence from se-mantic verbal fluency and network theory.Cognitive Processing12:183–196.
Thomas L. Griffiths, Mark Steyvers, and Joshua B. Tenenbaum. 2007. Topics in semantic representa-tion. Psyc. Rev.114(2):211.
Thomas T Hills, Michael N Jones, and Peter M Todd. 2012. Optimal foraging in semantic memory. Psyc. Rev.119(2):431.
Thomas T Hills, Peter M Todd, and Michael N Jones. 2015. Foraging in semantic fields: How we search through memory. Topics in Cognitive Science 7:513–534.
Michael N Jones, Thomas T Hills, and Peter M Todd. 2015. Hidden processes in structural representa-tions: A reply to Abbott, Austerweil, and Griffiths (2015).Psyc. Rev.122(3).
Michael N Jones and Douglas JK Mewhort. 2007. Rep-resenting word meaning and order information in a composite holographic lexicon. Psyc. Rev.114(1):1.
Susan S. Jones, Linda B. Smith, and Barbara Landau. 1991. Object properties and knowledge in early lex-ical learning. Child Development62(3):499–516.
Brian MacWhinney. 2000. The CHILDES Project: Tools for Analyzing Talk, volume 2: The Database. Erlbaum, 3rd edition.
G. A. Miller and C. Fellbaum. 1991. Semantic net-works of English.Cognition41(1–3):197–229.
Radford M. Neal and Geoffrey E. Hinton. 1998. A view of the EM algorithm that justifies incremental, sparse, and other variants. InLearning in graphical models, Springer, pages 355–368.
Douglas L Nelson, Cathy L McEvoy, and Thomas A Schreiber. 1998. The University of South Florida free association, rhyme, and word fragment norms .
Aida Nematzadeh, Afsaneh Fazly, and Suzanne Stevenson. 2014. A cognitive model of semantic network learning. InProceed. Conf. on Empirical Methods in Natural Lang. Processing.
Aida Nematzadeh, Filip Miscevic, and Suzanne Stevenson. 2016. Simple search algorithms on se-mantic networks learned from language use. In Pro-ceedings of the 38th Annual Conference of the Cog-nitive Science Society.
Mark Steyvers and Joshua B. Tenenbaum. 2005. The large-scale structure of semantic networks: Statisti-cal analyses and a model of semantic growth. Cog. Sci.29(1):41–78.
Anna L. Theakston, Elena V. Lieven, Julian M. Pine, and Caroline F. Rowland. 2001. The role of per-formance limitations in the acquisition of verb– argument structure: An alternative account. Journal of Child Language28:127–152.
Angela K. Troyer, Morris Moscovitch, and Gor-don Winocur. 1997. Clustering and switching as two components of verbal fluency: Evidence from younger and older healthy adults. Neuropsychology 11(1):138–146.