Original Article
Quantification of MRI-PDFF by complex-based
MRI: phantom and rabbit study at 3.0T
Xiaomin Wang1,2*, Xiaojing Zhang1*, Lin Ma1, Shengli Li3
1Department of Radiology, Chinese PLA General Hospital, Beijing 100853, China; 2School of Medical Imaging, Tianjin Medical University, Tianjin 300203, China; 3Laboratory Animal Center, Capital Medical University, Beijing 100069, China. *Equal contributors.
Received February 22, 2017; Accepted June 5, 2017; Epub September 15, 2017; Published September 30, 2017
Abstract: This paper aimed to evaluate the accuracy of magnetic resonance imaging-proton density fat fraction (MRI-PDFF) in fat-water-iron phantom and rabbit with hepatic steatosis using complex-based chemical shift-encod-ed MRI technology. Phantoms of varying fat, water and iron content were constructshift-encod-ed. Rabbit model with hepatic steatosis was successfully established by high-fat and high cholesterol diet. All MR examinations were performed on a 3.0T MR system. PDFF values of phantoms and rabbits were calculated from IDEAL-IQ. Fat assessment of rab-bit liver biopsy was performed as reference standard. MRI-PDFF of four phantom groups with different iron content has no significant difference with the known fat contents (F=0.011, p=1.0), and extremely close correlations were observed (r=0.998, 0.998, 0.999, 0.998, respectively, all P<0.001). The existence of magnetic microspheres in phantoms did not affect fat measurement accuracy. MRI-pDFF showed significant differences between different steatosis grades with medians of 3.72% (normal), 5.43% (mild), 9.11% (moderate) and 11.17% (severe) except normal with mild steatosis. Close correlation between MRI-pDFF and histological steatosis was observed (r=0.78, P<0.01). IDEAL-IQ provides robust and promising fat quantification and can be considered potential alternative to biopsy for chronic patients where available.
Keywords: MRI, fat quantification, proton density fat fraction (pDFF), phantom, liver
Introduction
Hepatic steatosis (HS) is defined as excessive fat accumulation in hepatocytes. As the earli-est manifearli-estation of most common health problems such as nonalcoholic fatty liver dis-ease (NAFLD) [1], steatosis is also considered playing important role in pathogenesis of many hepatic and systemic disorders, and may accel-erate disease progression and reduced therapy efficacy [2, 3]. Assessment of liver fat is impor-tant for early detection, monitoring and treat-ment of patients with HS. Biopsy remains gold standard for fat diagnosis, with limitations in- cluding invasiveness, sampling bias and sub-jective variability. Biopsy is not the optimal choice for patients who need long-term clinical follow-up and observations. Among noninva-sive surrogates for hepatic steatosis quantifica-tion, magnetic resonance (MR) has been con-firmed accurate and become a hot spot in clini-cal researches [4-8].
To date, magnetic resonance imaging-proton density fat fraction (MRI-PDFF) has emerged as a standardized, reproducible and promising biomarker for quantification of hepatic steato-sis. It has been a highly active topic and is considered potential alternative to biopsy for chronic patients [9-18].
Previous clinical researches have shown accu-rate quantification of hepatic steatosis using IDEAL-IQ [9, 20-23]. Many researches also use IDEAL-IQ to assess fat deposition of different organs of patients [23, 24]. To our knowledge, current state-of-the-art researches on animal model are limited, and researches on efficiency of IDEAL-IQ taking iron influence into account are few in number. This study was aimed to evaluate the accuracy of MRI-PDFF in fat-water-iron phantom and rabbit with hepatic steatosis using IDEAL-IQ. R2* in phantoms was also cal-culated to investigate efficiency of iron quantifi-cation by IDEAL-IQ.
Materials and methods
Phantom construction
In order to test MRI fat quantification in the presence of iron which shortened T2*, phan-toms of varying fat, water and iron content were constructed. With similar proton nuclear mag-netic resonance (NMR) spectrum to triglycer-ide, peanut oil was selected [25]. Superpara- magnetic iron oxide (SPIO) was applied to in- vestigate influence of iron on fat quantification accuracy of IDEAL-IQ.
According to phantom construction method from Bernard [26], 2 g of carrageenan was dis-solved in 400 ml of purified water heated to 50°C by a temperature-controlled magnetic stirrer. 1.8456 g of sodium dodecyl sulfate was added to the solution in order to create homog-enous oil-in-water emulsions. Four groups (A, B, C, D) of phantoms (20 ml) were constructed, each of which is composed of eight homoge-neous fat-water test tubes with fat volume ratio at 0%, 5%, 20%, 35%, 50%, 65%, 80% and 95%
four groups: ten rabbits in control group (group GC) were fed with a standard diet, experimental groups (group GE1, GE2, GE3) were given a high-fat high-cholesterol diet (standard diet with additional 10% lard oil, 2% cholesterol and 5% maltose) for an interval of 4 weeks (group GE1, 4 weeks; GE2, 8 weeks; GE3, 12 weeks) [27, 28].
MRI acquisition
All MRI examinations were performed on a 3.0T MRI system (Discovery MR750 3.0T, GE Medical systems, USA) using an eight-channel phased-array knee coil. IDEAL-IQ sequence was acquired in phantoms and rabbits. Following parameters were chosen: field of view (FOV), 14×14 cm; matrix, 96×96; bandwidth, 100 kHz; flip angle, 5°; slice thickness, 4 mm; repe- ated measurements (NEX), 3; repetition time (TR), 11.5 ms. The first echo time (TE1)/ΔTE were 1.2/1.9 ms.
[image:2.612.91.378.71.174.2]Rabbits in the control group (GC) were divided into three groups to receive MR scanning at dif-ferent time-points (GC1, 3 rabbits, 4 weeks; GC2, 3 rabbits, 8 weeks; GC3, 4 rabbits, 12 weeks) in order to investigate whether different feeding time affects liver fat content with standard diet, rabbits of each experimental group (GE1, GE2 and GE3) underwent MR scanning after different feeding periods. The animals were anaesthe-tized with intramuscular injection of 0.3 ml xyla-zine/kg and 0.2 ml raceanisodamine hydro-chloride to inhibit stomach and intestine peri-stalsis, and were immobilized with fixed limbs during MRI examinations. The MRI protocol of rabbits also included routine transverse T2 fast-recovery fast spin-echo (FRFSE) sequence for axial images, and parameters were: FOV,
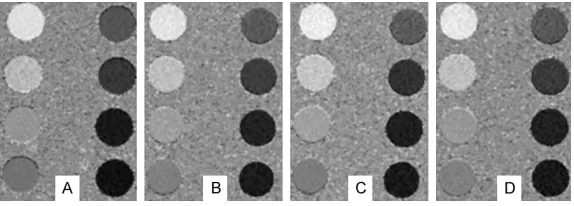
Figure 1. Fat fraction images of phantom groups (known fat volume ratio: first column from top to bottom, 95%, 80%, 65%, 50%; second column from top to bottom, 35%, 20%, 5%, 0%). Each group (A-D) was composed of eight homogeneous fat-water-iron test tubes (20 ml) with different fat volume ra-tios respectively. SPIO content: (A) None; (B) 0.05 mg; (C) 0.1 mg; (D) 0.15 mg.
respectively. SPIO content of each phantom group was as follows: A, none; B, 0.05 mg; C, 0.1 mg; D, 0.15 mg. These phantoms were emulsified by a homogenizer to ensure sta-bility of the gels.
Animal model
12×12 cm; matrix, 256×256; TR, 2861 ms; TE,
[image:3.612.91.525.86.166.2]68 ms; bandwidth, 41.67 kHz; flip angle, 142°; by hematoxylin and eosin (HE) and Oil red O staining to assess the liver morphology and fat
Table 1. MRI-pDFF of different phantom groups at different known fat volume ratio
Group MRI-PDFF (%)
0% 5% 20% 35% 50% 65% 80% 95%
A 0.54±0.2 3.66±0.9 17.02±1.3 30.41±2.1 44.12±1.3 59.49±1.0 75.29±1.2 93.02±0.7 B 0.84±0.5 4.28±1.0 16.91±0.6 31.40±1.7 49.36±0.9 60.21±1.2 74.39±1.9 94.55±1.1 C 0.60±0.3 3.33±0.6 16.61±1.1 31.58±1.5 45.48±2.7 61.03±0.9 77.00±2.0 93.85±0.8 D 0.86±0.1 4.99±1.2 16.47±2.0 30.40±0.4 49.71±1.6 61.50±2.2 77.92±1.0 95.31±2.2
[image:3.612.92.376.200.400.2]Values are given as mean ± SD from phantoms in each group.
Figure 2. MRI-pDFFs in different phantom groups plotted against known fat volume ratios. No statistically significant differences were observed between MRI-pDFF values of phantom groups (F=0.011, p=1.0) from one-way ANOVA analysis. Pearson correlation measurement showed close correlation be-tween MRI-pDFF and known fat volume ratio in each group, r values were 0.998, 0.998, 0.999 and 0.998 respectively for group A, B, C and D. Each group was composed of eight homogeneous fat-water-iron test tubes (20 ml) with different fat volume ratios respectively. SPIO content: A, none; B, 0.05 mg; C, 0.1 mg; D, 0.15 mg.
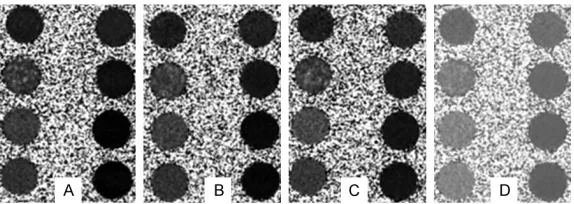
Figure 3. R2* images of phantom groups (known fat volume ratio: first col-umn from top to bottom, 95%, 80%, 65%, 50%; second colcol-umn from top to bottom, 35%, 20%, 5%, 0%). Each group (A-D) was composed of eight ho-mogeneous fat-water-iron test tubes (20 ml) with different fat volume ratios respectively. SPIO content: (A) None; (B) 0.05 mg; (C) 0.1 mg; (D) 0.15 mg.
slice thickness, 4.0 mm; slice spacing, 0.5 mm; NEX, 2.
Data analysis
The radiologist unaware of grouping and biopsy results did data analysis For phan-toms, elliptical region of inter-est (ROI) of 2 cm2 was placed respectively on fat fraction and R2* image to measure MRI-PDFF and R2*. For rab-bits, the radiologist placed five ROIs (average value as measured result) of 0.5 cm2 on the fat fraction image to measure MRI-PDFF. The se- lected rabbit images covered the central liver at the level of portal vein. Blood vessels, bile ducts and artifacts sh- ould be avoided during ROI placement.
Measurements of the variab- les were repeated with the interval of a few days to as- sess calculation reliability. All the calculations were per-formed on a workstation (AW Volume Share 4; GE Health- care).
Histological analysis
[image:3.612.91.378.521.623.2]droplets in the hepatocytes. According to the nonalcoholic steatohepatitis clinical research network (NASH CRN), hepatic steatosis was graded as following: grade 0, minimal steato- sis or normal, <5.0% of liver cells with intra- cellular vacuoles of fat; grade 1, mild, 5.0%~ 32.0%; grade 2, moderate, 33.0%~65.0%; grade 3, severe, >65.0% [29]. Semi-automatic quantification (Vp) was measured by the ratio of fatty content in liver to liver volume using
ed using statistical software (IBM SPSS, ver-sion 21.0). P<0.05 has statistical significance.
Results
[image:4.612.91.377.73.271.2]As a measure of reliability, ICC between repeat-ed measurements in IDEAL-IQ PDFF calcula-tions was 0.91 (95% confidence interval [CI]: 0.83-0.95). And ICC between repeated R2* calculation was 0.81 (95% confidence interval [CI]: 0.67-0.90). The measurements of PDFF
Figure 4. R2*s in different phantom groups plotted against known fat vol-ume ratios. R2* values showed significant differences between phantom groups (F=20.71, p=0.000), however, no correlation between R2* and iron level was observed (p=0.82). Each group (A, B, C, D) was composed of eight homogeneous fat-water-iron test tubes (20 ml) with different fat volume ra-tios respectively. SPIO content: A, none; B, 0.05 mg; C, 0.1 mg; D, 0.15 mg.
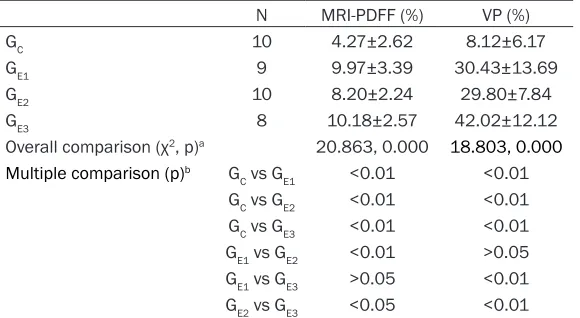
Table 2. Variables measured from rabbit groups with different diets and feeding times
N MRI-PDFF (%) Vp (%)
GC 10 4.27±2.62 8.12±6.17
GE1 9 9.97±3.39 30.43±13.69
GE2 10 8.20±2.24 29.80±7.84
GE3 8 10.18±2.57 42.02±12.12
Overall comparison (χ2, p)a 20.863, 0.000 18.803, 0.000
Multiple comparison (p)b G
C vs GE1 <0.01 <0.01 GC vs GE2 <0.01 <0.01 GC vs GE3 <0.01 <0.01 GE1 vs GE2 <0.01 >0.05 GE1 vs GE3 >0.05 <0.01 GE2 vs GE3 <0.05 <0.01
Values are given as mean ± SD from phantoms in each group. aKruskal Wallis test; bDunn-Bonferroni test.
image analyzer system (Image pro plus V6.0). The patholo-gist blinded to the rabbits’ diet and MR values performed biopsy evaluation.
Statistical analysis
Kurtosis and skewness were applied to test the normality of the data distribution. Intra- class correlation coefficient (ICC) was used to assess reli-ability of IDEAL-IQ calculation. For statistical analysis of ph- antoms, one-way ANOVA was used to determine whether there were any significant dif-ferences between phantom groups in PDFF and R2* val-ues. SNK-Q test performed pairwise comparisons betw- een group values. Pearson correlation measured correla-tion between measured and known values.
[image:4.612.90.380.388.547.2]and R2* from IDEAL-IQ had good repeatability and reliability.
Phantom study
Fat fraction images of different phantom groups were of high quality (Figure 1). MRI-PDFF val-ues from IDEAL-IQ of different phantom groups at different known fat volume ratio were show- ed in Table 1. Figure 2 shows MRI-PDFFs in dif-ferent phantom groups plotted against known fat volume ratios. One-way ANOVA results indi-cated no statistically significant differences between MRI-PDFF values of phantom groups (F=0.011, p=1.0). And close correlation betw- een MRI-pDFF and known fat volume ratio was observed in each group, r values were 0.998, 0.998, 0.999 and 0.998 respectively for group A, B, C and D.
R2* values of different phantom groups were also calculated. R2* images were shown in
Figure 3. Mean R2* values of phantom group A, B, C, D were 28.77±14.62, 71.37±35.00, 108.08±24.38 and 144.22±41.86 (Hz) respec-tively. R2* values showed significant differenc-es between phantom groups (F=20.71, p= 0.000), while no correlation between R2* and iron level was observed (p=0.82). Figure 4
shows R2*s in different phantom groups plot-ted against known fat volume ratios.
and GE2 (Table 2). And there was no differences in variables between male and female rabbits,
p values were 0.793, 0.307 respectively in sex comparison of MRI-pDFF and Vp.
On the liver biopsy examination, rabbits were divided into different grades as following: 6 (16.2%, 6 from group GC) with normal liver, 8 (21.6%, 3 from group GC, 1 from GE1, 2 from GE2, 2 from GE3) with mild steatosis, 13 (35.1%, 1 from group GC, 2 from GE1, 7 from GE2, 3 from GE3) with moderate steatosis, and 10 (27.1%, 6 from group GE1, 1 from GE2, 3 from GE3) with severe steatosis.
In contrast with liver in the normal group (Figure 5A), livers with HS were large-sized, dull red to light yellow, rough surfaces with blunt edges and greasy sections (Figure 5B-D). From histol-ogy analysis, normal livers did not show any abnormalities in cellular architecture. By con-trast, typical histological lesions of steatosis were observed in HS livers. Diffuse severe fat- ty infiltration was noted in HS livers from HE staining. Fat droplet accumulation and fibrosis were obvious in HS samples stained with Oil red O (Figure 6).
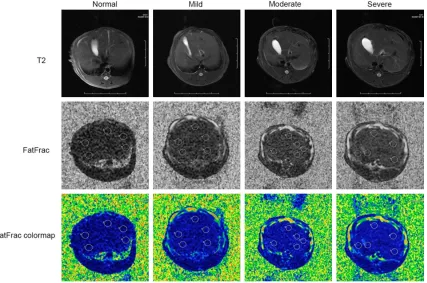
Representative T2 weighted, fat fraction and colormap images in normal and HS livers were shown in Figure 7. MRI-pDFFs showed
signifi-Figure 5. Macroscopic examination of liver with normal (A), mild steatosis (B); moderate steatosis (C) and severe steatosis (D). Normal liver shows red color, smooth surface and sharp margin, while livers with different HS grades were large-sized, dull red to light yellow, rough surfaces with blunt edges and greasy sections.
Animal model study
A total of 37 rabbits (19 male, 18 female) were included in this study (3 died in experi-mental groups). Rabbits of control group (group GC) grew well, whereas some rabbits of experimental groups (group GE1, GE2, GE3) showed phenom-enon of hair and appetite loss with high-fat high-cholesterol diet.
cant differences among different steatosis grades except normal and mild steatosis. Vps showed significant differences among different steatosis grades (Table 3). There was a close
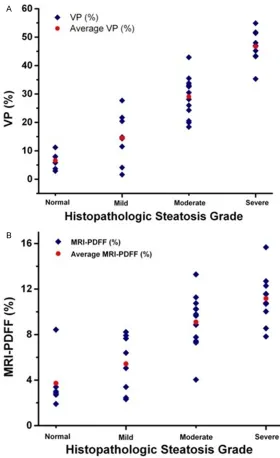
[image:6.612.93.528.74.242.2]correlation between MRI-PDFF and histological Vp (r=0.78, p=0.000; Figure 8). Scatterplots between Vp, MRI-pDFF and histopathologic ste-atosis grades were shown in Figure 9.
Figure 6. Histologic staining of rabbit liver tissue. The liver specimens were stained with HE (A-D), and Oil red O (E-H). Livers of normal group did not show any abnormalities in cellular architecture, while typical histological lesions of steatosis were observed in HS group. In contrast with normal liver, diffuse severe fatty infiltration was noted in HS group From HE staining. Fat droplet accumulation and fibrosis were obvious in HS samples stained with Oil red O, but not in the normal group.
[image:6.612.98.525.324.607.2]Discussion
pDFF is defined as accurate separation of fat protons’ signal from other protons, proton den-sity becomes the main factor affecting signal strength. T1 bias, T2* decay, spectral complex-ity of fat, noise bias and eddy currents are the confounding factors in signal acquisition. With correction for these confounders, fat fraction from MRI is equivalent to PDFF [30].
MRI-PDFF has been a robust imaging-based biomarker for hepatic steatosis quantification.
inhomogeneity (B0), iteration using magnitude information following complex-based recon-struction was applied in IDEAL-IQ algorithm [19, 24].
With convenient data processing, IDEAL-IQ be- comes a hot spot of quantification research. Karcaaltincaba calculated PDFF and R2* using IDEAL-IQ in patients with hepatic iron deposi-tion [36]. Idilman compared the efficiency of MRI-PDFF from IDEAL-IQ in hepatic steatosis quantification in NAFLD patients and observed a close correlation between MRI-PDFF and
his-Table 3. Liver histology and MRI-PDFF by steatosis grade in rabbits Number MRI-PDFF (%) Vp (%)
Normal (0) 6 3.72±2.36 6.58±3.08
Mild steatosis (1) 8 5.43±2.47 14.51±8.82
Moderate steatosis (2) 13 9.11±2.30 29.10±7.09 Severe steatosis (3) 10 11.17±2.21 46.69±1.74 Overall comparison (x2, p)a 21.634, 0.000 30.043, 0.000
Multiple comparison (p)b 0 vs 1 >0.05 <0.05
0 vs 2 <0.01 <0.01
0 vs 3 <0.01 <0.01
1 vs 2 <0.01 <0.01
1 vs 3 <0.01 <0.01
2 vs 3 <0.01 <0.01
[image:7.612.91.378.85.242.2]Values are given as mean ± SD from phantoms in each group. aKruskal Wallis test; bDunn-Bonferroni test.
Figure 8. Correlation between Liver MRI-pDFF and Vp of histological steato-sis. Spearman’s correlation analysis showed close correlation between MRI-pDFF and Vp (r=0.78, p=0.000).
Phantom, animal and clinical studies have confirmed accu-racy of MRI-PDFF in liver fat quantification and indicated that PDFF is preferred fat quantification where availab- le. Study from Artz demon-strated reproductivity of PD- FF across field strengths and methods in obese subjects [31]. Runge compared MRI-PDFF and histopathology ag- ainst reference standard of biochemically determined liver triglyceride content in mice, and showed that MRI-pDFF (r=0.75) had a higher correlation than histopatholo-gy (r=0.59) [32]. MRI-pDFF showed strong correlation with histology (r=0.85) in ex vivo human livers from Ban- nas [33]. Kukuk compared systematically different me- thods for hepatic steatosis quantification for patients and confirmed that MRI-pD- FF provides the most reliable results [10]. MRI-PDFF has been used as reference or technical standard in many researches [34, 35].
[image:7.612.92.374.291.514.2]tology (r=0.74, P<0.001) [22]. And in clinical researches, clinical application of IDEAL-IQ was not limited in liver [20, 37].
This study of fat-water-iron phantoms and rab-bit model confirmed quantification feasibility and accuracy of IDEAL-IQ in fat research. Eva- luated MRI-PDFFs of four phantom groups ac- quired have no significant difference with the known fat contents, and extremely close corre-lations were observed (r values were 0.998, 0.998, 0.999, 0.998). The existence of
[image:8.612.89.369.70.528.2]mag-R2* evaluation [38]. But mag-R2* does not mea-sure iron content directly, and spatial variability of iron concentration lead to broad quantifica-tion confidence intervals. With respect to he- patic R2*-based iron evaluation, coexisting conditions such as fat, inflammation and fibro-sis must be taken into account. From the re- sults of phantoms, R2* value was affected by fat content, R2* values with same iron con- tent fluctuate at different fat contents. Further studies to evaluate the efficiency of R2* from IDEAL-IQ are needed.
Figure 9. Scatterplots between Vp, MRI-pDFF and histologic steatosis grade. The Vp and pDFF values increased with the deeper changes of steatosis.
Accurate quantification of liver fat is critical for clinical diagnosis and treatment of important hepatic and systemic disorders, and facilitates research on related fields. The continuous de- velopment of MRI technologies, particularly the accomplishment of IDEAL-IQ measuring MRI-PDFF and R2* simultaneously, has provided prominent measures for diagnosis and quantifi-cation of steatosis and iron deposition, espe-cially for patients who need long-term clinical follow-up and observations.
From this phantom and rabbit research, IDEAL-IQ provides robust and promising fat quantifica-tion and can be considered potential alterna-tive to biopsy for chronic patients where avail-able. Evaluations of the reliability and accuracy of the technology are still critical in order to determine whether they can substitute histo-logical examination as the gold standard to as- sess hepatic steatosis deposition. R2* from IDEAL-IQ is sensitive to iron changes, however, R2* measurement and classification for iron deposition using IDEAL-IQ need further experi-mental investigation.
Disclosure of conflict of interest
None.
Address correspondence to: Dr. Lin Ma, Depart- ment of Radiology, Chinese PLA General Hospital, 28 Fuxing Road, Beijing 100853, China. Tel: +86- 13801222069; Fax: +86-10-66939592; E-mail: cjr. [email protected]
References
[1] Fabbrini E and Magkos F. Hepatic steatosis as a marker of metabolic dysfunction. Nutrients 2015; 7: 4995-5019.
[2] Lok AS, Everhart JE, Chung RT, Kim HY, Everson GT, Hoefs JC, Greenson JK, Sterling RK, Lindsay KL, Lee WM, Di Bisceglie AM, Bonkovsky HL, Ghany MG and Morishima C. Evolution of he-patic steatosis in patients with advanced hep-atitis C: results from the hephep-atitis C antiviral long-term treatment against cirrhosis (HALT-C) trial. Hepatology 2009; 49: 1828-1837. [3] Tarantino G. Pathogenesis of hepatic
steato-sis: the link between hypercortisolism and non-alcoholic fatty liver disease. World J Gas-troenterol 2013; 19: 6735.
[4] Goceri E, Shah ZK, Layman R, Jiang X and Gur-can MN. Quantification of liver fat: a compre-hensive review. Comput Biol Med 2016; 71: 174-189.
[5] Ligabue G, Besutti G, Scaglioni R, Stentarelli C and Guaraldi G. MR quantitative biomarkers of non-alcoholic fatty liver disease: technical evo-lutions and future trends. Quant Imaging Med Surg 2013; 3: 192-195.
[6] Reeder SB, Cruite I, Hamilton G and Sirlin CB. Quantitative assessment of liver fat with mag-netic resonance imaging and spectroscopy. J Magn Reson Imaging 2011; 34: 729-749. [7] Sharma P, Altbach M, Galons JP, Kalb B and
Martin DR. Measurement of liver fat fraction and iron with MRI and MR spectroscopy tech-niques. Diagn Interv Radiol 2014; 20: 17-26. [8] Yokoo T, Browning JD. <Fat and iron
quantifica-tion in the liver past, present, and future>. Top Magn Reson Imaging 2014; 23: 73-94. [9] Idilman IS, Aniktar H, Idilman R, Kabacam G,
Savas B, Elhan A, Celik A, Bahar K, Karcaaltin-caba M. Hepatic steatosis: quantification by proton density fat fraction with MR imaging versus liver biopsy. Radiology 2013; 3: 767-775.
[10] Kukuk GM, Hittatiya K, Sprinkart AM, Eggers H, Gieseke J, Block W, Moeller p, Willinek WA, Spengler U, Trebicka J, Fischer Hp, Schild HH and Traber F. Comparison between modified Dixon MRI techniques, MR spectroscopic re- laxometry, and different histologic quantifica-tion methods in the assessment of hepatic ste-atosis. Eur Radiol 2015; 25: 2869-2879. [11] Leiber LM, Boursier J, Michalak S, Roullier V,
Fizanne L, Chaigneau J, Roux J, Moal V, Flam-ment M, Bazeries P, Ducluzeau PH and Aube C. MRI versus histological methods for time course monitoring of steatosis amount in a murine model of NAFLD. Diagn Interv Imaging 2015; 96: 915-922.
[12] Leporq B, Lambert SA, Ronot M, Boucenna I, Colinart p, Cauchy F, Vilgrain V, paradis V and Van Beers BE. Hepatic fat fraction and visce- ral adipose tissue fatty acid composition in mice: quantification with 7.0T MRI. Magn Re-son Med 2016; 76: 510-518.
[13] Noureddin M, Lam J, Peterson MR, Middle- ton M, Hamilton G, Le TA, Bettencourt R, Changchien C, Brenner DA, Sirlin C and Loom-ba R. Utility of magnetic resonance imaging versus histology for quantifying changes in liv-er fat in nonalcoholic fatty livliv-er disease trials. Hepatology 2013; 58: 1930-1940.
[14] Rehm JL, Wolfgram pM, Hernando D, Eickhoff JC, Allen DB and Reeder SB. Proton density fat-fraction is an accurate biomarker of hepatic steatosis in adolescent girls and young wom-en. Eur Radiol 2015; 25: 2921-2930.
proton density fat fraction for classification of dichotomized histologic steatosis grades in nonalcoholic fatty liver disease. Radiology 2014; 2: 416-425.
[16] Zand KA, Shah A, Heba E, Wolfson T, Hamilton G, Lam J, Chen J, Hooker JC, Gamst AC, Middle-ton MS, Schwimmer JB and Sirlin CB. Accuracy of multiecho magnitude-based MRI (M-MRI) for estimation of hepatic proton density fat fraction (PDFF) in children. J Magn Reson Im-aging 2015; 42: 1223-1232.
[17] Lin SC, Heba E, Bettencourt R, Lin GY, Valasek MA, Lunde O, Hamilton G, Sirlin CB and Loom-ba R. Assessment of treatment response in non-alcoholic steatohepatitis using advanced magnetic resonance imaging. Aliment Pharma-col Ther 2017; 45: 844-854.
[18] Imajo K, Kessoku T, Honda Y, Tomeno W, Oga-wa Y, MaOga-watari H, Fujita K, Yoneda M, Taguri M, Hyogo H, Sumida Y, Ono M, Eguchi Y, Inoue T, Yamanaka T, Wada K, Saito S and Nakajima A. Magnetic resonance imaging more accurately classifies steatosis and fibrosis in patients with nonalcoholic fatty liver disease than transient elastography. Gastroenterology 2016; 150: 626-637, e627.
[19] Reeder SB, Robson pM, Yu H, Shimakawa A, Hines CD, McKenzie CA and Brittain JH. Quan-tification of hepatic steatosis with MRI: the ef-fects of accurate fat spectral modeling. J Magn Reson Imaging 2009; 29: 1332-1339. [20] Aoki T, Yamaguchi S, Kinoshita S, Hayashida Y
and Korogi Y. Quantification of bone marrow fat content using iterative decomposition of water and fat with echo asymmetry and least-squares estimation (IDEAL): reproducibility, site variation, and correlation with age and menopause. Br J Radiol 2016; 89: 20120538. [21] Ge M, Zhang J, Wu B, Liu Z, Song H, Meng X
and Wu X. Effect of gadolinium on hepatic fat quantification using multi-echo reconstruction technique with T2* correction and estimation. Eur Radiol 2016; 26: 1913-1920.
[22] Idilman IS, Keskin O, Celik A, Savas B, Halil Elhan A, Idilman R and Karcaaltincaba M. A comparison of liver fat content as determined by magnetic resonance imaging-proton density fat fraction and MRS versus liver histology in non-alcoholic fatty liver disease. Acta Radiol 2016; 57: 271-278.
[23] Meng X, Chen X, Shen Y, Hu X, Tang H, Hu D, Li Z and Kamel IR. Proton-density fat fraction measurement: a viable quantitative biomarker for differentiating adrenal adenomas from nonadenomas. Eur J Radiol 2017; 86: 112-118.
[24] Idilman IS, Tuzun A, Savas B, Elhan AH, Celik A, Idilman R and Karcaaltincaba M. Quantification
of liver, pancreas, kidney, and vertebral body MRI-PDFF in non-alcoholic fatty liver disease. Abdom Imaging 2015; 40: 1512-1519. [25] Hines CD, Yu H, Shimakawa A, McKenzie CA,
Brittain JH and Reeder SB. T1 independent, T2* corrected MRI with accurate spectral mod-eling for quantification of fat: validation in a fat-water-SPIO phantom. J Magn Reson Imag-ing 2009; 30: 1215-1222.
[26] Bernard CP, Liney GP, Manton DJ, Turnbull LW and Langton CM. Comparison of fat quanti- fication methods: a phantom study at 3.0T. J Magn Reson Imaging 2008; 27: 192-197. [27] Hebbard L and George J. Animal models of
nonalcoholic fatty liver disease. Nat Rev Gas-troenterol Hepatol 2011; 8: 35-44.
[28] King JL, Miller RJ, Blue JP, O’Brien WD and Erdman JW. Inadequate dietary magnesium intake increases atherosclerotic plaque devel-opment in rabbits. Nutr Res 2009; 29: 343-349.
[29] Joo I, Lee MJ, Yoon JH, Jang JJ, Han JK and Choi BI. Nonalcoholic fatty liver disease: in- travoxel incoherent motion diffusion-weighted MR imaging-an experimental study in a rabbit model. Radiology 2013; 270: 131-140. [30] Reeder SB and Sirlin CB. Quantification of liver
fat with magnetic resonance imaging. Magn Reson Imaging Clin N Am 2010; 18: 337-357, ix.
[31] Artz NS, Haufe WM, Hooker CA, Hamilton G, Wolfson T, Campos GM, Gamst AC, Schwimmer JB, Sirlin CB and Reeder SB. Reproducibility of MR-based liver fat quantification across field strength: same-day comparison between 1.5T and 3T in obese subjects. J Magn Reson Imag-ing 2015; 42: 811-817.
[32] Runge JH, Bakker pJ, Gaemers IC, Verheij J, Hakvoort TB, Ottenhoff R, Nederveen AJ and Stoker J. Measuring liver triglyceride content in mice: non-invasive magnetic resonance meth-ods as an alternative to histopathology. MAG-MA 2014; 27: 317-327.
[33] Bannas P, Kramer H, Hernando D, Agni R, Cun-ningham AM, Mandal R, Motosugi U, Sharma SD, Munoz del Rio A, Fernandez L and Reeder SB. Quantitative magnetic resonance imaging of hepatic steatosis: validation in ex vivo hu-man livers. Hepatology 2015; 62: 1444-1455. [34] Lin SC, Heba E, Wolfson T, Ang B, Gamst A, Han
A, Erdman JW Jr, O’Brien WD Jr, Andre MP, Sir-lin CB and Loomba R. Noninvasive diagnosis of nonalcoholic fatty liver disease and quantifica-tion of liver fat using a new quantitative ultra-sound technique. Clin Gastroenterol Hepatol 2015; 13: 1337-1345, e1336.
frac-tion in the liver using dual-energy computed tomography and multimaterial decomposition. J Comput Assist Tomogr 2014; 38: 845-852. [36] Karcaaltincaba M, Idilman I and Celik A. Focal
sparing of iron and fat in liver tissue in patients with hemosiderosis: diagnosis with combina-tion of R2* relaxometry and proton density fat fraction calculation by MRI. Diagn Interv Radiol 2011; 17: 323-327.
[37] Grayev A, Reeder S and Hanna A. Use of chem-ical shift encoded magnetic resonance imag-ing (CSE-MRI) for high resolution fat-sup-pressed imaging of the brachial and lumbosa-cral plexuses. Eur J Radiol 2016; 85: 1199-1207.