Proceedings of NAACL-HLT 2018, pages 2180–2193
Object Counts! Bringing Explicit Detections Back into Image Captioning
Josiah Wang, Pranava Madhyastha and Lucia Specia
Department of Computer Science University of Sheffield, UK
{j.k.wang, p.madhyastha, l.specia}@sheffield.ac.uk
Abstract
The use of explicit object detectors as an in-termediate step to image captioning – which used to constitute an essential stage in early work – is often bypassed in the currently dom-inant end-to-end approaches, where the lan-guage model is conditioned directly on a mid-level image embedding. We argue that explicit detections provide rich semantic information, and can thus be used as an interpretable repre-sentation to better understand why end-to-end image captioning systems work well. We pro-vide an in-depth analysis of end-to-end image captioning by exploring a variety of cues that can be derived from such object detections. Our study reveals that end-to-end image cap-tioning systems rely on matching image rep-resentations to generate captions, and that en-coding the frequency, size and position of ob-jects are complementary and all play a role in forming a good image representation. It also reveals that different object categories con-tribute in different ways towards image cap-tioning.
1 Introduction
Image captioning (IC), or image description gen-eration, is the task of automatically generating a sentential textual description for a given im-age. Early work on IC tackled the task by first running object detectors on the image and then using the resulting explicit detections as in-put to generate a novel textual description, e.g.
(Kulkarni et al., 2011;Yang et al., 2011). With
the advent of sequence-to-sequence approaches to IC, e.g. (Karpathy and Fei-Fei, 2015; Vinyals
et al., 2015), coupled with the availability of
large image description datasets, the performance of IC systems showed marked improvement, at least according to automatic evaluation metrics like Meteor (Denkowski and Lavie, 2014) and CIDEr (Vedantam et al.,2015).
The currently dominant neural-based IC sys-tems are often trained end-to-end, using parallel (image, caption) datasets. Such systems are es-sentially sequential language models conditioned directly on some mid-level image features, such as an image embedding extracted from a pre-trained Convolutional Neural Network (CNN). Thus, they bypass the explicit detection phase of previous methods and instead generate captions directly
from image features. Despite significant progress, it remains unclear why such systems work. A major problem with these IC systems is that they are less interpretable than conventional pipelined methods which use explicit detections.
We believe that it is timely to again start explor-ing the use of explicit object detections for image captioning. Explicit detections offer rich semantic information, which can be used to model the enti-ties in the image as well as their interactions, and can be used to better understand image captioning. Recent work (Yin and Ordonez,2017) showed that conditioning an end-to-end IC model on vi-sual representations that implicitly encode object details yields reasonably good captions. Never-theless, it is still unclearwhythis works, andwhat
aspects of the representation allow for such a good performance. In this paper, we study end-to-end IC in the context of explicit detections (Figure1) by exploring a variety of cues that can be derived from such detections to determine what informa-tion from such representainforma-tions helps image cap-tioning, andwhy. To our best knowledge, our work is the first experimental analysis of end-to-end IC frameworks that uses object-level information that is highly interpretable as a tool for understanding such systems. Our main contributions are as fol-lows:
1. We provide an in-depth analysis of the perfor-mance of end-to-end IC using a simple, yet effective ‘bag of objects’ representation that
Category ablation
a man balances a bicycle on a bench .
?
3 1 0 1 0 0 3
1 1 0 1 0 0 1
x y w h x y w h
0
0.38 0.12 0 0.12 0 0 0.38 0
0 0
Frequency
Normalized
Binarized
Position+size
person
person
bicycle
car dog surfboard
banana
bench
spoon
person person
bicycle
bench bench bench
‑ 1 0 1 0 0 3
Section 3
Section 5
Section 4
personbicycle
car dog surfboard
banana
bench
spoon
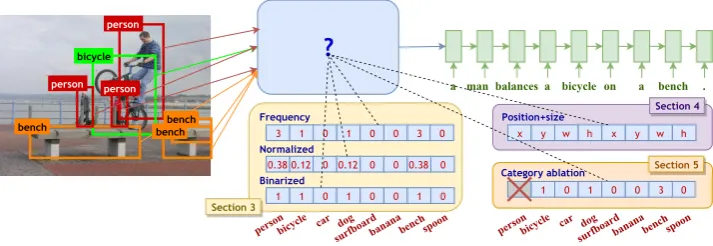
[image:2.595.118.475.63.186.2]
Figure 1: Using explicit detections as an intermediate step towards end-to-end image captioning. The question we investigate is what information can we extract from explicit detections that can be useful for image captioning.
is interpretable, and generates good captions despite being low-dimensional and highly sparse (Section3).
2. We investigate whether other spatial cues can be used to provide information complemen-tary to frequency counts (Section3).
3. We study the effect of incorporating different spatial information of individual object in-stances from explicit detections (Section4). 4. We analyze the contribution of the categories
in representations for IC by ablating individ-ual categories from them (Section5).
Our hypothesis is that there are important com-ponents derived from explicit detections that can be used to effectively inform IC. Our study con-firms our hypothesis, and that features such as the frequency, size and position of objects all play a role in forming a good image representation to match their corresponding representations in the training set. Our findings also show that differ-ent categories contribute differdiffer-ently to IC, and this partly depends on how likely they are to be men-tioned in the caption given that they are depicted in the image. The results of our investigation will help further work towards more interpretable im-age captioning.
2 Related work
Early work on IC apply object detectors explic-itly on an image as a first step to identify enti-ties present in the image, and then use these de-tected objects as input to an image caption gen-erator. The caption generator typically first per-forms content selection (selecting a subset of ob-jects to be described) and generates an intermedi-ate representation (e.g. semantic tuples or abstract trees), and then performs surface realization using
rules, templates, n-grams or a maximum entropy
language model. The main body of work uses ob-ject detectors for 20 pre-specified PASCAL VOC (Visual Object Classes) (Everingham et al.,2015)
(Yang et al.,2011;Kulkarni et al.,2011;Li et al.,
2011;Mitchell et al., 2012), builds a detector
in-ferred from captions (Fang et al., 2015), or as-sumes gold standard annotations are available (
El-liott and Keller,2013;Yatskar et al.,2014).
Currently, deep learning end-to-end approaches dominate IC work (Donahue et al.,2015;
Karpa-thy and Fei-Fei,2015;Vinyals et al.,2015). Such
approaches do not use an explicit detection step, but instead use a ‘global’ image embedding as input (generally a CNN) and learn a language model (generally an LSTM) conditioned on this input. Thus, they are trained to learn image cap-tion generacap-tion directly from a parallel image– caption dataset. The advantage is that no firm de-cisions need to be made about object categories. However, such approaches are hard to interpret and are dataset dependent (Vinyals et al.,2017).
Some recent work use object-level semantics for end-to-end IC (Gan et al., 2017; Wu et al.,
2016;You et al., 2016). Such systems represent
images as predictions of semantic concepts occur-ring in the image. These predictions, however, are at a global,imagelevel (“does this image con-tain a chair?”), rather than at objectinstancelevel (“there is a big chair at positionx”). In addition,
Yin and Ordonez (2017) propose conditioning an end-to-end IC model on information derived from explicit detections. They implicitly encode the category label, position and size of object in-stances as an ‘object-layout’ LSTM and condition the language model on the final hidden state of this LSTM, and produce reasonably good image captions based only on those cues, without the di-rect use of images. Our work is different in that we feed information from explicit object detec-tionsdirectlyto the language model in contrast to an object-layout LSTM which abstracts away such information, thereby retaining theinterpretability
of the input image representation. This gives us more control over the image representation which is simply encoded as a bag of categorical variables. There is also recent work applying attention-based models (Xu et al., 2015) on explicit ob-ject proposals (Anderson et al., 2018;Li et al.,
2017), which may capture object-level informa-tion from the atteninforma-tion mechanism. However, attention-based models require object information in the form of vectors, whereas our models use in-formation of objects as categorical variables which allow for easy manipulation but are not compati-ble with the standard attention-based models. The model that we use, under similar conditions(i.e. under similar parametric settings), is comparable to the state-of-the-art models.
3 Bag of objects
We base our experiments on the MS COCO dataset (Lin et al., 2014). From our preliminary experiments, we found that a simple bag of
ob-ject categoriesused as an image representation for
end-to-end IC led to good scores according to au-tomatic metrics, comparable to and perhaps even higher than those using CNN embeddings. This is surprising given that this bag of objects vector is
low-dimensional(each element represents the
fre-quency of one of 80 COCO categories) andsparse
(mainly zeros, as only a few object categories tend to occur in a given image). In simple terms, it ap-pears that the IC model can generate a reasonable caption by merely knowing what is in the image, e.g. that there are threepersons, threebenchesand
abicyclein Figure1.
This observation raises the following questions. What is it in this simple bag of objects repre-sentation that contributes to the surprisingly high performance on IC? Does it lie in the frequency
counts? Or the choice of categories themselves? It is also worth noting that the image captions in COCO were crowd-sourcedindependentof the COCO object annotations, i.e. image captions were written based only on the image, without object-level annotations. The words used in the captions thus do not correspond directly to the 80 COCO categories (e.g. a cup may not be men-tioned in a description even though it is present in the image, and vice versa, i.e. objects described in the caption may not correspond to any of the categories).
In order to shed some light into what makes bag of object categories representations work so well for IC, we first investigate whether thefrequency
countsis the main contributor. We then proceed to
studying what else can be exploited from explicit object detections to improve on the bag of objects model, for example the size of object instances. We also perform an analysis on these representa-tions to gain more insights into why the bag of ob-jects model performs well.
3.1 Image captioning model
Our implementation is based on the end-to-end ap-proach of Karpathy and Fei-Fei (2015). We use an LSTM (Hochreiter and Schmidhuber, 1997) language model as described in Zaremba et al.
(2014). To condition the image information, we first perform a linear projection of the image rep-resentation followed by a non-linearity:
x=σ(W·Im) (1)
whereIm∈ Rdis thed-dimensional initial image
representation,W ∈ Rn×d is the linear
transfor-mation matrix,σis the non-linearity. We use
Ex-ponential Linear Units (Clevert et al.,2016) as the non-linear activation in all our experiments. We initialize the LSTM-based caption generator with the projected image representation,x.
Training and inference. The caption generator is trained to generate sentences conditioned on
x. We train the model by minimizing the
cross-entropy, i.e. the sentence-level loss corresponds to the sum of the negative log likelihood of the cor-rect word at each time step:
Pr(S|x;θ) =X
t
log(Pr(wt|wt−1..w0;x)) (2)
con-ditioned on the image featurexandPr(wt)is the
probability of the word at time step t. This is
trained with standard teacher forcing as described
inSutskever et al.(2014), where the correct word
information is fed to the next state in the LSTM. Inference is usually performed using approxi-mate techniques like beam search and sampling methods. As we are mainly interested in study-ing different image representations, we focus on the language output that the models can most con-fidently produce. In order to isolate any other vari-ables from the experiments, we generate captions using a greedy arg max approach. We use a 2-layer LSTM with 128-dimensional word
embed-dings and 256-dimensional hidden dimensions.
As training vocabulary we retain only words that appear at least twice. We provide details about hy-perparameters and tuning in AppendixA.
3.2 Visual representations
The first part of our experiments studies the role
of frequency counts of the 80-dimensional bag
of objects representation. We explore the effects of using the following variants of the bag of ob-jects representation: (i)Frequency: The number of instances per category; (ii) Normalized: The frequency counts normalized such that the vector sums to 1. This represents the proportionof ob-ject occurrences in the image; (iii)Binarized:An object category’s entry is set to 1 if at least one instance of the category occurs, and 0 otherwise.
Berg et al. (2012) explore various factors that
dictate what objects are mentioned in image de-scriptions, and found that object size and its po-sition relative to the image centre are important. Inspired by these findings, we explore alternative representations based on these cues: (i) Object size: The area of the region provided by COCO, normalized by image size; we encode the largest object if multiple objects occur for the same cat-egory (max pooling). (ii) Object distance: The Euclidean distance from the object bounding box centre to the image centre, normalized by image size; we encode the object closest to the centre if multiple instances occur (min pooling). We also exploreconcatenatingthese features to study their complementarity.
Finally, we study the effects of removing in-formationfrom the bag of objects representation. More specifically, we compare the results of re-taining only a certain number of object instances
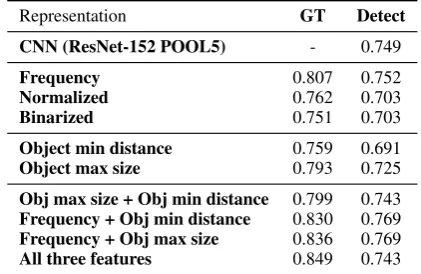
Representation GT Detect
CNN (ResNet-152 POOL5) - 0.749
Frequency 0.807 0.752
Normalized 0.762 0.703
Binarized 0.751 0.703
Object min distance 0.759 0.691
Object max size 0.793 0.725
Obj max size + Obj min distance 0.799 0.743
Frequency + Obj min distance 0.830 0.769
Frequency + Obj max size 0.836 0.769
[image:4.595.310.521.63.200.2]All three features 0.849 0.743
Table 1: CIDEr scores for image captioning using bag of objects variants as visual representations. We
com-pare the results of using ground truth annotations (GT)
and the output of a detector (Detect). As comparison
we also provide, in the first row, the results of using a ResNet-152 POOL5 CNN image embedding with our implementation of an end-to-end IC system.
in thefrequency-based bag of objects representa-tion, rather than representing an image with all ob-jects present. We experiment with retaining only the frequency counts for one object category and
25%, 50%, and75%of object categories; the re-maining entries in the vector are set to zero. The object categories to be retained are selected, per image: (i) randomly; (ii) by theN%most frequent categories of the image; (iii) by the N% largest
categories of the image; (iv) by theN%categories
closest to the centre of the image.
We performed these evaluations based on (i) ground truth COCO annotations and (ii) the output of an off-the-shelf object detector (Redmon and
Farhadi, 2017) trained on 80 COCO categories.
With ground truth annotations we can isolate is-sues stemming from incorrect detections.
3.3 Experiments
We train our models on the full COCO training set, and use the standard, publicly available splits1
of the validation set as in previous work (
Karpa-thy and Fei-Fei, 2015) for validation and testing
(5,000 images each). We use CIDEr (Vedantam
et al., 2015) – the official metric for COCO – as
our evaluation metrics for all experiments. For completeness, we present scores for other com-mon IC metrics in AppendixB.
Table 1 shows the CIDEr scores of IC sys-tems using variants of the bag of objects repre-sentation, for both ground truth annotations and
1http://cs.stanford.edu/people/
Feature vs. Pooling Min Max Mean Obj. Size 0.748 0.793 0.789
[image:5.595.358.477.62.146.2]Obj. Distance 0.759 0.768 0.740
Table 2: CIDEr scores for captioning comparing the use of min, max or average pooling of either object size or distance features, using ground truth annotations.
the output of an object detector. Compared to a pure CNN embedding (ResNet-152 POOL5), our object-based representations show higher (for ground truth annotations) or comparable CIDEr scores (for detectors). Our first observation is that frequency counts are essential to IC. Using nor-malized counts as a representation gives poorer re-sults, which intuitively makes sense: An image with 20 cars and 10 people is significantly dif-ferent from an image with two cars and one per-son. Using binarized counts (presence or absence) brings the score further down. This is to be ex-pected: An image with one person is very different from one with 10 people.
Using spatial information (size or distance) also proved useful. Encoding the object size in place of frequency gave reasonably better results over using object distance from the image centre. We can conclude that the size and centrality of objects are important factors for captioning, with object size being more informative than position.
We also experimented with different methods for aggregating multiple instances of the same category, in addition to choosing the biggest in-stance and the inin-stance closest to the image cen-tre. For example, choosing thesmallest instance (min pooling) or the instancefurthest away from the image centre (max pooling), or just averag-ing them (mean poolaverag-ing). Table 2 shows the re-sults. For object size, the findings are as expected: Smaller object instances are less important for IC, although averaging them works comparably well. Surprisingly, in the case of distance, using the
ob-jectfurthest from the image centre actually gave
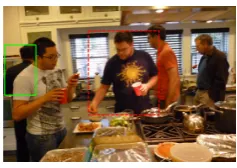
slightly better results than the one closest. Fur-ther inspection revealed that aggregating instances is not effective in some cases. We found that the positional information (and interaction with other objects) captured by the object further away may sometimes represent the semantics of the image better than the object in the centre of the image. For example, in Figure2, encoding only the posi-tion of the person in the middle will result in the
Obj. min distance:
•a man in a kitchen preparing food in a kitchen . Obj. max distance:
[image:5.595.90.271.65.105.2]•a group of people standing around a kitchen counter .
Figure 2: Example where encoding the distance of the
object furthest away (solidgreen) is better than that of
the one closest to the image centre (dashedred). The
IC model assumes that only one person is in the middle in the former case, and infers that many people may be gathered around a table in the latter.
representation being similar to other images with only one person in the centre of the image (and also on a kitchen counter). Representing the per-son as the one furthest from the image will result in some inference (from training data) that there could be more than one person in the image
sit-tingaroundthe kitchen counter rather than a
sin-gle person standingatthe kitchen counter. The combination of results (bottom row of Ta-ble 1) shows that the three features (frequency, object max size and min distance) are comple-mentary, and that combining any pair gives bet-ter CIDEr scores than each alone. The combina-tion of all three features produces the best results. These results are interesting, as adding spatial in-formation of even just one object per category can produce a better score. This has, to our knowl-edge, not been previously demonstrated. The per-formance of using an explicit detector rather than ground truth annotations is poorer, as expected from noisy detections. However, the overall trend generally remains similar, except for the combina-tion of all three features which gave poorer scores. Finally, Figure 3 shows the results of partially removing or masking the information captured by the bag of object representation (frequency). As expected, IC performance degrades when less than75% of information is retained. The
100% 75% 50% 25% 1 4XDQWLW\UHWDLQHG 0.40 0.45 0.50 0.55 0.60 0.65 0.70 0.75 0.80 &,'(U
[image:6.595.88.277.63.159.2]Obj Max Size Obj Min Distance Random Frequency
Figure 3: Change in CIDEr scores for image caption-ing by reduccaption-ing the number of (ground truth) object in-stances in the image representation, based on different heuristics.
not mean that it is less important than the tencars depicted. On the other hand, object size correlates with object importance in IC, i.e. larger objects are more important than smaller objects for IC: The performance does not degrade as much as remov-ing categories by their frequency in the image.
3.4 Analysis
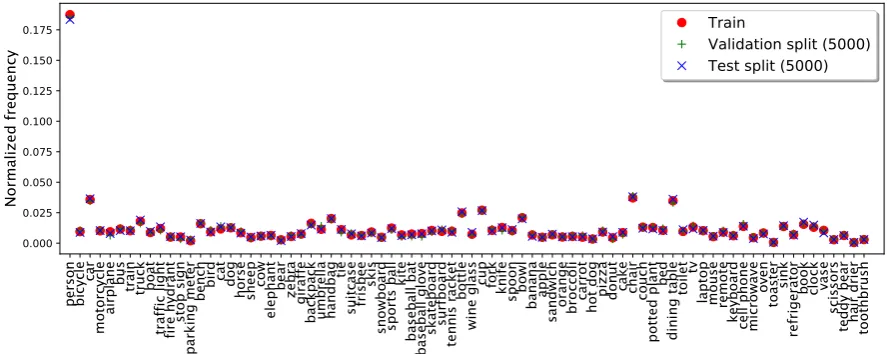
We hypothesize that the bag of objects represen-tation performs well because it serves as a good representation for the dataset and allows for bet-ter image matching. One observation is that the category distribution between the training and test sets are very similar (Figure4), thus increasing the chance of the bag of objects representation pro-ducing a close match to one in the training set. From this observation, we posit that end-to-end IC models leverage COCO being repetitive to find similar matches for a test image to a combination of images in the training set. Further investigation on the category distribution (e.g. by splitting the dataset such that the test set contains unseen cate-gories) is left for future work.
k-Nearest neighbour analysis. We further
in-vestigate our claim that end-to-end IC systems es-sentially perform complex image matching against the training set with the following experiment. The idea is that if the IC model performs some form of image matching and text retrieval from the training set, then the nearest neighbour (from training) of a test image should have a caption similar to the one generated by the model. How-ever, the model does not always perform text re-trieval as the LSTM is known to sometimes gen-erate novel captions, possibly by aggregating or ‘averaging’ the captions of similar images and per-forming some factorization. We first generate cap-tions for every training image using the bag of
ob-SHUVRQ ELF\FOH
FDU
PRWRUF\FOHDLUSODQH EXV WUDLQ WUXFN ERDW
WUDIILFOLJKW ILUHK\GUDQWVWRSVLJQ
SDUNLQJPHWHU
EHQFKELUG FDW GRJKRUVH VKHHSFRZ HOHSKDQWEHDU ]HEUDJLUDIIHEDFNSDFN XPEUHOOD KDQGEDJ
WLH VXLWFDVH IULVEHH VNLV VQRZERDUG VSRUWVEDOO NLWH EDVHEDOOEDW
EDVHEDOOJORYHVNDWHERDUG VXUIERDUGWHQQLVUDFNHW
ERWWOH
ZLQHJODVV
FXS IRUN NQLIH
VSRRQ ERZO EDQDQD DSSOHVDQGZLFKRUDQJH EURFFROLFDUURWKRWGRJSL]]D GRQXW FDNH FKDLU FRXFK
SRWWHGSODQW
EHG
GLQLQJWDEOH
WRLOHW
WY
ODSWRS PRXVH UHPRWH NH\ERDUG FHOOSKRQH PLFURZDYH
RYHQ
WRDVWHUVLQN
UHIULJHUDWRU
ERRN FORFN YDVH
VFLVVRUV
WHGG\EHDU KDLUGULHU WRRWKEUXVK
0.000 0.025 0.050 0.075 0.100 0.125 0.150 0.175 1RUPDOL]HGIUHTXHQF\ Train Validation split (5000) Test split (5000)
Figure 4: Object category distributions for COCO train, validation and test splits: normalized document frequency of each category. The distribution between the training and test sets are almost identical. A higher
resolution version can be found in AppendixB.
Type BLEU Meteor CIDEr SPICE
Freq. 0.868 0.591 6.956 0.737
Proj. 0.912 0.634 7.651 0.799
Exact (2301) 1.000 1.000 10.000 1.000 Freq. (¬Exact) 0.757 0.498 4.337 0.512 Proj. (¬Exact) 0.837 0.560 5.638 0.628
Table 3:k-Nearest Neighbour (k=5) trial on the ground
truth bag of objects (Freq.) and the projected bag of
objects (Proj.) representations. The references are
cap-tions of5-nearest images in each space. Exact
repre-sents a subset of 2301 samples where all the 5
neigh-bours have0distance (replicas) and¬represents
near-est neighbours that are not replicas of the tnear-est image.
jects model (with ground truth frequency counts). We then compute thek-nearest training images for
each given test image using both the bag of ob-jects representation and its projection (Eq.1). Fi-nally, we compute the similarity score between the generated caption of the test image against allk
-nearest captions. The similarity score measures how well a generated caption matches its nearest neighbour’s captions. We expect the score to be high if the IC system generates an image similar to something ‘summarized’ from the training set.
As reported in Table 3, overall the captions seem to closely match the captions of 5
near-est training images. Further analysis showed that 2301 out of 5000 captions had nearest images at a zero distance, i.e., the same exact representa-tion was seen at least5times in training (note that
[image:6.595.309.524.63.150.2] [image:6.595.309.524.235.318.2]test
person (5), cup (8), spoon (1), bowl (8), carrot (10), chair (6), dining table (3)
⇒a group of people sitting around a table with food .
1
person (4), cup (4), spoon (1), bowl (5), chair (6), dining table (4)
⇒a woman sitting at a table with a plate of food .
2
person (9), bottle (1), cup (6), bowl (4), broccoli (2), chair (5), dining table (3)
⇒group of people sitting at a table eating food .
3
person (11), cup (2), bowl (4), carrot (6), cake (1), chair (4), dining table (1)
⇒a group of people sitting around a table with a cake .
4
cup (1), spoon (1), bowl (9), carrot (10), chair (3), potted plant (1), dining table (1), vase (1)
⇒a table with a variety of food on it .
5
[image:7.595.329.501.62.178.2]cup (4), bowl (7), carrot (6), dining table (1) ⇒a table with bowls of food and vegetables .
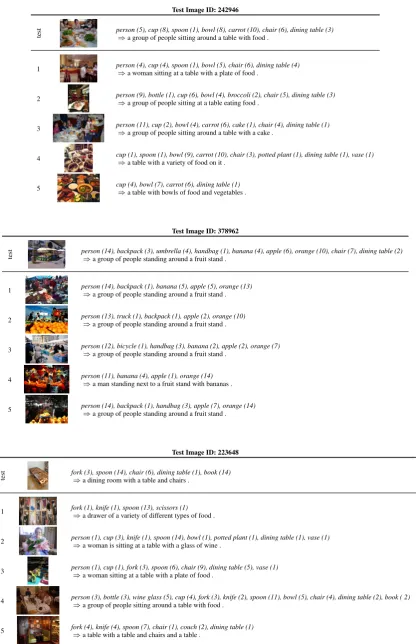
Figure 5: Five nearest neighbours from the training set in the projected space, for an example test image’s (top row) original bag of objects representation that does not have an exact match in the training. For each image, we show the ground truth categories (and frequencies in parenthesis) and the generated caption. More examples
can be found in AppendixD.
projection space. Note that the nearest neighbours are an approximation since we do not know the exact distance metric derived from the LSTM. We observe that the captions for unseen representa-tions seem to be interpolated from multiple neigh-bouring points in the projection space, but further work is needed to analyze the hidden represen-tations of the LSTM to understand the language model and to give firmer conclusions.
4 Spatial information on instances
Here we further explore the effect of incorporat-ing spatial information of object detections for IC. More specifically, we enrich the representations by encoding positional and size information for more object instances, rather than restricting the encod-ing to only one instance per category which makes the representation less informative.
4.1 Spatial representation
We explore encoding object instances and their spatial propertiesas a fixed-size vector. In con-trast to Section 3, we propose handling multiple instances of the same category by encoding spatial properties of individual instances rather than ag-gregating them as a single value. Each instance is represented as a tuple (x,y,w,h,a), wherexand y are the coordinates of the centre of the
bound-ing box and are normalized to the image width
Feature set Fixed Tuned
Bag of objects 0.807 0.834
(x, y, w, h, a) 0.870 0.915
(x, y, w, h) 0.859 0.898
(x, y, a) 0.850 0.900
(w, h) 0.870 0.920
(a) 0.869 0.857
(x, y) 0.810 0.863
[image:7.595.74.294.63.253.2]LSTMYin and Ordonez(2017)† 0.922
Table 4: CIDEr scores for image captioning using rep-resentations encoding spatial information of instances derived from ground truth annotations, with either fixed
hyperparameters (Section3.1) or with hyperparameter
tuning.†Results taken from (Yin and Ordonez,2017).
and height respectively,wandhare the width and
height of the bounding box respectively, and ais
the area covered by the object segment and nor-malized to the image size. Note that w×h ≥ a (box encloses the segment). We assume that
there are maximum 10 instances per vector, and instances of the same category are ordered by a
(largest instance first). We encode each of the 80 categories as separate sets. Non-existent objects are represented with zeros. The dimension of the final vector is 4000(80×10×5). We also
per-form afeature ablationexperiment to isolate the contribution of different spatial components.
4.2 Experiments
All experiments in this subsection use ground truth annotations – we expect the results of using an ob-ject detector to be slightly worse but in most cases follow a similar trend, as shown in the previous section. Table 4 shows the CIDEr scores using the same setup as Section 3, but using represen-tations with spatial information about individual object instances. Encoding spatial information led to substantially better performance over bag of ob-jects alone. Consistent with our previous obser-vation,wandh(bounding box width and height)
seems to be the most informative feature combi-nation – it performs well even without positional information. Area (a) is less informative than the
combination ofwandh, possibly because it
com-presses width-height ratio information despite dis-carding noise from background regions. Positional information (x, y) does not seem to be as
infor-mative, consistent with observations from previ-ous work (Wang and Gaizauskas,2016).
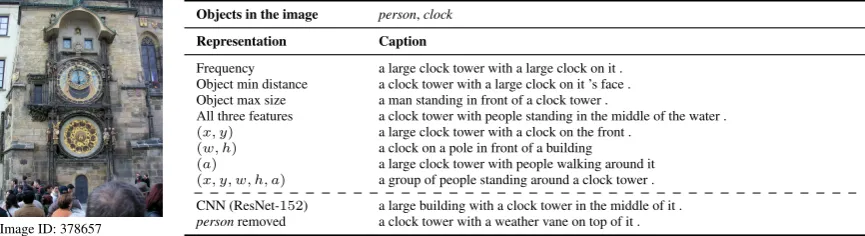
Image ID: 378657
Objects in the image person,clock
Representation Caption
Frequency a large clock tower with a large clock on it . Object min distance a clock tower with a large clock on it ’s face . Object max size a man standing in front of a clock tower .
All three features a clock tower with people standing in the middle of the water .
(x, y) a large clock tower with a clock on the front .
(w, h) a clock on a pole in front of a building
(a) a large clock tower with people walking around it
[image:8.595.94.527.63.181.2](x, y, w, h, a) a group of people standing around a clock tower . CNN (ResNet-152) a large building with a clock tower in the middle of it . personremoved a clock tower with a weather vane on top of it .
Figure 6: Example captions with different models. The models with explicit object detection and additional spatial
information ((x, y, w, h, a)) are more precise in most cases. The output of a standard ResNet-152 POOL5 is also
shown, as well as that of the model where the most salient category –person– is removed from the feature vector.
More example outputs are available in AppendixC.
scores when training the models by performing hyperparameter tuning during training. We note that the results with our simpler image representa-tion are comparable to the ones reported inYin and
Ordonez (2017), which use more complex
mod-els to encode similar image information. Interest-ingly, we observe that positional information (x, y) work better than before tuning in this case.
Example outputs from the models in Sections3
and4can be found in Figure6.
5 Importance of different categories In the previous sections, we explore IC based on explicit detections for80object categories.
How-ever, not all categories are made equal. Some cat-egories could impact IC more than others (Berg
et al.,2012). In this section we investigatewhich
categories are more important for IC on the COCO dataset. Our category ablation experi-ment involves removing one category from the
80-dimensional bag of objects (ground truth
fre-quency) representation at a time, resulting in 80
sets of79D vectors without each ablated category.
We postulate that salient categories should lead to larger performance degradation than others. However, what makes a category ‘salient’ in gen-eral (dog vs. cup)? We hypothesize that it could be due to (i) how frequently it is depicted across images; (ii) how frequently it is mentioned in the captions when depicted in the image. To quantify these hypotheses, wecompute the rank correla-tionbetween changes in CIDEr from removing the category and each of the statistic below:
• f(vc) = PNi 1(c ∈ Ci): frequency of the
ablated categorycbeing annotated amongN
images in the training set, where Ci is the
set of all categories annotated in imagei, and
1(x)is the indicator function.
• p(tc|vc)≈ ff(t(cv,vc)c): proportion of ablated
cat-egory being mentioned in any of the refer-ence captions given that it is annotated in the image in the training set.
For determining whether a depicted category is mentioned in the caption, the matching method de-scribed inRamisa et al.(2015) is used to increase recall by matching category labels with (i) the term themselves; (ii) the head noun for multiword ex-pressions; (iii) WordNet synonyms and hyponyms. We treat these statistics as an approximation be-cause of the potential noise from the matching pro-cess, although it is clean enough for our purposes. We have also tried computing the correlation withf(tc)(frequency of the category being
men-tioned regardless of whether or not it is depicted). However, we found the word matching process too noisy as it is not constrained or grounded on the image (e.g. “hot dog” is matched to thedog cate-gory). Thus, we do not report the results for this.
5.1 Experiments
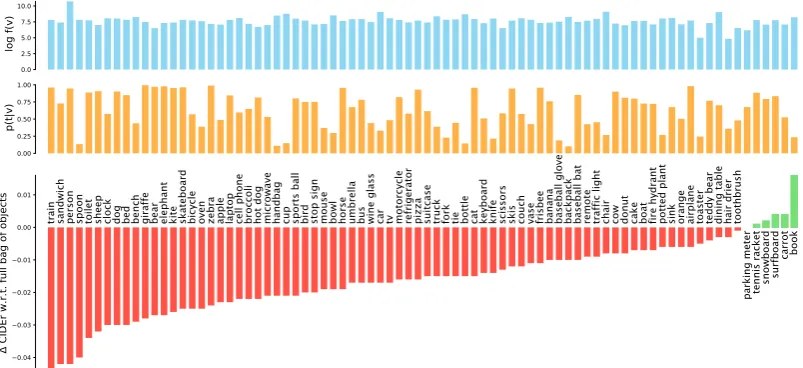
Figure7shows the result of the category ablation experiment. Categories liketrain, sandwich,
per-son and spoon led to the largest drop in CIDEr
scores. On the other end, categories like
surf-board, carrot and book can be removed without
negatively affecting the overall score.
By comparing the CIDEr score changes against the frequency counts of object annotations in the training set (top row), there does not seem to be a clear correlation between depiction frequency and CIDEr. Categories likebearare infrequent but led to a large drop in score; likewise, chair and
0.0 2.5 5.0 7.5 10.0
log f(v)
0.00 0.25 0.50 0.75 1.00
p(t|v)
0.04 0.03 0.02 0.01 0.00 0.01
C
ID
Er
w
.r.
t.
fu
ll b
ag
of
ob
jec
ts
WUDLQ VDQGZLFK SHUVRQ VSRRQ WRLOHW VKHHS FORFN GRJ EHG EHQFK JLUDIIH EHDU HOHSKDQW NLWH VNDWHERDUG ELF\FOH RYHQ ]HEUD DSSOH ODSWRS FHOOSKRQH EURFFROL KRWGRJ PLFURZDYH KDQGEDJ FXS VSRUWVEDOO ELUG VWRSVLJQ PRXVH ERZO KRUVH XPEUHOOD EXV ZLQHJODVV FDU WY PRWRUF\FOH UHIULJHUDWRU SL]]D VXLWFDVH WUXFN IRUN WLH ERWWOH FDW NH\ERDUG NQLIH VFLVVRUV VNLV FRXFK YDVH IULVEHH EDQDQD EDVHEDOOJORYH EDFNSDFN EDVHEDOOEDW UHPRWH WUDIILFOLJKW FKDLU FRZ GRQXW FDNH ERDW ILUHK\GUDQW SRWWHGSODQW VLQN RUDQJH DLUSODQH WRDVWHU WHGG\EHDU GLQLQJWDEOH KDLUGULHU WRRWKEUXVK
SDUNLQJPHWHU WHQQLVUDFNHW VQRZERDUG VXUIERDUG
[image:9.595.95.497.68.252.2]FDUURW ERRN
Figure 7: Difference in CIDEr scores when removing each category from the bag of objects representation (79 dimensions), compared to using the full 80D vector (bottom plot). See main text for details.
Coefficient value (p-value)
f(vc) p(tc|vc) Spearman’sρ 0.137 (0.226) 0.227 (0.043) Kendall’sτ 0.093 (0.223) 0.153 (0.047)
Table 5: Correlation between changes in CIDEr score from category ablation and the frequency of depiction
of the category (f(vc)) against the probably of it being
mentioned in the caption given depiction ((p(tc|vc)).
as negatively. In contrast, the frequency of a cate-gory being mentioned given that it is depicted is a better predictor for the changes in CIDEr scores in general (middle row). Animate objects seem to be important to IC and are often mentioned in cap-tions (Berg et al.,2012). Interestingly, removing
spoongreatly affects the results even though it is
not frequent in captions.
Table 5 presents the rank correlation (Spear-man’sρand Kendall’sτ, two-tailed test) between
changes in CIDEr and the two heuristics. While both heuristics are positively correlated with the changes in CIDEr, we can conclude that the fre-quency of being mentioned (given that it is de-picted) is better correlated with the score changes than the frequency of depiction. Of course, the categories are not mutually exclusive and object co-occurrence may also play a role. However, we leave this analysis for future work.
Figure6 shows an example when the category
personis removed from the feature vector. Here,
the model does not generate any text related to
per-son, as the training set contains images of clocks without people in it.
6 Conclusions
In this paper we investigated end-to-end image captioning by using highly interpretable represen-tations derived from explicit object detections. We provided an in-depth analysis on the efficacy of a variety of cues derived from object detections for IC. We found that frequency counts, object size and position are informative and complementary. We also found that some categories have a bigger impact on IC than others. Our analysis showed that end-to-end IC systems are image matching systems that project image representations into a learned space and allow the LSTM to generate captions for images in that projected space.
Future work includes (i) investigating how ob-ject category information can be better used or ex-panded to improve IC; (ii) analyzing end-to-end IC systems by using interpretable representations that rely on other explicit detectors (e.g. actions, scenes, attributes). The use of such explicit infor-mation about object instances could help improve our understanding of image captioning.
Acknowledgments
References
Peter Anderson, Xiaodong He, Chris Buehler, Damien Teney, Mark Johnson, Stephen Gould, and Lei
Zhang. 2018. Bottom-up and top-down attention
for image captioning and VQA. InProceedings of the IEEE Conference on Computer Vision & Pattern
Recognition (CVPR). IEEE.
Alexander C. Berg, Tamara L. Berg, Hal Daum´e III, Jesse Dodge, Amit Goyal, Xufeng Han, Alyssa Mensch, Margaret Mitchell, Aneesh Sood, Karl
Stratos, and Kota Yamaguchi. 2012. Understanding
and predicting importance in images. In Proceed-ings of the IEEE Conference on Computer Vision
& Pattern Recognition (CVPR), pages 3562–3569.
IEEE.
Djork-Arn´e Clevert, Thomas Unterthiner, and Sepp
Hochreiter. 2016. Fast and accurate deep network
learning by exponential linear units (ELUs). In Pro-ceedings of the International Conference on
Learn-ing Representation (ICLR). arXiv.org.
Michael Denkowski and Alon Lavie. 2014. Meteor
universal: Language specific translation evaluation for any target language. InProceedings of the Ninth
Workshop on Statistical Machine Translation, pages
376–380. Association for Computational Linguis-tics.
Jeffrey Donahue, Lisa Anne Hendricks, Sergio Guadar-rama, Marcus Rohrbach, Subhashini Venugopalan,
Kate Saenko, and Trevor Darrell. 2015. Long-term
recurrent convolutional networks for visual recogni-tion and descriprecogni-tion. In Proceedings of the IEEE Conference on Computer Vision & Pattern
Recogni-tion (CVPR), pages 2625–2634. IEEE.
Desmond Elliott and Frank Keller. 2013. Image
description using visual dependency representa-tions. In Proceedings of the Conference on Em-pirical Methods in Natural Language Processing
(EMNLP), pages 1292–1302. Association for
Com-putational Linguistics.
Mark Everingham, S. M. Ali Eslami, Luc Van Gool, Christopher K. I. Williams, John Winn, and
An-drew Zisserman. 2015. The PASCAL Visual Object
Classes challenge: A retrospective. International
Journal of Computer Vision, 111(1):98–136.
Hao Fang, Saurabh Gupta, Forrest Iandola, Rupesh K. Srivastava, Li Deng, Piotr Dollar, Jianfeng Gao, Xiaodong He, Margaret Mitchell, John C. Platt, C. Lawrence Zitnick, and Geoffrey Zweig. 2015.
From captions to visual concepts and back. In Pro-ceedings of the IEEE Conference on Computer
Vi-sion & Pattern Recognition (CVPR), pages 1473–
1482. IEEE.
Zhe Gan, Chuang Gan, Xiaodong He, Yunchen Pu, Kenneth Tran, Jianfeng Gao, Lawrence Carin, and
Li Deng. 2017. Semantic compositional networks
for visual captioning. InProceedings of the IEEE
Conference on Computer Vision & Pattern
Recogni-tion (CVPR), pages 1141–1150. IEEE.
Sepp Hochreiter and J¨urgen Schmidhuber. 1997.
Long short-term memory. Neural Computation, 9(8):1735–1780.
Andrej Karpathy and Li Fei-Fei. 2015. Deep
visual-semantic alignments for generating image descrip-tions. In Proceedings of the IEEE Conference on
Computer Vision & Pattern Recognition (CVPR),
pages 3128–3137. IEEE.
Girish Kulkarni, Visruth Premraj, Sagnik Dhar, Siming Li, Yejin Choi, Alexander C. Berg, and Tamara L.
Berg. 2011. Baby talk: Understanding and
gener-ating simple image descriptions. InProceedings of the IEEE Conference on Computer Vision & Pattern
Recognition (CVPR), pages 1601–1608. IEEE.
Linghui Li, Sheng Tang, Lixi Deng, Yongdong Zhang,
and Qi Tian. 2017. Image caption with global-local
attention. InProceedings of the AAAI Conference
on Artificial Intelligence (AAAI), pages 4133–4139.
AAAI.
Siming Li, Girish Kulkarni, Tamara L. Berg,
Alexan-der C. Berg, and Yejin Choi. 2011.Composing
sim-ple image descriptions using web-scale n-grams. In
Proceedings of the SIGNLL Conference on
Com-putational Natural Language Learning (CoNLL),
pages 220–228. Association for Computational Lin-guistics.
Tsung-Yi Lin, Michael Maire, Serge Belongie, James Hays, Pietro Perona, Deva Ramanan, Piotr Doll´ar,
and C. Lawrence Zitnick. 2014. Microsoft COCO:
Common objects in context. InProceedings of the
European Conference on Computer Vision (ECCV),
pages 740–755. Springer International Publishing.
Margaret Mitchell, Jesse Dodge, Amit Goyal, Kota Ya-maguchi, Karl Stratos, Xufeng Han, Alyssa Men-sch, Alex Berg, Tamara Berg, and Hal Daum´e III.
2012. Midge: Generating image descriptions from
computer vision detections. InProceedings of the European Chapter of the Association for
Computa-tional Linguistics, pages 747–756. Association for
Computational Linguistics.
Arnau Ramisa, Josiah Wang, Ying Lu, Emmanuel Dellandrea, Francesc Moreno-Noguer, and Robert
Gaizauskas. 2015. Combining geometric, textual
and visual features for predicting prepositions in im-age descriptions. InProceedings of the Conference on Empirical Methods in Natural Language
Pro-cessing (EMNLP), pages 214–220. Association for
Computational Linguistics.
Joseph Redmon and Ali Farhadi. 2017. YOLO9000:
Better, Faster, Stronger. InProceedings of the IEEE Conference on Computer Vision & Pattern
Ilya Sutskever, Oriol Vinyals, and Quoc V Le. 2014.
Sequence to sequence learning with neural net-works. In Z. Ghahramani, M. Welling, C. Cortes,
N. D. Lawrence, and K. Q. Weinberger, editors,
Ad-vances in Neural Information Processing Systems
27, pages 3104–3112. Curran Associates, Inc.
Ramakrishna Vedantam, C. Lawrence Zitnick, and
Devi Parikh. 2015. CIDEr: Consensus-based image
description evaluation. InProceedings of the IEEE Conference on Computer Vision & Pattern
Recogni-tion (CVPR), pages 4566–4575. IEEE.
Oriol Vinyals, Alexander Toshev, Samy Bengio, and
Dumitru Erhan. 2015. Show and tell: A neural
im-age caption generator. InProceedings of the IEEE Conference on Computer Vision & Pattern
Recogni-tion (CVPR), pages 3156–3164. IEEE.
Oriol Vinyals, Alexander Toshev, Samy Bengio, and
Dumitru Erhan. 2017. Show and tell: Lessons
learned from the 2015 MSCOCO image captioning challenge. IEEE Transactions on Pattern Analysis
and Machine Intelligence, 39(4):652–663.
Josiah Wang and Robert Gaizauskas. 2016.Don’t
men-tion the shoe! A learning to rank approach to con-tent selection for image description generation. In
Proceedings of the Ninth International Natural
Lan-guage Generation Conference (INLG), pages 193–
202. Association for Computational Linguistics. Qi Wu, Chunhua Shen, Lingqiao Liu, Anthony Dick,
and Anton van den Hengel. 2016. What value do
ex-plicit high level concepts have in vision to language problems? InProceedings of the IEEE Conference
on Computer Vision & Pattern Recognition (CVPR),
pages 203–212. IEEE.
Kelvin Xu, Jimmy Ba, Ryan Kiros, Kyunghyun Cho, Aaron Courville, Ruslan Salakhudinov, Rich Zemel,
and Yoshua Bengio. 2015. Show, attend and tell:
Neural image caption generation with visual
atten-tion. In Proceedings of the 32nd International
Conference on Machine Learning, volume 37 of
Proceedings of Machine Learning Research, pages
2048–2057. PMLR.
Yezhou Yang, Ching Teo, Hal Daum´e III, and Yiannis
Aloimonos. 2011. Corpus-guided sentence
genera-tion of natural images. InProceedings of the Con-ference on Empirical Methods in Natural Language
Processing (EMNLP), pages 444–454. Association
for Computational Linguistics.
Mark Yatskar, Michel Galley, Lucy Vanderwende, and
Luke Zettlemoyer. 2014. See no evil, say no evil:
Description generation from densely labeled images.
In Proceedings of the Third Joint Conference on
Lexical and Computational Semantics (*SEM 2014),
pages 110–120. Association for Computational Lin-guistics and Dublin City University.
Xuwang Yin and Vicente Ordonez. 2017. Obj2Text:
Generating visually descriptive language from ob-ject layouts. In Proceedings of the Conference on
Empirical Methods in Natural Language Processing
(EMNLP), pages 177–187. Association for
Compu-tational Linguistics.
Quanzeng You, Hailin Jin, Zhaowen Wang, Chen Fang,
and Jiebo Luo. 2016. Image captioning with
seman-tic attention. InProceedings of the IEEE Conference
on Computer Vision & Pattern Recognition (CVPR),
pages 4651–4659. IEEE.
Wojciech Zaremba, Ilya Sutskever, and Oriol Vinyals.
2014. Recurrent neural network regularization.
CoRR, abs/1409.2329.
A Hyperparmeter Settings
The hyperparameter settings for our model are as follows:
• LSTM layers:2-Layer LSTM
• Word Embedding Dimensionality: 128 • Hidden Layer Dimensionality: 256 • Maximum Epochs: 50
• Batch Size: [50, 100]
• LSTM dropout settings: [0.2, 0.7] • Vocabulary threshold: 2
• Learning Rate: [1e-4, 4e-4] • Optimiser: Adam
For items in a range of values, we used grid search to tune the hyperparmeters.
B Full Experimental Results
Tables 6and7 show the results of several of our experiments with the most common metrics used in image captioning: BLEU, Meteor, ROUGEL,
CIDEr and SPICE.
Figure8gives a high resolution version of Fig-ure4, showing the similarity between train and test distributions in terms of object categories.
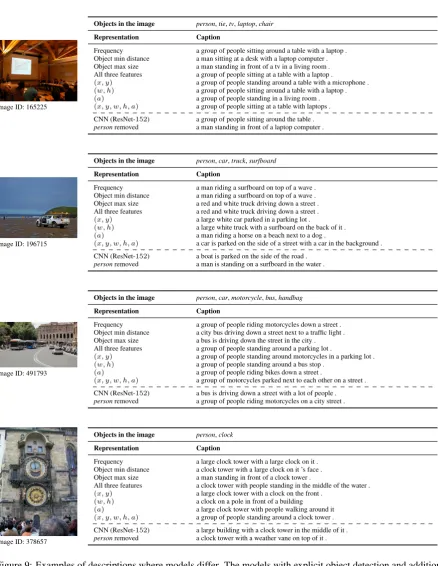
C Example captions for different models Figure9shows example images from COCO and the output captions from different models. We compare the outputs of selected models from Sec-tions3and4, and a model where theperson cate-gory is removed from the input vector (Section5).
D Example nearest neighbours for test images
Representation B1 B2 B3 B4 M R C S
[image:12.595.75.522.78.255.2]ResNet-152 POOL5 0.664 0.480 0.335 0.233 0.220 0.486 0.749 0.150 Frequency 0.668 0.481 0.334 0.231 0.223 0.486 0.807 0.155 Normalized 0.656 0.468 0.324 0.226 0.218 0.477 0.762 0.148 Binarized 0.652 0.465 0.317 0.217 0.218 0.473 0.751 0.146 Object min distance 0.650 0.460 0.316 0.219 0.218 0.474 0.759 0.147 Object max size 0.661 0.476 0.332 0.232 0.224 0.483 0.793 0.151 Obj max size + Obj min distance 0.670 0.482 0.333 0.231 0.225 0.485 0.799 0.153 Frequency + Obj min distance 0.675 0.491 0.345 0.239 0.229 0.495 0.836 0.160 Frequency + Obj max size 0.684 0.496 0.349 0.244 0.228 0.495 0.830 0.159 All three features 0.683 0.501 0.355 0.250 0.229 0.498 0.849 0.162
Table 6: Full results for image captioning using ground truth bag of objects variants as visual representations, for
metricsBLEU,Meteor,ROUGEL,CIDEr andSPICE.
Representation B1 B2 B3 B4 M R C S
Bag of objects 0.668 0.481 0.334 0.231 0.223 0.486 0.807 0.155
(x, y, w, h, a) 0.683 0.503 0.359 0.255 0.233 0.503 0.870 0.163
(x, y, w, h) 0.687 0.503 0.355 0.251 0.233 0.501 0.859 0.166
(x, y, a) 0.683 0.502 0.356 0.250 0.232 0.501 0.850 0.164
(w, h) 0.693 0.511 0.364 0.256 0.233 0.505 0.870 0.165
(a) 0.684 0.503 0.358 0.254 0.232 0.501 0.869 0.162
[image:12.595.113.485.328.454.2](x, y) 0.675 0.488 0.341 0.237 0.224 0.491 0.810 0.155
Table 7: Full results for image captioning, using representations encoding spatial information of instances derived
from ground truth annotations with fixed hyperparameters, for metrics BLEU,Meteor, ROUGEL, CIDEr and
SPICE.
SHUVRQ ELF\FOH
FDU
PRWRUF\FOH DLUSODQH EXV WUDLQ WUXFN ERDW
WUDIILFOLJKW ILUHK\GUDQW VWRSVLJQ
SDUNLQJPHWHU
EHQFK ELUG FDW GRJ KRUVH VKHHS FRZ
HOHSKDQW EHDU ]HEUD JLUDIIH EDFNSDFN XPEUHOOD KDQGEDJ
WLH
VXLWFDVH IULVEHH
VNLV
VQRZERDUG VSRUWVEDOO
NLWH
EDVHEDOOEDW
EDVHEDOOJORYH VNDWHERDUG VXUIERDUG WHQQLVUDFNHW
ERWWOH
ZLQHJODVV
FXS IRUN NQLIH VSRRQ ERZO EDQDQD DSSOH
VDQGZLFK RUDQJH EURFFROL
FDUURW
KRWGRJ SL]]D GRQXW FDNH FKDLU FRXFK
SRWWHGSODQW
EHG
GLQLQJWDEOH
WRLOHW
WY
ODSWRS PRXVH UHPRWH NH\ERDUG FHOOSKRQH PLFURZDYH
RYHQ
WRDVWHU VLQN
UHIULJHUDWRU
ERRN FORFN YDVH
VFLVVRUV
WHGG\EHDU KDLUGULHU WRRWKEUXVK
0.000 0.025 0.050 0.075 0.100 0.125 0.150 0.175
1RUPDOL]HGIUHTXHQF\
Train
Validation split (5000) Test split (5000)
[image:12.595.76.520.542.719.2]Image ID: 165225
Objects in the image person,tie,tv,laptop,chair
Representation Caption
Frequency a group of people sitting around a table with a laptop . Object min distance a man sitting at a desk with a laptop computer . Object max size a man standing in front of a tv in a living room . All three features a group of people sitting at a table with a laptop .
(x, y) a group of people standing around a table with a microphone .
(w, h) a group of people sitting around a table with a laptop .
(a) a group of people standing in a living room .
(x, y, w, h, a) a group of people sitting at a table with laptops . CNN (ResNet-152) a group of people sitting around the table . personremoved a man standing in front of a laptop computer .
Image ID: 196715
Objects in the image person,car,truck,surfboard
Representation Caption
Frequency a man riding a surfboard on top of a wave . Object min distance a man riding a surfboard on top of a wave . Object max size a red and white truck driving down a street . All three features a red and white truck driving down a street .
(x, y) a large white car parked in a parking lot .
(w, h) a large white truck with a surfboard on the back of it .
(a) a man riding a horse on a beach next to a dog .
(x, y, w, h, a) a car is parked on the side of a street with a car in the background .
CNN (ResNet-152) a boat is parked on the side of the road . personremoved a man is standing on a surfboard in the water .
Image ID: 491793
Objects in the image person,car,motorcycle,bus,handbag
Representation Caption
Frequency a group of people riding motorcycles down a street . Object min distance a city bus driving down a street next to a traffic light . Object max size a bus is driving down the street in the city . All three features a group of people standing around a parking lot .
(x, y) a group of people standing around motorcycles in a parking lot .
(w, h) a group of people standing around a bus stop .
(a) a group of people riding bikes down a street .
(x, y, w, h, a) a group of motorcycles parked next to each other on a street .
CNN (ResNet-152) a bus is driving down a street with a lot of people . personremoved a group of people riding motorcycles on a city street .
Image ID: 378657
Objects in the image person,clock
Representation Caption
Frequency a large clock tower with a large clock on it . Object min distance a clock tower with a large clock on it ’s face . Object max size a man standing in front of a clock tower .
All three features a clock tower with people standing in the middle of the water .
(x, y) a large clock tower with a clock on the front .
(w, h) a clock on a pole in front of a building
(a) a large clock tower with people walking around it
(x, y, w, h, a) a group of people standing around a clock tower .
[image:13.595.76.515.95.662.2]CNN (ResNet-152) a large building with a clock tower in the middle of it . personremoved a clock tower with a weather vane on top of it .
Figure 9: Examples of descriptions where models differ. The models with explicit object detection and additional
spatial information ((x, y, w, h, a)) is more precise in most cases (even though still incorrect in the second
exam-ple). In the first example, aggregating multiple instances for size and distance cues clearly removes the information about the group of people in the image. The output of a standard CNN (ResNet-152 POOL5) is also shown, as
Test Image ID: 242946
test person (5), cup (8), spoon (1), bowl (8), carrot (10), chair (6), dining table (3)⇒a group of people sitting around a table with food .
1 person (4), cup (4), spoon (1), bowl (5), chair (6), dining table (4)
⇒a woman sitting at a table with a plate of food .
2 person (9), bottle (1), cup (6), bowl (4), broccoli (2), chair (5), dining table (3)
⇒a group of people sitting at a table eating food .
3 person (11), cup (2), bowl (4), carrot (6), cake (1), chair (4), dining table (1)⇒a group of people sitting around a table with a cake .
4 cup (1), spoon (1), bowl (9), carrot (10), chair (3), potted plant (1), dining table (1), vase (1)⇒a table with a variety of food on it .
5 cup (4), bowl (7), carrot (6), dining table (1)⇒a table with bowls of food and vegetables .
Test Image ID: 378962
test person (14), backpack (3), umbrella (4), handbag (1), banana (4), apple (6), orange (10), chair (7), dining table (2)⇒a group of people standing around a fruit stand .
1 person (14), backpack (1), banana (5), apple (5), orange (13)⇒a group of people standing around a fruit stand .
2 person (13), truck (1), backpack (1), apple (2), orange (10)⇒a group of people standing around a fruit stand .
3 person (12), bicycle (1), handbag (3), banana (2), apple (2), orange (7)
⇒a group of people standing around a fruit stand .
4 person (11), banana (4), apple (1), orange (14)
⇒a man standing next to a fruit stand with bananas .
5 person (14), backpack (1), handbag (3), apple (7), orange (14)
⇒a group of people standing around a fruit stand .
Test Image ID: 223648
test fork (3), spoon (14), chair (6), dining table (1), book (14)⇒a dining room with a table and chairs .
1 fork (1), knife (1), spoon (13), scissors (1)
⇒a drawer of a variety of different types of food .
2 person (1), cup (3), knife (1), spoon (14), bowl (1), potted plant (1), dining table (1), vase (1)⇒a woman is sitting at a table with a glass of wine .
3 person (1), cup (1), fork (3), spoon (6), chair (9), dining table (5), vase (1)⇒a woman sitting at a table with a plate of food .
4 person (3), bottle (3), wine glass (5), cup (4), fork (3), knife (2), spoon (11), bowl (5), chair (4), dining table (2), book ( 2)⇒a group of people sitting around a table with food .
5 fork (4), knife (4), spoon (7), chair (1), couch (2), dining table (1)
[image:14.595.93.513.62.707.2]⇒a table with a table and chairs and a table .