Enabling QM-accurate simulation of dislocation motion in
γ
-Ni
and
α
-Fe using a hybrid multiscale approach
F. Bianchini*and A. Glielmo
Department of Physics, King’s College London, Strand, London WC2R 2LS, United Kingdom
J. R. Kermode†
Warwick Centre for Predictive Modelling, School of Engineering, University of Warwick, Coventry CV4 7AL, United Kingdom
A. De Vita
Department of Physics, King’s College London, Strand, London WC2R 2LS, United Kingdom and Department of Engineering and Architecture, University of Trieste, Via Alfonso Valerio, 34127 Trieste, Italy
(Received 4 September 2018; revised manuscript received 10 December 2018; published 16 April 2019)
We present an extension of the ‘learn on the fly’ method to the study of the motion of dislocations in metallic systems, developed with the aim of producing information-efficient force models that can be systematically validated against reference QM calculations. Nye tensor analysis is used to dynamically track the quantum region centered at the core of a dislocation, thus enabling quantum mechanics/molecular mechanics simulations. The technique is used to study the motion of screw dislocations in Ni-Al systems, relevant to plastic deformation in Ni-based alloys, at a variety of temperature/strain conditions. These simulations reveal only a moderate spacing (∼5 Å) between Shockley partial dislocations, at variance with the predictions of traditional molecular dynamics (MD) simulation using interatomic potentials, which yields a much larger spacing in the high stress regime. The discrepancy can be rationalized in terms of the elastic properties of an hcp crystal, which influence the behavior of the stacking fault region between Shockley partial dislocations. The transferability of this technique to more challenging systems is addressed, focusing on the expected accuracy of such calculations. The bccα-Fe phase is a prime example, as its magnetic properties at the open surfaces make it particularly challenging for embedding-based QM/MM techniques. Our tests reveal that high accuracy can still be obtained at the core of a dislocation, albeit at a significant computational cost for fully converged results. However, we find this cost can be reduced by using a machine learning approach to progressively reduce the rate of expensive QM calculations required during the dynamical simulations, as the size of the QM database increases.
DOI:10.1103/PhysRevMaterials.3.043605
I. INTRODUCTION
The need to produce accurate dynamical representations of chemical processes involving defects in metallic systems has been steadily increasing in recent years. An accurate description of dislocations, including plastic deformation and the effects of impurity atoms, could provide crucial and currently missing insight for industrially relevant problems, for example helping to elucidate the effect of Rhenium in Ni-based superalloys [1], or the fundamental mechanisms underlying hydrogen embrittlement of steels [2,3]. Density functional theory (DFT) is a tremendously useful tool and
*Present address: Center for Materials Science and
Nanotechnol-ogy, Department of Chemistry, University of Oslo, P.O. Box 1033, Blindern, N-0315 Oslo, Norway.
†J.R.Kermode@[email protected]
Published by the American Physical Society under the terms of the
Creative Commons Attribution 4.0 International license. Further distribution of this work must maintain attribution to the author(s) and the published article’s title, journal citation, and DOI.
nowadays a standard technique in many branches of physics, chemistry, and materials science [4]. State-of-the-art imple-mentations of this technique are, however, limited to a few hundred atoms (growing to a few thousand for linear scaling approaches [5], although these are currently not suitable for modeling metallic systems) and to a∼10 ps timescale. Much larger model systems are required to accommodate the elastic field of dislocations or to describe systems closely resembling experimental samples [6]. These systems are usually modelled using interatomic potentials whose accuracy has been the subject of significant research effort.
model (EAM), originally proposed by Daw, Murray, and Baskes for the study of crystal defects in metallic systems [9] and widely applied for molecular dynamics simulations of pure or binary systems (e.g., fracture inα-Fe [10] or plastic deformation at the γ /γ interface in Ni alloys [6]), (ii) the modified EAM (MEAM), where angular dependence of the bonding is explicitly considered, allowing deviations from purely metallic bonding to be described [11], (iii) the reactive force field (ReaxFF) model, originally developed for model-ing hydrocarbons but extended over the years to a number of different systems, including fcc and bcc metals [12], (iv) the charge optimized many-body (COMB) potential, capable of capturing charge transfer effects and recently employed for the study of misfit dislocation at the γ /γ interface in Ni-based superalloys [13]. Unfortunately, the high accuracy of these classes of interatomic potential is generally limited to a restricted range of atomic species and phases. The develop-ment of accurate parametrized potentials including even more complex chemical environments poses significant challenges and is difficult to systematically validate, in particular for use in truly predictive situations [14]. In practice, for many (but not all) “chemomechanical” problems involving realistic metallic systems the use of classical MD is not viable, as suitably general and accurate (“reactive”) force fields are not available, nor is it clear how to produce fitting databases
a priori guaranteed to contain the information necessary to
describe all the chemical processes which might be encoun-tered during dynamics. A range of embedding approaches have been proposed to address this length scale problem. Pioneer work by Rao, Woodward et al. [15] demonstrated how it is possible to embed a DFT calculation in a much larger elastic medium. This approach has been applied to compute strengthening effects of impurities in alloys [16] and core structures in Ni-based superalloys [17]. The QM-CADD approach [18] allows dislocations to be seamlessly trans-ported from atomistic to continuum regions. Multiprecision QM/MM techniques [19] allow chemically complex regions to be described with QM accuracy, while faraway atoms provide the correct elastic embedding, typically accurately described by MM modeling. This is particularly useful for the modeling of chemomechanical processes, in which a chemical process in a small region affects the macroscopic response of a system. Within the framework of energy-based QM/MM techniques, the total energy of a system is written as the sum of a classical term for the MM region, a quantum term for the QM one and an interaction term. This artificial interface might lead to an incorrect charge density and to spurious ionic forces permeating into the QM region. This issue has been recently addressed by constraining the charge density at the QM/MM interface to an accurate target density that reflects the atomistic configuration within the MM region [20]. The method reproduces the QM charge density and the magnetic moments of bulk materials (Al, Fe, Pd) and produces a reasonable edge dislocation core structure for bulk iron. In another work, the QM region is embedded in a suitable atomistic virtual environment (not the MM region), so that the QM calculation is performed in a periodic system rather than a cluster of atoms, thus reducing the effect of Friedel oscillations propagating from the free surface [21]. These QM/MM approaches provide accurate structural models that
can be used for identifying the equilibrium configuration of crystal defects in metals with QM accuracy. However, none of these approaches can model temperature or free-energy effects.
The “learn on the fly” (LOTF) scheme [22] is a QM/MM algorithm based on the fitting of a corrective energy function, fitted to reproduce target QM forces in the core region and augmented by a predictor/corrector algorithm for computa-tional efficiency. This method has been successfully adopted to simulate a number of problems related to fracture in semiconductor materials, including impurity-driven scattering mechanisms [23] and stress corrosion [24]. Recently, it has been shown that the LOTF approach can be applied to the study of dislocations in metallic systems [25] and can be extended to compute potential energy barriers to dislocation glide [26]. Moreover, dynamical QM/MM simulations pro-duce large amounts of first-principles data, which can be used as part of a training database for a machine learning (ML) model aimed at the construction of an accurate force field (FF), capable of replacing the QM method whenever “new” configurations (not well represented within the training database) are not encountered. Recent years have seen a growing research interest in such data-driven approaches with the goal of significantly increasing the time scales accessible to simulations. There are two broad classes of ML approaches: (i) learn “once and for all” approaches where the potential energy surface of the target systems is fitted once-and-for-all using, e.g., neural networks [27] or Gaussian process regres-sion [28], with the latter recently applied to iron [29–31]; (ii) “on-the-fly learning” approaches where the force model is trained adaptively using a database of QM forces calculated during an MD run [32–34]. The second class of method has also lead to the development of an ML extension of the LOTF algorithm [32].
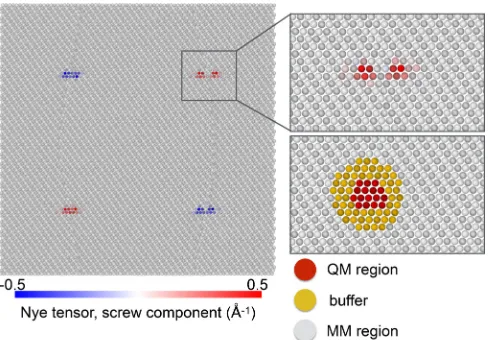
FIG. 1. Quadrupole of screw dislocations in γ-Ni during a QM/MM simulation at room temperature. Atoms are colored ac-cording to the value of the screw component of the Nye tensor, which was also used to define the QM region. For clarity, only one of the two overlapping QM regions is shown in the lower right panel.
principle achieve accurate prediction of QM forces for the materials and systems presented in this work and could thus provide appropriate support to the use of LOTF techniques.
II. COMPUTATIONAL METHODS
A. Simulation cell
The Ni/Al system is modelled using a quasi-2D periodic cell comprised of a quadrupole of screw dislocations in theγ matrix, as illustrated in Fig.1. The system is oriented withz orthogonal to the dislocation lineξ = √1
2[¯110] andynormal
to the close packed family of planes{111}. Thexaxis, parallel to [11¯2], is the direction of motion of a gliding a2¯110{111} dislocation. The system length along the directions orthogonal toξis∼170 Å, corresponding to a distance of∼80 Å between screw dislocations. This maximum distance between disloca-tion cores is on average preserved during a MD simuladisloca-tion due to the symmetry of the system. The system length alongz is chosen to be 5 Å (two elementary units), periodic along the dislocation line, effectively decreasing the number of atoms required for the QM treatment and thus increasing the overall simulation speed. We used the linear elastic displacement field solution to add four perfect screw dislocations to the matrix and then relaxed them with the EAM potential, leading to dissociation into pairs of Shockley partials. We selected this geometry principally to enable direct comparisons between the QM/MM and EAM models; we note that the choice of a quadrupole dislocation arrangement does not fully decouple the dislocations from one another [35,36]. Before carrying out MD simulations, the perfect crystal is initially rescaled according to the expected thermal expansion for the EAM potential, as calculated in Ref. [37].
B. The QM/MM scheme
First-principles calculations are performed using the projected-augmented wave (PAW) implementation of the Viennaab initiosimulation package (VASP) [38,39]. The
Perdew, Burke, and Ernzerhof (PBE) functional [40] is used for the exchange-correlation term. Brillouin zone integration is performed with Monkhorst-Pack grids [41]. The electronic smearing is included following the Methfessel-Paxton scheme [42], with a broadening of 0.1 eV. We follow the LOTF simulation scheme, as described in Ref. [23], modifying the buffer termination and the QM selection scheme, as detailed below. The saturation of broken bonds with hydrogen atoms, which previously proved to be essential to obtain accurate forces on QM clusters in covalent materials [23], is not necessary for metals, due to the lack of directionality of bonds. Accurate DFT forces for Ni clusters can instead be obtained with a bare surface providing a sufficiently large buffer region is used, as discussed in our earlier work [25]. The QM selection scheme mirrors the topology and structure of the material defects. The topological criteria used for studying fracture in brittle materials are not appropriate here, as a clear difference in the coordination number at the dislocation core is not always observed as the position of the dislocation evolves at finite temperatures. Instead, we used the Nye tensorαto identify and track dislocation cores. This was originally developed in Ref. [43] and more recently extended to atomistic systems. It is now well established as a tool capable of identifying dislocation cores by analyzing the local environment of an atom [44] and it is here used to locate the QM region. We note that the average force error of the EAM potential with respect to DFT is proportional to the magnitude of the Nye tensor components, as demonstrated in Ref. [25]. In the specific case of a screw dislocation dissociated into SPs, only two components of this tensor are relevant, α33 and α31, with the former contributing to the
screw component of the Burgers vector and the latter to the edge. The atomic-resolved screw componentα33is equivalent
for the two SPs and integrating it over the plane normal to the dislocation line produces the total Burgers vector. In the case of the edge componentα31, contributions from the two
SPs have opposite signs, and the surface integral vanishes. However, integrating only in the neighborhood of the SP core would produce the modulus of the edge component of the SP dislocation. A plot of these quantities if shown in Fig.10.
A key advantage of buffered QM/MM schemes such as the LOTF is the possibility of updating the selection of the QM atoms during a simulation, thus allowing a moving defect to be tracked using a QM cluster of minimal size [19]. In this work, we initially identify the QM region with the position of two atoms giving large contributions to the Nye tensor (α33>0.04 Å−
1
), with a separation d comparable with the equilibrium SP separation value of 5 Å. Two circular regions of radius d/2 are selected, and the position of the cores is updated as the average of the atomic positions usingα33 as
weight. Note that this quantity does not need to be updated at every time step of the molecular dynamics simulation (2 fs), as the thermal oscillation frequency of the core is smaller than that of individual atoms. A QM calculation is similarly not necessary at every step, and the force error can be controlled using a predictor-corrector scheme, as implemented in the LOTF method [22]. Testing reveals that a QM calculation is necessary every 7 time steps (14 fs) to maintain the force error below 0.1 eV/Å. The QM region is updated using a hysteretic selection algorithm [19], with inner and outer selection radii of din=3 Å and dout =5 Å, respectively, to
reduce fluctuations in the set of QM atoms. These small QM regions are enough to ensure good accuracy, as atoms farther than 4 Å from dislocation cores exhibit bulklike behavior [25]. The buffer atoms are required to decouple the QM region from the surface states, thus ensuring accurate QM forces for the QM/MM embedding. In the case of γ-Ni, this is obtained with a 5 Å buffer [25], leading to clusters containing ∼50 atoms. Due to the geometry of the simulation cell, these clusters are periodic along the line direction z. Vacuum is introduced only in the (x,y) plane and the Brillouin zone sampled with a 1×1×7 MP grid which reduces to 4 k
points once time reversal symmetry is taken into account. The force convergence threshold of 0.1 eV/Å is chosen as a compromise between the accuracy of the simulation and its computational cost. This value is compatible with the typical EAM force errors for bulklike systems with respect to a DFT reference, as shown in Ref. [25]. More accurate results can be achieved with the LOTF method, albeit at larger computational cost. For example, errors below 0.05 eV/Å on an individual QM atom can be achieved using a cluster of ∼250 atoms, corresponding to an increase in computational cost by a factor of 53=125 for cubic scaling DFT (see also
AppendixC). The full system is shown in Fig.1, coloring the atoms according to the screw Nye tensor componentα33, and
with the QM selection algorithm illustrated in the right panel.
C. Machine learning approach
The redundancy in the configurations visited during the course of an ab initio MD simulation allows the construc-tion of an accurate FF directly built from the QM data. Gaussian process (GP) regression provides a parameter-free data interpolation technique [45,46] that can be efficiently employed to make use of these data. A reference database is built by associating the forces {fi}Ni=1 on a collection of
N atoms with the corresponding local environments{ρi}N i=1
of the same atoms. Such local environments are typically stored as the positions (relative to the central atom) of all the particles within an appropriate cutoff radius. The measure
of the correlation between forces associated with different configurations ρ, ρ is defined to be a matrix-valued kernel functionK(ρ, ρ). This can also be augmented by encoding specific prior knowledge, e.g., the symmetries of the system [30]. The GP prediction of the force associated with a new configurationρ∗is given by evaluating its correlation with all the elements in the dataset [45,46],
f(ρ∗)=
N
i=1
K(ρi, ρ∗)ci, (1)
where the vectors{ci}can be found in closed form [47,48]. There are various reasons why GP regression can be prefer-able to standard fitting of a fixed function of interatomic positions. For instance, since no system-specific functional form has to be identified, this kind of regression generally re-quires very littlead hoctuning—model (kernel) selection can be easily streamlined. Furthermore, GPs typically improve their predictive accuracy as the database size grows, so that an arbitrary accuracy can be achieved when enough data is available for a suitable choice of kernel functions.
To test the capabilities of ML models, we collected a database by performingab initio MD simulations of nickel and iron in their crystalline cubic phases, using 4×4×4 supercells of their respective fcc and bcc elementary cells. The MD simulations were carried out within the canonical en-semble using a Langevin thermostat with a friction coefficient γ =2 ps−1. Brillouin zone sampling was carried out using a 4×4×4 MP grid, and symmetries in both real and reciprocal space were disregarded to improve the simulation accuracy; other DFT parameters are as described in Sec. II B above. This database was then randomly separated into a training set and a test set. To build a kernel function incorporating the symmetries of the system we first constructed a permu-tationally invariant distance as described in Refs. [30,31,49]. We then used this distance in a squared exponential kernel [45], symmetrized over the point group of the crystal (for full details refer to Ref. [30]).
III. LOTF SIMULATION OF DISLOCATIONS INγNICKEL
TABLE I. Average SP separation at finite temperature for dif-ferent stress regimes and compositions, as evaluated by Nye tensor analysis of MM and QM/MM simulations.
T(K) σ(MPa) Al (%) dQM/MM(Å) dMM(Å)
50 100 0 Al 4.5±0.3 5.3±0.6
50 100 5 Al 4.5±0.3 5.3±0.6
1000 200 5 Al 4.3±0.5 5.2±1.6
1000 200 15 Al 4.6±1.3 11.1±3.3
50 300 5 Al 4.6±0.4 9.1±1.8
50 300 15 Al 8.2±1.8 14.7±2.3
deviation between DFT and EAM forces is maximal (as shown in Ref. [25]). For the EAM-relaxed configuration, we obtain an SP core separation of 5 Å with the Nye method and 10 Å with the CNA method, consistent with previous literature results using the same potential in Ref. [51]. We note that this low temperature value for the separation is likely to be correct within the EAM scheme, as it only depends on the shear modulus and on the ISF energy, which are both accurately reproduced by the potential [37]. The validity of this description as a function of temperature, stress, and chemical complexity is addressed in this work.
Note that applying a shear strain to the system is not expected to affect the SP separation distance, with any de-viation from this behavior representing an inadequacy of the modeling of interatomic interactions in the system. The applied shear stress also determines the velocity of a gliding dislocation. We have decided to use finite stress values in all our simulations, as this would allow for extensive testing of the QM region tracking algorithm presented in this work.
[image:5.608.51.295.105.201.2]We initially thermalized the system at a target simulation temperature for 5 ps, using the EAM potential for all atoms. After thermalization, a shear strain yz is applied, and the simulation is carried on for another 1 ps. A further 0.5 ps of QM/MM dynamics follows, to re-equilibrate the system after the change of the Hamiltonian, before production cal-culations. Production QM/MM calculations were carried out for 2 ps. The MM and the QM/MM calculations are found to predict different core geometries and separations for the SP dislocations. The SP separation distances, averaged over time and over the four dislocations in the simulation cell, are reported in TableIfor systems under different conditions of temperature, stress, and chemical composition. In the low stress, low temperature (50 K, 100 MPa) regime the MM and the QM/MM results are completely consistent, with no significant difference observed in the 0% to 5% Al concen-tration interval. This is also consistent with the accuracy of EAM-predicted stacking-fault energies and elastic moduli. A good agreement between the two methods is also found in the high temperature (1000 K) regime, as long as the percentage of Al in the matrix is small (5% or below). For a larger percentage of Al (15%), the distance between SPs increases significantly, consistently with the overestimation of the ISF energy incurred by the EAM compared with the DFT predictions (see AppendixA). In these conditions, we observe the EAM-modelled pair of partial dislocations develops a very large separation distance of∼11 Å, which fluctuates but never
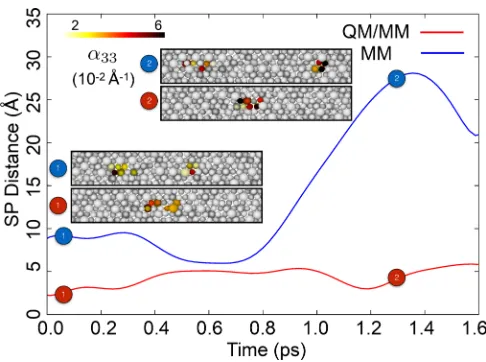
FIG. 2. Time-averaged SPs separation and geometries for a QM/MM and a MM simulation at high temperature conditions (1000 K, 200 MPa) for an alloy containing 15% Al. Al atoms are represented using larger spheres.
reverts to the initial value in the simulation time scale. The corresponding QM/MM simulation does not exhibit devia-tions from the equilibrium value of∼5 Å, as reported in Fig.2. The corresponding initial and final configurations are also shown in the figure, coloring atoms by Nye tensor to highlight the position of the dislocation cores. We next consider the high-stress low-temperature case (300 MPa, 50 K). In the low Al composition (5%) case, the distances measured with QM/MM are still broadly in line with the previously observed results, whereas the MM ones are larger by a factor of two. In the yet more complex case of high Al composition (15%) under high stress, the average MM-predicted distance between SPs is 15 Å, the largest average value encountered in this work. We interpret this to be due to the combined effects of a “soft” hcp phase and underestimated ISF for high Al com-positions. Under these conditions, the QM/MM separation is larger than that observed in the previous cases. It is thus likely that under these working conditions larger QM regions, covering the whole stacking fault, have to be used in order to avoid spurious SP geometries.
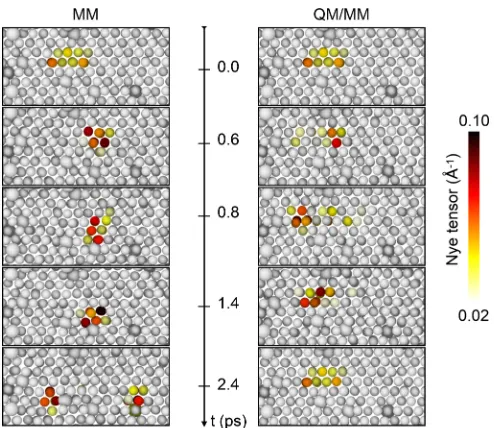
FIG. 3. Comparison between molecular dynamics trajectories in the MM and QM/MM approach. Selected frames from simulation at (1000 K, 200 MPa, and 5% Al). Al atoms are represented using larger spheres.
presence of a larger number of Al atoms in the current layer. In the QM/MM case, the distance between SP oscillates, but cross-slip phenomena are never observed.
To summarize, we find that the EAM potential gives rea-sonable results only at low temperature, for small values of the applied deformation and only when low concentrations of impurities are present in the matrix. As previously noted, all the inconsistencies between QM and MM simulations derive from an overly soft description of the HCP phase, making it easier to stretch (large stress) or contract (high temperature) depending on the simulation parameters. Accounting for this issue could greatly improve the accuracy of the specific EAM potential under examination. With this in mind, we dedicate the remainder of this section to the identification of the discrepancy between the QM and the QM/MM approaches. This can be separated into two independent contributions arising from the elastic energy of the hcp phase and from the chemical composition of the alloy. The latter is not difficult to rationalize: The Al-Ni pair interaction is fitted to the γ phase. This description is not transferable to the Al impurity in the Ni matrix, due to the similarity between the chemical environment of these atoms, and the binding energy of the de-fect is overestimated, leading to a smaller ISF energy. A more complete discussion of this issue is provided in AppendixA. The strain component of the EAM error is more subtle. We started by noticing that, while the energy difference between the fcc and the hcp phases is included in the fitting database for the EAM potential, the elastic constants for the latter are not. We calculated and compared the elastic energies using an orthorhombic simulation cell, with thez axis parallel to the [111] direction. The hcp and fcc crystals unit cells contain four and six atoms, respectively. These were periodically reproduced along z to obtain two easily comparable, stoi-chiometric structures containing six{111}layers each. Com-pressive and tensile strains in the range±10% were applied
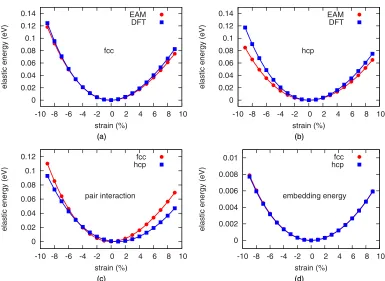
alongz with 1% increments, to compute energy differences with respect to the equilibrium reference, displayed in Fig.4. Good agreement between DFT and EAM is observed for fcc, consistent with the potential having been fitted to the elastic constants [37]. On the other hand, the elastic energy of the hcp crystal is underestimated. This is particularly true in the near anharmonic regime for compressive strains, with errors larger than 25% for strains above 5%. This last feature is surprising, as expectations of the limited transferability of a classical potential would normally suggest a different likely scenario, i.e., one with similar predicted elastic energetics in two materials for which the first shell of neighbors of each atom are the same. We therefore attempted to trace the origin of this effect, considering the interatomic potential in more detail. Within the EAM model, the total energy of a system of N atoms is represented as the sum of a pair interaction term and an embedding many-body one:
Etot=
1 2
N
i j=1
φ(ri j)+ N
i=1
F ⎛ ⎝N
j ρ(ri j)
⎞
⎠, (2)
whereri j are the interatomic distances. The pair interaction φ(r) is a generalization of the Lennard-Jones potential. The embedding energy termF(ρ) is constructed using a density functionρ(r), taken to be a combination of exponentials, and obtained by fitting the EAM to an equation of state [37].
0 0.02 0.04 0.06 0.08 0.1 0.12 0.14
-10 -8 -6 -4 -2 0 2 4 6 8 10
elastic energy (eV)
strain (%)
(a) (b)
fcc EAM
DFT
0 0.02 0.04 0.06 0.08 0.1 0.12 0.14
-10 -8 -6 -4 -2 0 2 4 6 8 10
elastic energy (eV)
strain (%)
(a) (b)
hcp EAM
DFT
0 0.02 0.04 0.06 0.08 0.1 0.12
-10 -8 -6 -4 -2 0 2 4 6 8 10
elastic energy (eV)
strain (%)
(c) (d)
pair interaction fcc hcp
0 0.002 0.004 0.006 0.008 0.01
-10 -8 -6 -4 -2 0 2 4 6 8 10
elastic energy (eV)
strain (%)
(c) (d)
[image:7.608.112.497.64.345.2]embedding energy fcc hcp
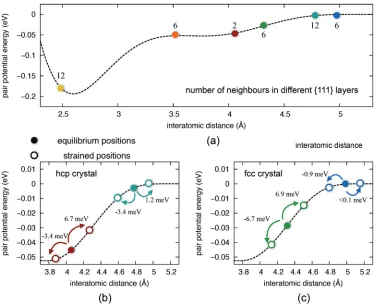
FIG. 4. Elastic energy due to strain along the [111] direction calculated using DFT (blue lines) and EAM (red lines) for nickel fcc (a) and hcp (b) crystals. Associated contributions to the EAM elastic energy: pair interaction (c) and embedding energy (d) for nickel fcc (red circles) and hcp (blue squares) crystals.
contributes 12×1.2 meV. In the case of compression, the (teal) fourth shell is associated with a significant contribution of 12× −3.4 meV, which is this time more than enough to balance the effect of the (green) third neighbor fcc shell (6× −6.7 meV). A further stabilizing contribution to the energy in the hcp crystal is then associated with the presence of the (red) third neighbor two-atom shell (2× −3.4 meV). The fourth neighbor fcc shell [blue in Fig.6(c)] does not meanwhile pro-vide a significant stabilizing contribution, again because these atoms lay close to the pair interaction cutoff distance. As a re-sult of adding these negative contributions to the energy upon
FIG. 5. First four shells of neighbors in different{111}layers for fcc (a),(b) and hcp (c),(d) crystals.
compression, a soft hcp phase is predicted, which accounts for the discrepancy of the curves in Fig.5(b). This observation illustrates the challenges of capturing the elastic response of both the fcc and hcp by means of a single pair potential form and provides a practical example of the subtle transferability issues that interatomic potentials may encounter, even state of the art high-quality ones that very accurately and usefully describe the phase they were originally designed for, as is the case here.
IV. LOTF FOR METALLIC SYSTEMS: FUTURE PROSPECTS
A. Extension to other materials
[image:7.608.52.298.548.724.2]FIG. 6. Pair interaction potential for Ni atoms. Panel (a): full energy profile (dashed line) and neighbors positions (circles). The number of atoms in each shell is also indicated. In panels (b) and (c) the pair interaction is plotted for the third and the fourth shells of neighbors, which are different in the two structures. The equilibrium (full circles) and deformed (5% strain, empty circles) positions are indicated, together with the elastic energy variation per atom upon deformation, for each shell of neighboring atoms.
QM calculations. To exemplify this situation and illustrate a possible way forward (using a data-driven approach—see the next subsection), we describe preparatory work for the simulation of a screw dislocation inα-Fe in a multiprecision scheme. This complements earlier results for nickel already presented in Ref. [25].
Iron is a challenging material for QM/MM approaches, as the magnetization is much larger than in nickel alloys. Spuri-ous spin rearrangement at the surfaces of the QM clusters will be correspondingly higher, so that Fermi-level crossing effects become more likely to propagate to the center and affect the calculated forces, making large QM clusters necessary. This is explicitly shown in AppendixC, by plotting the projected density of states of a single QM atom for spherical clusters of increasing size, comparing the cases of iron and nickel. Vari-ous heuristic approaches to mitigate the slow convergence of the central atom to a bulklike electronic structure with respect to the width of the buffer are investigated here, including (i) imposing a larger Fermi-energy smearing width and (ii) al-lowing the QM cluster to host a net charge or (iii) constraining the magnetization at the surface to its equilibrium value. The usage of dipole corrections is found to not affect the computed forces significantly, indicating that electric dipoles generated on the QM clusters by surface effects are negligible. We stud-ied the convergence of the QM forces with respect to cluster radius for two systems: a 4×4×4 supercell of bulkα-Fe (128 atoms) and a larger one centered on aa2111{110}screw dislocation. Classical calculations were performed using a
0 0.05 0.1 0.15 0.2 0.25 0.3 0.35 0.4 0.45 0.5
20 40 60 80 100 120 140
force error (eV/
Å
)
number of atoms
(a) (b)
(c) (d)
FM NM
−0.4 −0.2 0 0.2 0.4 0.6 0.8 1 1.2 1.4
0 1 2 3 4 5 6 7 8
magn. error (a.u.)
distance from central atom (Å)
(a) (b)
(c) (d)
cl3 cl6 cl9 cl12
0 0.05 0.1 0.15 0.2 0.25 0.3
0 20 40 60 80 100 120 140 160 180
force error (eV/
Å
)
number of atoms
(a) (b)
(c) (d)
0.1 eV 0.5 eV
0.1 0.12 0.14 0.16 0.18 0.2 0.22 0.24 0.26 0.28 0.3
−6 −4 −2 0 2 4 6
force error (eV/Å)
additional charge (e)
(a) (b)
(c) (d)
59 atoms
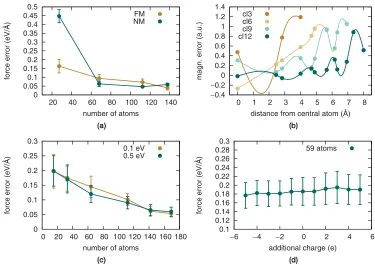
FIG. 7. (a) Convergence of DFT forces with respect to the size of the cluster for ferromagnetic (FM) and artificial nonmagnetic (NM) bulk iron structures. (b) Magnetization error with respect to bulk for atomic shells in differently-sized iron clusters. (c) Convergence of the DFT forces on atoms neighboring a dislocation core. (d) Effect of adding/removing charge from the clusters.
neighbor shells [“cl3” orange symbol in Fig. 7(b)]. Moving to atoms neighboring the surface, the magnetization can be as much as 50% larger than its bulk value. We find that, for the central atom and its nearest neighbors to be unaffected by surface effects, large clusters including as many as twelve neighbor shells must be used.
[image:9.608.116.491.69.334.2]Next, we tried constraining the magnetic moment of the atoms in the QM clusters to its bulk value to mimic the average environment far from surfaces, in order to investigate whether this could yield converged QM forces for smaller cluster sizes. This was done by computing the magnetic moment from a Mulliken analysis in a sphere centered on each atom and adding a penalty term to the total energy proportional to the square of the deviation of each magnetic moment from its target bulk value, summed over all atoms in the cluster. The strength of the constraint can be tuned by varying the penalty term prefactorλ, which ideally should be as large as possible to force a nearly constant magnetization across the QM cluster but still small enough not to induce instabilities in the self-consistent electronic structure optimization loop. Our atomic force results for clusters extracted from the 1200 K trajectory and containing∼60 atoms [the same used for the calculations reported in Fig.7(a)] are presented in Table II. These calculations show larger deviations of the forces from
TABLE II. Relation between the strength of the magnetic mo-ment constraint and the force error.
λ 0 1 5
f(eV/Å) 0.09±0.02 0.10±2 0.12±0.03
the correct QM target values as theλparameter is increased from zero (unconstrained calculation) to higher values, indi-cating that constraining magnetic moments cannot easily be used to speed up force convergence.
[image:9.608.47.297.710.750.2]−2 −1.5 −1 −0.5 0 0.5 1 1.5 2
−2 −1.5 −1 −0.5 0 0.5 1 1.5 2
predicted force (eV/A
°)
DFT force (eV/A°) EAM
ML perfect prediction
−2 −1.5 −1 −0.5 0 0.5 1 1.5 2
−2 −1.5 −1 −0.5 0 0.5 1 1.5 2
predicted force (eV/A
°)
DFT force (eV/A°) EAM
[image:10.608.57.554.68.278.2]ML perfect prediction
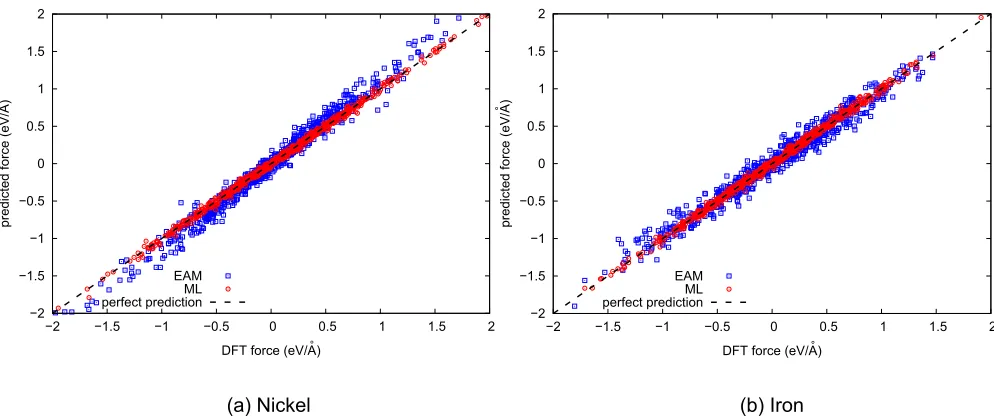
FIG. 8. Scatter plots showing accuracy of GP regression vs EAM on 200 randomly selected testing configurations. A 160-configurations training database was used for the GP models.
using large smearing widths brings no convergence benefit. Similarly, adding or removing electrons in a self-consistent fashion does not yield any significant improvement in the convergence of the QM forces, so that achieving occupancy balance of quasidegenerate surface cluster states by charge addition or depletion (in the±5 erange, while using a neu-tralizing background charge density in the DFT calculations) does not yield improved force convergence with QM cluster size. This is shown in Fig. 7(d), for a 59 atom cluster at 1200 K, showing an essentially flat force error profile.
Taken together, these results suggest that force conver-gence to the accuracy required to make QM/MM calculations of dislocation motion practical can be attained in uncon-strained local spin density calculations on α-Fe systems of interest. While this is good news, it is clear that very large QM-zone clusters are required to fully decouple the central atom from surface states in QM/MM calculations aiming at a quantitative convergence to their reference (while practically unattainable) fully-QM results. To enable practical simula-tions we next note that the overall cost of the calculasimula-tions could be still very significantly reduced by judicious storage and reuse of the information produced. Namely, machine learning (ML) techniques could then be used to predict atomic forces using a database of reference atomic configurations and their associated accurate QM forces. Ideally, for any new atomic configuration “similar enough” to previously encoun-tered ones, a ML interpolation scheme would be sufficient to predict the forces on atoms necessary to continue a MD simulation, so that only genuinely new configurations would ever require new QM calculations [32]. The accuracy of ML methods based on Gaussian process (GP) regression are tested in the next subsection.
B. Gaussian process regression for bulk metals
We tested our GP models (see Sec.II C) on sample trajec-tories extracted fromab initioMD simulations of nickel and iron in their crystalline cubic phases. Figure8 shows scatter
plots of DFT force components versus those predicted by both EAM [37,55] and the GP models. These plots reveal that EAM predictions (blue points) are adequateon averagein the region of configuration space where the forces are small. As the magnitude of the forces increases, the EAM predictions incur significant systematic errors with respect to the DFT reference forces (overestimated in Ni and slightly underestimated in Fe: this feature depends however on the exact choice of the potential). The accuracy of the GP predictions (red points), on the other hand, does not depend on the modulus of the force being predicted, an effect that can be related to the absence of a fixed functional form systematically “biasing” the predictions.
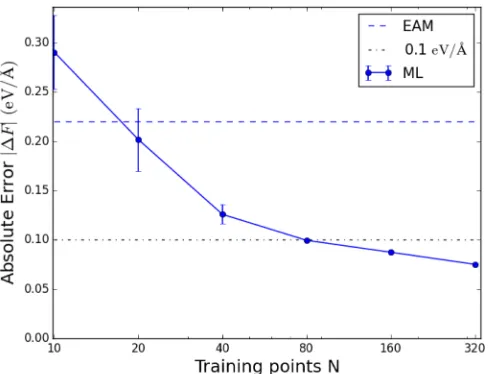
FIG. 9. Average force error for Fe atoms within 3 Å of a vacancy as a function of the size of the database.
An “on-the-fly learning” scheme might be of help in these circumstances in as much as the training database could be modified or augmented adaptively. This approach represents an active field of research [32,34,59], and further develop-ments are surely necessary to fully exploit its capabilities. Nevertheless, the good performance of GP-based force mod-els in the present class of systems and the increasing availabil-ity of QM databases provide a promising practical background for information efficient on-the-fly learning techniques.
V. CONCLUSION
We have presented an extension to the “learn on the fly” method, aimed at the QM/MM modeling of dislocation motion in metallic bulk systems. The moving QM region (dislocation core) is tracked using an algorithm based on the Nye tensor analysis and automatically updated during the course of the QM/MM simulation, thus allowing for the selection of a (mobile) QM region of minimal size, reduc-ing the computational cost. This approach is then used for studying the glide of a screw dislocation in γ-Ni, focusing on the local arrangement of atoms at its core and, in partic-ular, on the length of the stacking faulted region separating Shockley partial dislocations. The study is repeated under different simulation conditions including temperature, applied shear strain, and chemical composition. The EAM-based in-teratomic potential, used for the MM part of this work, is found to be in good agreement with the QM/MM model at the low stress/low chemical complexity regime, even at high temperatures. Simulations under more extreme conditions reveal the development of a large separation distance between SPs during a MM simulation, behavior that is not observed using the QM/MM method. This deviation is rationalized in terms of the lack of transferability of the EAM potential, incapable of correctly describing an Al impurity inγ-Ni or the elastic response of hcp nickel. While this established the need of validation and the usefulness for this purpose of reference QM embedding methods, it comes at a significant computational cost that increases further with the complexity
of the system, as seen in the case ofα-Fe. However, machine learning methods appear fit to learn QM forces accurately in metallic systems for the class of problems addressed here, suggesting that the efficiency issue can be addressed using databases of atomic configurations for which QM-accurate forces are known. In particular, tests on bulk systems of γ-Ni andα-Fe reveal that DFT data can be reproduced using databases of modest size. High accuracy is obtained also in the vicinity of a point defect (vacancy). These results indicate that a QM/MM implementation is a viable tool to investigate dislocation motion in metallic systems, making it possible to accurately describe the nonequilibrium atomic configurations found in the neighborhood of dislocation cores. This scheme could be supported by a ML algorithm capable of reproducing QM-accurate forces in all encountered configurations similar to those contained in the available database, for which inter-polation is all that is required, limiting the need for devel-oping new QM information to genuinely new configurations encountered during the system’s dynamical evolution. This opens the path to applying an on-the-fly learning (ML-based LOTF [32]) QM/MM schemes in these systems, allowing bridging between the typical simulation times accessible to
ab initio and classical molecular dynamics. The molecular
dynamics trajectories created during this research are openly available from the University of Warwick Research Portal at [60].
ACKNOWLEDGMENTS
We acknowledge funding from the Thomas Young Centre-US Air Force Research Laboratory Collaboration funded by the European Office of Aerospace Research and Develop-ment, from the EPSRC under Grants No. EP/L014742/1, No. EP/P002188/1, No. EP/R012474/1, and No. EP/L015854/1 (the latter funding was received through the center for doctoral training “Cross Disciplinary Approaches to Non-Equilibrium Systems,” CANES), the US Office of Naval Research Global, and the European Union’s Horizon 2020 research and innova-tion program (Grant No. 676580, The NOMAD Laboratory, a European Centre of Excellence). We acknowledge PRACE for awarding us access to resource Fermi based in Italy at Cineca and Juqueen based in Germany at Jülich Supercomputing Centre. An award of computer time was provided by the Innovative and Novel Computational Impact on Theory and Experiment (INCITE) program. This research used resources of the Argonne Leadership Computing Facility, which is a DOE Office of Science User Facility supported under Contract DE-AC02-06CH11357. We are grateful for computational support from the UK national high performance computing service, ARCHER, for which access was obtained via the UKCP consortium and funded by EPSRC grant reference EP/P022065/1. Additional computing facilities were pro-vided by the Scientific Computing Research Technology Plat-form of the University of Warwick.
APPENDIX A: AL IMPURITIES IN THEγMATRIX
dislo-TABLE III. Substitutional formation energy of an Al impurity inγ-Ni evaluated using EAM and DFT (a). Cohesive energies and for an Al atom in the γ phase, as calculated with the full EAM potential and with a truncated version limited to nearest neighbors interactions. The latter produces by construction the same results in the (undefected)γphase (b).
(a) formation energy DFT EAM
sub(Al) (eV) −1.54 −1.73
(b) cohesive energy EAM (full) EAM (n.n.)
coh
Al [γ] (eV) −4.74 −4.69
coh
Al [γ] (eV) −4.77 −4.62
cations moving along theγ /γinterface. Chemical impurities are also ubiquitous in these materials and affect dislocation properties. For instance, they can lower the ISF energy, thus increasing the equilibrium SPs separation. Rhenium impu-rities are, e.g., very useful for the design of efficient Ni superalloys, due to their beneficial effects on tertiary creep deformation (the so-called rhenium effect). Here we inves-tigate the energetics of the Al substitutional impurity in γ, for which we find a less satisfactory agreement with DFT predictions for the EAM implementation. The model systems used in DFT calculations are constructed by substituting a Ni atom with an Al in a 3×3×3 cubic cell containing 108 bulk atoms. Details of the calculations are the same as reported in Sec.II Babove. Geometries are optimized within a 1 meV total energy tolerance, using a conjugate gradients algorithm and 4×4×4 MPk-point mesh for BZ sampling. The substitutional formation energy is evaluated as
sub(Al)=Etot−Eref+μ(Ni)−μ(Al), (A1)
whereEtotis the total energy of the relaxed defected system
and Eref the energy of a Ni crystal of the same size. The
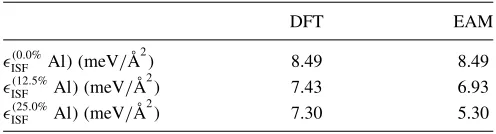
[image:12.608.312.560.95.162.2]chemical potentialμ(X) is evaluated from the per-atom en-ergy of fcc crystals. The EAM value for the formation enen-ergy deviates from the DFT reference, as reported in Table III. This discrepancy can be explained by noting that the EAM potential is fitted to the energetics of theγ phase, in which the first shell of neighbors is the same as for the Al impurity. As the interactions beyond nearest neighbor are small for the EAM potential, this constrains the energy prediction for the impurity. This can readily be seen by comparing the cohesive energy of a substitutional Al atom in γ-Ni with that of an Al atom in γ, using both the full EAM potential and a reduced version for which only nearest neighbor interactions are considered. This gives almost identical results (TableIII). The lower substitutional formation energy discussed above is a feature depending mostly on nearest neighbor interactions, and it is therefore expected to apply also to the hcp case, leading once again to the prediction of a larger distance between SPs (note that in this case this is true also for the equilibrium 0 K geometry). This is verified here by calculating the ISF energies using DFT calculations and comparing them to EAM results. The crystal is oriented along [1¯00], [11¯2], and [111]. A 2×2×6 supercell is used (18{111}layers). The stacking fault is generated by shifting the nine upper planes byb/√3, wherebis the nearest neighbor distance. Since this
TABLE IV. Intrinsic stacking fault energies at different Al concentrations.
DFT EAM
(0.0%
ISF Al) (meV/Å 2
) 8.49 8.49
(12.5%
ISF Al) (meV/Å 2
) 7.43 6.93
(25.0%
ISF Al) (meV/Å 2
) 7.30 5.30
operation disrupts the periodicity along z, 15 Å of vacuum are introduced in this direction. This stacking configuration is then relaxed using the FIRE algorithm with a maximum force tolerance of 0.05 eV/Å, constraining atomic positions to change only alongz. The ISF energy can at this point be obtained as the difference between the final configuration and the starting (fcc) one, normalized over the area of a {111} layer. We repeated this calculation for systems containing increasing amounts of Al (0%, 12.5%, 25%) in the faulted {111} layer, each time placing the Al atoms so that they were never, before or after the shift, nearest neighbors, as this would be energetically unfavorable. Our results, reported in Table IV, confirm the expected trend. As this suggests the equilibrium SP separation will also be overestimated in the presence of Al impurities, consistent with the behav-ior of dislocation core pairs observed in MD simulations in Sec.II B.
APPENDIX B: VISUALIZING A SCREW DISLOCATION AT LOW TEMPERATURE
The Nye tensor analysis can be used for visualization of the distribution of Burgers vector surface density in the plane normal to the line direction. We use a nearest neighbor cutoff of 3.3 Å for evaluating the deformation tensor. Within this distance, the first shell of neighbors is included, as well as the atoms strongly displaced by the dislocation elastic field introduced in the fcc structure. As can be noted from Fig.10, only a few atoms, clustered within a 2–3 Å radius, contribute to ∼70% of the Burgers vector density. This region is by definition the core of the dislocation. The screw and the edge components of the Nye tensor are shown in Fig.10, in panels (a) and (b), respectively. The other components of the Nye tensor either vanish or provide vanishing contribution to the Burgers vector when integrated over the surface perpendicular to the dislocation line.
APPENDIX C: ELECTRONIC PROPERTIES CONVERGENCE
The EAM potential used for our QM/MM implementation is not capable of reproducing reference QM results. This is due to the great similarity between the local environment of the Al impurity inγ and of the Al atom inγ, and it is an evident example of transferability issues in classical poten-tials. Here we discuss the convergence of some electronic properties for a QM atom in a cluster of increasing size for two systems,γ-Ni andα-Fe.
[image:12.608.49.296.138.211.2]FIG. 10. Screw (a) and edge (b) components of the Burgers vector for the relaxed MM core structure of screw dislocations dissociated into Shockley partials.
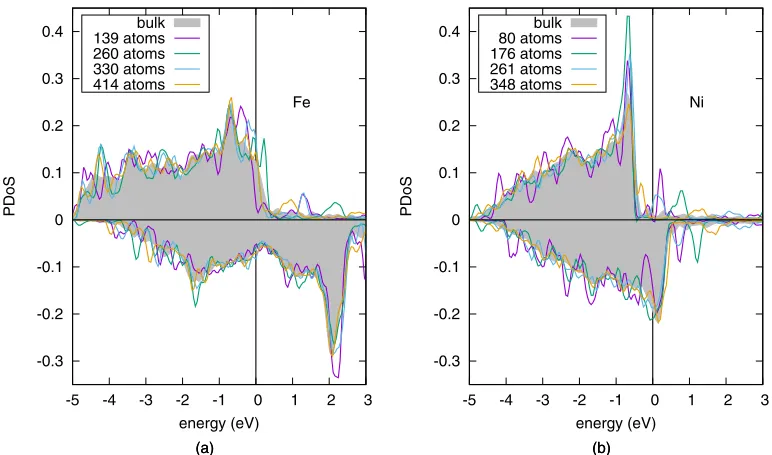
temperature (1200 K), and we investigate the convergence of electronic properties for increasing widths of the buffer region. The same test is applied to both γ-Ni and α-Fe. The projected densities of states (PDoS) for these systems are calculated at the point using the Methfessel-Paxton smearing. For some of the smaller systems, we have verified that a more dense sampling of the BZ would not yield to significantly different results. A bulk reference is provided, using a 4×4×4 reciprocal space grid and the same smearing type and parameter adopted for the clusters.
The results for a selection of clusters of different size are displayed in Fig.11with colored lines; the bulk reference is
indicated with a gray filled curve. The PDoS of the cluster systems are more localized with respect to the bulk reference, and a very sharp peak can be observed for the smallest cluster examined. A large number of atoms (≈300 and≈400 atoms for Ni and Fe, respectively) are required to properly converge the electronic structure. Starting from clusters of 176 atoms, the PDoS for the Ni atom becomes similar to the bulk refer-ence, with the exception of the major peak at 0.5 eV below the Fermi level, where the height is overestimated. Clusters of at least 300 atoms are required to mitigate this effect. A different deviation from the bulk reference is observed for these system:
-0.3 -0.2 -0.1 0 0.1 0.2 0.3 0.4
-5 -4 -3 -2 -1 0 1 2 3
(a) (b)
Fe
PDoS
energy (eV) bulk
139 atoms 260 atoms 330 atoms 414 atoms
-0.3 -0.2 -0.1 0 0.1 0.2 0.3 0.4
-5 -4 -3 -2 -1 0 1 2 3
(a) (b)
Ni
PDoS
energy (eV) bulk
80 atoms 176 atoms 261 atoms 348 atoms
[image:13.608.112.498.474.702.2]0 0.05 0.1 0.15 0.2 0.25 0.3
0 50 100 150 200 250 300 350 400 450
(a) (b)
force error (eV/Å)
atoms in the cluster Fe
Ni
−0.3 −0.2 −0.1 0 0.1 0.2 0.3 0.4 0.5
0 50 100 150 200 250 300 350 400 450
(a) (b)
magnetic moment error (
µB
)
atoms in the cluster Fe
[image:14.608.114.496.69.298.2]Ni
FIG. 12. Force error (a) and magnetic moment error (b) with respect to the bulk reference for a monoatomic QM region for clusters of increasing size inγ-Ni (blue) andα-Fe (red).
a minor intermediate peak between the major one at 0.5 eV and Fermi.
In the case of iron, the convergence of the electronic properties is more challenging, in particular due to the several crossings of the Fermi level observed for the spin-up channel [see for instance the 260 atoms cluster in Fig. 11(a)]. The major peak of bulk Fe, at−0.75 eV, is split into a series of minor peaks, and clusters as large as 330 atoms still present this feature. Starting from clusters of 414 atoms the PDoS starts to resemble the reference profile. Note that each of the reported PDoS exhibits a different value at Fermi. These large variations are not observed in nickel, for which the Fermi level is close to extrema of the PDoS (a minimum for the spin-up channel and a minimum for the spin down) and exhibits therefore small fluctuations with respect to the accuracy of the calculation. Another way to investigate the convergence of electronic properties is monitoring how the charge density at the central atom and its space integral evaluated by means of Bader analysis converge with cluster size. As charge rear-rangements are not expected in this system, we have opted for studying the convergence of the magnetic moment. We present these results in Fig.12(b), together with the conver-gence of the QM force on the same atom, shown in panel (a).
Similar oscillations of the magnetic moment can be observed for both γ-Ni and α-Fe. Larger errors are observed in the case of iron, consistent with the larger intrinsic magnetization of this material. Notably, most cluster calculations for iron would predict a magnetic moment larger than the bulk one. This is consistent with the very large magnetization observed for the surface atoms (see main text). The 0.1 eV/Å force accuracy threshold is reached with the first (≈40 atoms) and the fourth (≈140) atom shell for Ni and Fe, respectively. This makes a QM/MM treatment of nickel much cheaper than for iron, as discussed in the main text. However, a force accuracy as low as 0.05 eV/Å is eventually reached for both systems using QM clusters larger than 250 atoms. Note however that force convergence does not correspond to a full convergence of all electronic properties, as is, e.g., clear from the DoS plots in Fig.11from the oscillating magnetic moment errors reported in Fig. 12(b) [see also panel (b) in Fig. 7, main text]. These results indicate that the QM clusters used for practical LOTF calculations do not describe the electronic properties of the system with sufficient accuracy. This justifies the usage of “tricks” for accelerating the convergence of QM forces, including large values of Gaussian width for electronic smearing approaches.
[1] A. Mottura and R. C. Reed, MATEC Web of Conferences 14, 01001 (2014).
[2] M. Dadfarnia, A. Nagao, S. Wang, M. L. Martin, B. P. Somerday, and P. Sofronis,Int. J. Fract.196,223(2015). [3] O. Barrera, D. Bombac, Y. Chen, T. D. Daff, E. Galindo-Nava,
P. Gong, D. Haley, R. Horton, I. Katzarov, J. R. Kermode, C. Liverani, M. Stopher, and F. Sweeney,J. Mater. Sci.53,6251
(2018).
[4] K. Burke,J. Chem. Phys.136,150901(2012).
[5] C.-K. Skylaris, P. D. Haynes, A. A. Mostofi, and M. C. Payne,
J. Chem. Phys.122,084119(2005).
[6] A. Prakash, J. Guénolé, J. Wang, J. Müller, E. Spiecker, M. Mills, I. Povstugar, P. Choi, D. Raabe, and E. Bitzek, Acta Mater.92,33(2015).
[7] M. W. Finnis and J. E. Sinclair, Philos. Mag. A 50, 45
(1984).
[9] M. S. Daw and M. I. Baskes,Phys. Rev. B29,6443(1984). [10] J. J. Möller and E. Bitzek,Modell. Simul. Mater. Sci. Eng.22,
045002(2014).
[11] Y. K. Kim, H. K. Kim, W. S. Jung, and B. J. Lee,Comput. Mat. Sci.139,225(2017).
[12] Y. K. Shin, H. Kwak, C. Zou, A. V. Vasenkov, and A. C. T. V. Duin,J. Phys. Chem. A116,12163(2012).
[13] A. Kumar, A. Chernatynskiy, T. Liang, K. Choudhary, M. J. Noordhoek, Y. T. Cheng, S. R. Phillpot, and S. B. Sinnott,J. Phys. Condens. Matter27,336302(2015).
[14] M. C. Payne, I. Stich, A. De Vita, M. J. Gillan, and L. J. Clarke,
Faraday Discuss.96,151(1993).
[15] S. Rao, C. Hernandez, J. P. Simmons, T. A. Parthasarathy, and C. Woodward,Philos. Mag. A77,231(1998).
[16] G. P. M. Leyson, W. A. Curtin, L. G. Hector, and C. F. Woodward,Nat. Mater.9,750(2010).
[17] A. M. Z. Tan, C. Woodward, and D. R. Trinkle, Phys. Rev. Materials3,033609(2019).
[18] A. K. Nair, D. H. Warner, R. G. Hennig, and W. A. Curtin,Scr. Mater.63,1212(2010).
[19] N. Bernstein, J. R. Kermode, and G. Csányi,Rep. Prog. Phys.
72,026501(2009).
[20] X. Zhang, G. Lu, and W. A. Curtin,Phys. Rev. B87,054113
(2013).
[21] L. Huber, B. Grabowski, M. Militzer, J. Neugebauer, and J. Rottler,Comput. Mater. Sci.118,259(2016).
[22] G. Csányi, T. Albaret, M. C. Payne, and A. De Vita,Phys. Rev. Lett.93,175503(2004).
[23] J. R. Kermode, L. Ben-Bashat, F. Atrash, J. J. Cilliers, D. Sherman, and A. De Vita,Nat. Commun.4,2441(2013). [24] A. Gleizer, G. Peralta, J. R. Kermode, A. De Vita, and D.
Sherman,Phys. Rev. Lett.112,115501(2014).
[25] F. Bianchini, J. R. Kermode, and A. De Vita,Modell. Simul. Mater. Sci. Eng.24,45012(2016).
[26] T. D. Swinburne and J. R. Kermode,Phys. Rev. B96,144102
(2017).
[27] J. Behler and M. Parrinello,Phys. Rev. Lett.98,146401(2007). [28] A. P. Bartók, M. C. Payne, R. Kondor, and G. Csányi,Phys.
Rev. Lett.104,136403(2010).
[29] D. Dragoni, T. D. Daff, G. Csányi, and N. Marzari, Phys. Rev. Mater.2, 1939 (2018).
[30] A. Glielmo, P. Sollich, and A. De Vita,Phys. Rev. B95,214302
(2017).
[31] A. Glielmo, C. Zeni, and A. De Vita,Phys. Rev. B97,184307
(2018).
[32] Z. Li, J. R. Kermode, and A. De Vita,Phys. Rev. Lett.114,
096405(2015).
[33] M. Caccin, Z. Li, J. R. Kermode, and A. De Vita, Int. J. Quantum Chem.115,1129(2015).
[34] V. Botu and R. Ramprasad,Phys. Rev. B92,094306(2015). [35] J. R. K. Bigger, D. A. McInnes, A. P. Sutton, M. C. Payne, I.
Stich, R. D. King-Smith, D. M. Bird, and L. J. Clarke,Phys. Rev. Lett.69,2224(1992).
[36] E. Clouet,Phys. Rev. B84,224111(2011). [37] Y. Mishin,Acta Mater.52,1451(2004).
[38] G. Kresse and J. Hafner,Phys. Rev. B47,558(1993). [39] G. Kresse and D. Joubert,Phys. Rev. B59,1758(1999). [40] J. P. Perdew, K. Burke, and M. Ernzerhof,Phys. Rev. Lett.77,
3865(1996).
[41] H. J. Monkhorst and J. D. Pack,Phys. Rev. B13,5188(1976). [42] M. Methfessel and A. T. Paxton, Phys. Rev. B 40, 3616
(1989).
[43] J. Nye,Acta Metall.1,153(1953).
[44] C. S. Hartley and Y. Mishin,Acta Mater.53,1313(2005). [45] C. M. Bishop, Pattern Recognition and Machine Learning,
Information Science and Statistics (Springer, New York, 2006). [46] C. E. Rasmussen and C. K. I. Williams, Gaussian Processes for
Machine Learning, the MIT Press (2006).
[47] C. A. Micchelli and M. Pontil, inAdvances in Neural Informa-tion Processing Systems(University at Albany State University of New York, Albany, NY, 2005).
[48] M. A. Álvarez, L. Rosasco, and N. D. Lawrence, Foundations and Trends in Machine Learning4,195(2012).
[49] G. Ferré, J. B. Maillet, and G. Stoltz, J. Chem. Phys. 143,
104114(2015).
[50] C. Woodward, D. R. Trinkle, L. G. Hector Jr., and D. L. Olmsted,Phys. Rev. Lett.100,045507(2008).
[51] E. Bitzek and P. Gumbsch,Mater. Sci. Eng. A400,40(2005). [52] H. Chamati, N. I. Papanicolaou, Y. Mishin, and D.
Papaconstantopoulos,Surf. Sci.600,1793(2006).
[53] G. Henkelman, A. Arnaldsson, and H. Jónsson,Comput. Mater. Sci.36,354(2006).
[54] W. Tang, E. Sanville, and G. Henkelman,J. Phys.: Condens. Matter21,084204(2009).
[55] M. I. Mendelev, S. Han, D. J. Srolovitz, G. J. Ackland, D. Y. Sun, and M. Asta,Philos. Mag.83,3977(2003).
[56] C. Zeni, K. Rossi, A. Glielmo, Á. Fekete, and A. De Vita,J. Chem. Phys.148,241739(2018).
[57] V. L. Deringer and G. Csányi,Phys. Rev. B95,094203(2017). [58] A. P. Bartók, J. Kermode, N. Bernstein, and G. Csányi,Phys.
Rev. X8,041048(2018).
[59] E. V. Podryabinkin and A. V. Shapeev,Comput. Mater. Sci.140,
171(2017).