warwick.ac.uk/lib-publications
Manuscript version: Author’s Accepted ManuscriptThe version presented in WRAP is the author’s accepted manuscript and may differ from the published version or Version of Record.
Persistent WRAP URL:
http://wrap.warwick.ac.uk/109469
How to cite:
Please refer to published version for the most recent bibliographic citation information. If a published version is known of, the repository item page linked to above, will contain details on accessing it.
Copyright and reuse:
The Warwick Research Archive Portal (WRAP) makes this work by researchers of the University of Warwick available open access under the following conditions.
© [2018], Elsevier. Licensed under the Creative Commons Attribution-NonCommercial-NoDerivatives 4.0 International http://creativecommons.org/licenses/by-nc-nd/4.0/.
Publisher’s statement:
Please refer to the repository item page, publisher’s statement section, for further information.
1 * Corresponding author
Experimental and numerical study of stainless steel I-sections under
concentrated internal one-flange and internal two-flange loading
G. B. dos Santosa,*, L. Gardnera, M. Kucuklera,b
a Department of Civil and Environmental Engineering, South Kensington Campus, Imperial College London, London SW7 2AZ, UK
b Department of Civil Engineering, Bilecik Seyh Edebali University, Bilecik 11210, Turkey
ABSTRACT
The behaviour and design of stainless steel I-section beams under concentrated transverse loading are
investigated in this study. Twenty-four experiments on stainless steel I-sections, formed by the welding
of hot-rolled plates, were performed. The tests were conducted under two types of concentrated
transverse loading − internal one-flange (IOF) and internal two-flange (ITF) loading. The experimental
set-up, procedure and results, including the full load-displacement histories, ultimate loads and failure
modes, are reported. A complementary nonlinear finite element modelling study was also carried out.
The models were first validated against the results of the experiments. A parametric investigation into
the influence of key parameters such as the bearing length, web slenderness and level of coexistent
bending moment, on the structural response was then performed. Finally, an assessment of current
design provisions for the resistance of stainless steel welded I-sections to concentrated loading is
presented. The results show that the current design formulae yield safe-sided, but generally rather
scattered and conservative capacity predictions, with considerable scope for further development.
Keywords: Austenitic stainless steel; concentrated transverse load; experiments; finite element
modelling; internal one-flange (IOF); internal two-flange (ITF); testing.
2
1. INTRODUCTION
Structural steel members under concentrated transverse loading are encountered in a wide range of
situations − examples include primary girders at bearing supports, primary beams under roof purlins,
columns in beam-to-column connections [1] and bridge girders during their launching phase [2, 3].
Members under concentrated transverse loading are subjected to non-uniform stress distributions,
complex edge restraint conditions between the web and flanges, and local yielding beneath the load
[4]. Taken together, these render the development of analytical formulations able to predict accurately
the ultimate resistances of members under concentrated loading non-trivial. Even analytical models
for the key reference points of the elastic buckling load and plastic collapse load [5, 6], which can be
used to predict ultimate resistance, are still complex, and numerical techniques are often necessary for
their accurate determination [7, 8].
Experimental investigations carried out to determine the ultimate bearing resistances of steel members
under concentrated transverse loading date back to 1946, when the first tests on cold-formed carbon
steel members were reported by Winter and Pian [9]. Such tests have since been performed on
cold-formed carbon steel members with different cross-section shapes, including I-sections, C-sections,
Z-sections, hat-Z-sections, deck Z-sections, and hollow sections [10-14], on members with and without flange
restraints [15-18], and web openings [19-21], and on cold-formed stainless steel members [22-25].
Numerical studies on cold-formed stainless steel members have also been performed [23, 26-28]. Tests
on cold-formed members are often referred to as web crippling tests due to the failure mode exhibited
during the experiments. A substantial number of tests has also been carried out on hot-rolled and
welded I-section members with slender [29, 30] and stocky webs [31], considering different bearing
lengths [32-34] coincident bending moments [35, 36] and including sections made of high strength
steel [37]. There exist, however, very few tests on welded stainless steel I-section members subjected
to concentrated transverse loading [38].
The structural performance of stainless steel members under concentrated transverse loading is the
3 one-flange loading resulting in failure beneath a single concentrated load away from the beam end,
and (ii) internal two-flange (ITF) loading, leading to failure between two concentrated loads applied
at opposite flanges away from the beam end. An experimental investigation involving twenty-four
physical tests to examine the influence of different bearing lengths and bending moments on the
ultimate resistance of stainless steel beams under IOF and ITF loading is first presented. Following
this, numerical models, validated against the results of the physical experiments, are used to generate
further data across a broad range of practical cases. Finally, the experimental and numerical results are
employed to assess the accuracy of existing design provisions [39, 40] for the design of stainless steel
members under concentrated transverse loading.
2. EXPERIMENTAL INVESTIGATION
Sixteen internal one-flange (IOF) loading tests and eight internal two-flange (ITF) loading tests were
carried out to assess the web bearing strengths of stainless steel I-section members. The specimens
were fabricated from hot-rolled stainless steel plates which were laser-welded in accordance with EN
ISO 13919-1 [41]; the quality level was Class B (stringent). Four cross-section sizes were examined:
(i) I 1026855, (ii) I 15216069, (iii) I 15075710, and (iv) I 160821012. The
cross-sections were formed from austenitic stainless steel of different grades: Grade EN 1.4571 for the first
two cross-sections, Grade EN 1.4404 for the third and Grade EN 1.4307 for the fourth. The IOF tests,
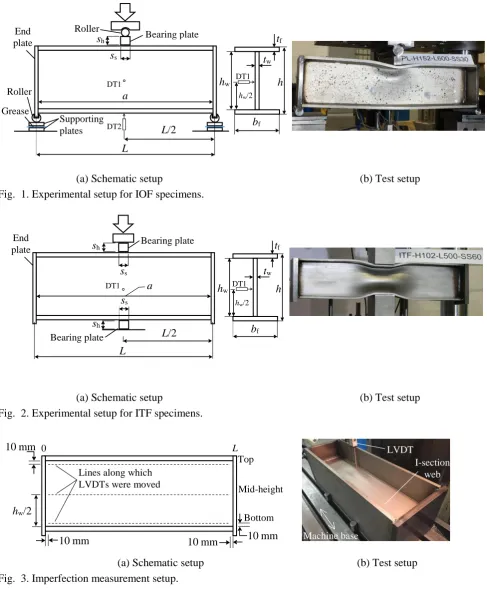
the setup for which is shown in Fig. 1, were performed on three different cross-section sizes with
different bearing lengths and a range of spans, while the ITF tests, the setup for which is depicted in
Fig. 2, were carried out on two different cross-section sizes with different bearing lengths. Both test
series were designed to cover a range of structural responses and isolate the influence of the key
parameters. The adopted test labelling system identifies the loading type (IOF or ITF), and the nominal
cross-section height (102 mm, 150 mm, 152 mm, or 160 mm), specimen length (from 300 mm to 750
mm) and bearing length ss (from 5 mm to 100 mm); for example, IOF-H102-L500-SS20 indicates a
4 length of 20 mm. In the following subsections, the member tests, together with the accompanying
material coupon tests and geometric imperfection measurements, are reported.
2.1. MATERIAL TESTING
A comprehensive characterization of the tensile stress-strain properties of the cross-sections tested
herein can be found in Gardner et al. [42]; in this section, a brief summary is provided. All the tensile
coupon tests were performed according to EN ISO 6892-1 [43], using an Instron 8802 250 kN
hydraulic testing machine. The coupons were extracted from the longitudinal direction of the members.
For cross-sections comprising plates of the same thickness, a single coupon test was performed, while
for those fabricated from plates of different thicknesses, two coupon tests (one from the web and one
from the flanges) were carried out. A summary of the measured tensile material properties for each
cross-section size is given in Table 1, where E is the Young’s modulus, fy is the 0.2% proof stress, f1.0
is the 1% proof stress, fu is the ultimate tensile stress, εu is the strain the at ultimate stress, and εf is the
strain at the fracture, measured over the standard gauge length.
2.2. GEOMETRIC DIMENSIONS AND IMPERFECTION MEASUREMENTS
Prior to the member tests, the dimensions and geometric imperfections of the specimens were
measured. The initial imperfection measurements were taken using the setup shown in Fig. 3,
following a similar procedure to that employed by Schafer and Pekoz [44] and Zhao et al. [45]. A
Linear Variable Displacement Transducer (LVDT) was attached to the head of a milling machine,
while the specimens were secured to the moving machine bed. The LVDT was utilised to measure the
variation in the out-of-plane displacement along the top, mid-height and bottom lines across the web
length of the specimens. To eliminate the influence of the weld geometry, the measurements were
taken 10 mm away from the web-to-flange junctions, as shown in Fig. 3(a). The local web
imperfection amplitude ω0 for each specimen was taken as the difference between the mid-height (umid)
displacement reading and the average of the displacement readings along the top (utop) and bottom
(ubottom) of the web, under the concentrated load (i.e. at mid-span) as shown in Fig. 4. The measured
5 Table 3, respectively, where h is the cross-section depth, tw is the web thickness, bf is the flange width,
tf is the flange thickness, ss is the bearing length (equal to the bearing height sh), L is the beam span,
hep, bf,ep and tep are the end plate height, width and thickness respectively, and ω0 is the measured web
imperfection under the concentrated load.
2.3. INTERNAL ONE-FLANGE LOADING TESTS
The internal one-flange (IOF) test setup consisted of a three-point bending configuration with the load
applied through a bearing plate at mid-span, as shown in Fig. 1. Two carbon steel plates were welded
to the ends of the specimens and supported on rollers, which were configured to slide horizontally in
response to the applied loading. The bearing plate, through which the loading was applied, had a roller
welded to the top, which allowed rotation about the out-of-plane axis, but no horizontal translation.
Displacement control was adopted in the tests driving an Instron 8800 750 kN hydraulic testing
machine at a constant rate of 0.005 mm/sec. Displacement transducers (DTs) were used to capture the
out-of-plane web displacement (DT1) and the vertical displacement at the bottom flange (DT2) of the
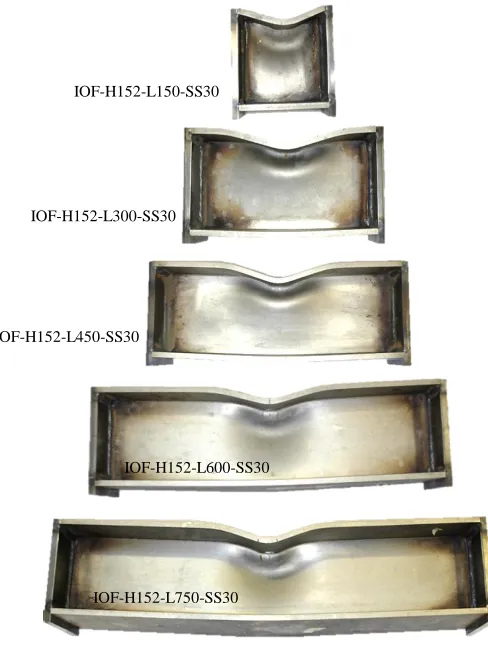
beams. The vertical displacement of the machine was also recorded. Fig. 5 shows the failed specimens,
all of which exhibited out-of-plane deformation of the web beneath the applied load and flange
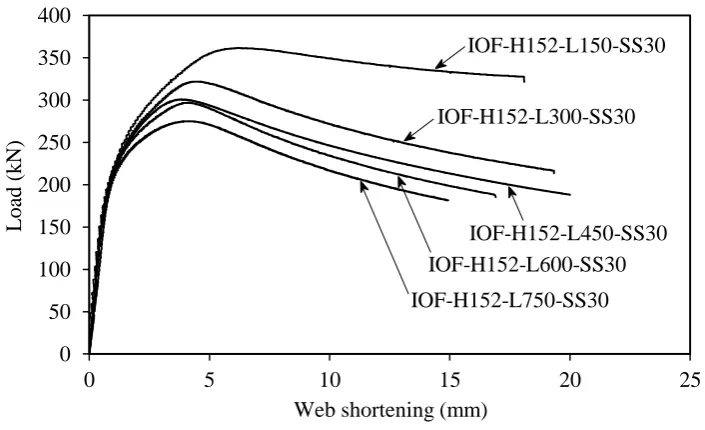
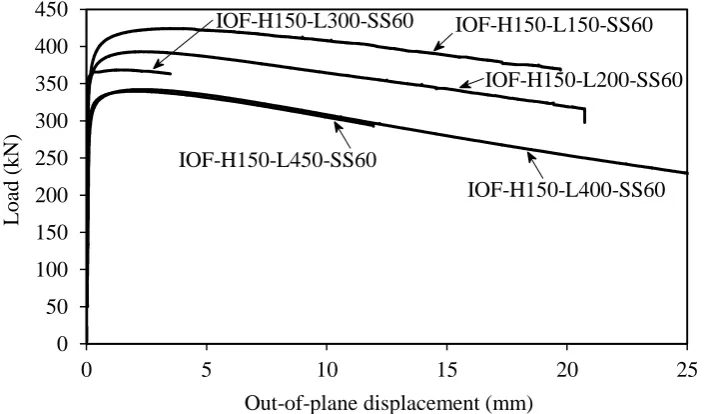
bending. The load-vertical displacement responses of the IOF test specimens are provided in Fig. 6 to
Fig. 8, the load-web shortening responses are provided in Fig. 9 to Fig. 11 and the load versus web
out-of-plane displacement responses are shown in Fig. 12 to Fig. 14. The vertical web shortening was
determined by taking the difference between the vertical displacement of the testing machine and the
vertical displacement measured at the bottom flange of the specimen (DT2). The key IOF test results
are presented in Table 2, where Fu is the ultimate test load, δu is the vertical web shortening at the
ultimate load and δu,v is the vertical displacement of the top flange at the ultimate load.
The out-of-plane deformation field of the webs of the tested members was also recorded using a Digital
Image Correlation (DIC) system. A random speckle pattern was first applied to the web surface of each
of the tested specimens. Two high-resolution cameras were used to monitor the web region during the
6 Fig. 15 shows the load-out-of-plane displacement response, together with the out-of-plane
deformation fields obtained from the DIC data at different stages during the testing of specimen
IOF-H150-L400-SS60. The out-of-plane deformation fields indicate that the maximum out-of-plane
displacement occurred at mid-span under the point of load application above the mid-height of the
web.
2.4. INTERNAL TWO-FLANGE LOADING TESTS
The internal two-flange (ITF) test setup shown in Fig. 2 consists of a member subjected to two
simultaneous transverse loads applied through two bearing plates, one positioned at the top flange and
the other at the bottom flange. Both bearing plates had the same dimensions and were placed at the
mid-span of the member. Carbon steel plates were welded to both ends of the test specimens. Similar
to the IOF tests, the ITF tests were performed under displacement control at a constant rate of 0.005
mm/sec using an Instron 8800 750 kN hydraulic testing machine. Vertical displacement was measured
by the testing machine, while the out-of-plane displacement was measured by the displacement
transducer DT1. Fig. 16 shows the failure modes of all the internal two-flange test specimens.
Mid-height out-of-plane web buckling failure together with significant local flange bending were observed
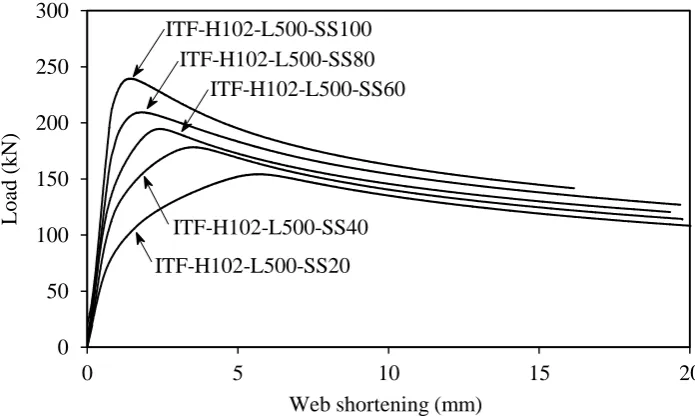
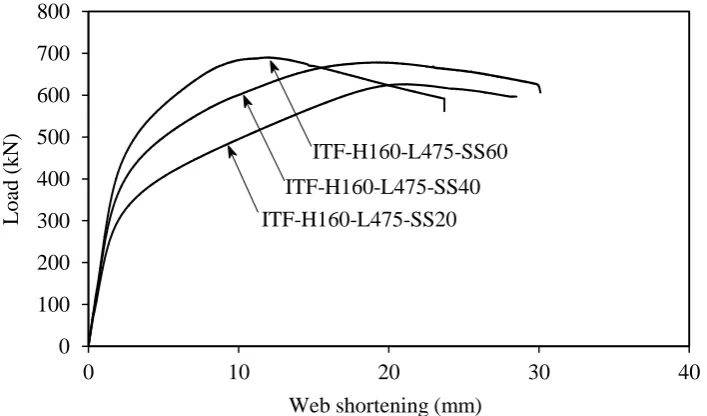
in all cases. The load-web shortening responses of the ITF test specimens are presented in Fig. 17 and
Fig. 18 while the load-out-of-plane displacement responses are plotted in Fig. 19 and Fig. 20. The
key ITF test results are reported in Table 3, where δu is the vertical web shortening at the ultimate load
taken as the displacement measured using the testing machine.
Digital Image Correlation (DIC) was also employed, as described previously for the IOF specimens,
to obtain the out-of-plane deformation fields of the webs of the tested ITF specimens. Fig. 21 shows
the load-out-of-plane displacement response, together with the out-of-plane deformation fields
obtained during the testing of specimen ITF-H102-L500-SS20. The out-of-plane deformation fields
indicate that the maximum out-of-plane displacement occurred at mid-span under the point of load
application but unlike for IOF test specimens, the maximum out-of-plane displacement occurred
7
3. NUMERICAL MODELLING
Numerical models were developed using the finite element analysis software Abaqus [47]. Initially,
the full load-deformation histories and failure modes obtained from the experiments were used to
validate the numerical models and assess their sensitivity to various input parameters. Further
parametric studies were then carried out to extend the experimental database.
3.1. MODELLING ASSUMPTIONS
The four-noded shell element with reduced integration, referred to as S4R in the Abaqus element
library [47], was used to mesh the beams and endplates, while the eight-noded linear solid element
with reduced integration, referred to as C3D8R in the Abaqus element library [47], was used to model
the bearing plates. A uniform element size approximately equal to half the web thickness of the
considered I-sections was adopted for all features of the models (i.e. bearing plates, I-section and end
plates), following a preliminary mesh sensitivity study. The measured engineering material
stress-strain curves obtained from the tensile coupon tests described in Section 2.1 [42] were converted into
the form of true stress and log plastic strain according to Eqs. (1) and (2), where true is the true stress,
εlnpl is the true plastic strain, E is the Young’s modulus, nom and nom are the engineering stress and
the engineering strain, respectively, before input into the finite element models. The measured
engineering stress-strain curve and the true stress-strain curve for the material extracted from each of
the tested cross-sections are shown in Fig. 22.
true nom(1 nom)
(1)
pl true
ln ln 1 nom
E
(2)
Elastic material behaviour was adopted for the end plates, with a Young’s modulus E of 210000 MPa
and a Poisson’s ratio ν of 0.3. The bearing plate was simulated as a rigid block by constraining all its
degrees of freedom to a reference point where the load was applied. The boundary conditions of the
8 (a), the vertical (U2) and out-of-plane (U1) displacements, as well as the rotations about the vertical
(UR2) and longitudinal (UR3) axes at the bottom of each end plate were restrained; for the ITF loading
models, as shown in Fig. 23 (b), the out-of-plane displacement (U1) was restrained at four end plate
nodes, while in all the models, the longitudinal displacement (U3) was restrained at the mid-length of
the top flange, providing symmetry in the boundary conditions, as in the tests.
The interaction between the bearing plate and the top flange of the I-sections beneath the applied
loading was taken into account by defining surface-to-surface contact between the bearing plate
(master surface) and the I-section flange (slave surface). A finite sliding procedure [47] was adopted
which allows arbitrary motion of both surfaces. A friction coefficient of 0.4 was used for the tangential
contact properties while for the normal contact properties, a “hard” contact relationship was adopted,
which assumes that the contact pressure-overclosure relationship is dictated by the stiffness of each of
the parts in contact with each other [47].
During the fabrication process, laser-welded I-sections are subjected to thermal gradients which lead
to the development of residual stresses during the cooling phase. A predictive model for residual
stresses in laser-welded I-sections was proposed in [42, 48]. However, a preliminary study into their
influence on the structural response under concentrated loading revealed very low sensitivity; a similar
finding was reported for the cross-section resistance of stainless steel welded I-sections in bending
[49], and residual stresses were thus not explicitly incorporated into the numerical models developed
herein. Initial local geometric imperfections were accounted for by defining imperfection patterns in
the form of the first buckling mode shapes obtained from prior linear eigenvalue buckling analyses. A
sensitivity study was performed to investigate the influence of four different imperfection amplitudes ω0 on the structural response of the modelled I-sections: (i) the value measured for each specimen in
the experiments ω0 using the procedure described in Section 2.2 and, (ii) 1/100, (iii) 1/300, and (iv)
1/500 of the cross-section web thickness. Following incorporation of the initial geometric
9 were carried out using the modified Riks solver [47] to obtain the full load-deformation response of
the specimens, including the post-peak behaviour.
3.2. VALIDATION OF FINITE ELEMENT MODELS
The accuracy of the finite element (FE) models was assessed by comparing their load-web-shortening
responses, ultimate load predictions, web shortening values at the ultimate loads and failure modes
against those observed of the experiments. The ultimate load and corresponding web shortening values,
considering the four imperfection amplitudes in the numerical models, are reported in Table 4 for the
IOF loading cases, and in Table 5 for the ITF loading cases. As can be seen from the table, the ultimate
load and corresponding web shortening values obtained from the numerical models are very close to
those of the tested specimens. The best agreement between the test and finite element results was
obtained for an imperfection amplitude of tw/500 for both loading cases; hence, an amplitude of tw/500
is adopted in the numerical models for the parametric studies described in the following section.
Excellent agreement is also observed between the numerical and experimental failure modes for both
loading conditions, as shown in Fig. 24 for a typical IOF loading specimen and Fig. 25 for a typical
ITF loading specimen. Typical numerical and experimental load versus web shortening responses and
load versus out-of-plane displacement responses for the IOF and ITF loading cases are shown in Fig.
26 to Fig. 29. These comparisons show generally good agreement over the full load-deformation
history, including initial stiffness, ultimate load and post-ultimate response.
3.3. PARAMETRIC STUDIES
Following validation of the finite element models against the test results, parametric studies were
performed to evaluate the influence of a range of key parameters on the web bearing resistances of
welded stainless steel I-sections under internal one-flange (IOF) loading and internal two-flange (ITF)
loading. In these studies, the measured material properties of the I 1026855 specimen (see Table
1) were adopted, with the initial geometric imperfection in the form of the first buckling mode scaled
with a maximum amplitude of 1/500 of the cross-section web thickness tw (i.e. tw/500). The web height
10 tf = 5.2 mm and bf = 67.8 mm for both loading conditions. A member length of 350 mm was adopted
for the IOF models, while a member length of 500 mm was used for the ITF models in the parametric
studies. The web thickness (tw) and the bearing length (ss) values were varied to cover a range of web
slendernesses (hw/tw) from 10 to 120 and a range of ratios of bearing length to web height (ss/hw) from
0.05 to 1.20. The influence of these parameters is assessed in the following two sub-sections.
3.3.1. INFLUENCE OF BEARING LENGTH
The influence of bearing length ss on the ultimate web bearing resistances of the modelled I-section
members under IOF and ITF loading is shown in Figs. 30 and 31, respectively. The same data are
plotted on two different scales on the vertical axis (which shows the ultimate load Fu) in (a) and (b) to
distinguish better between the data points with lower failure loads. On the horizontal axis, the bearing
length is normalised by the web height (i.e. ss/hw). For both loading types, the ultimate load may be
seen to increase almost linearly with increasing bearing length, due to the load being spread of a larger
region of the web.
3.3.2. INFLUENCE OF WEB SLENDERNESS
The influence of web slenderness on the ultimate resistance of the modelled I-section members for
different bearing lengths is shown in Figs. 32 and 33 for IOF and ITF loading, respectively, in which
the web slenderness hw/tw is plotted on the horizontal axis while the ultimate load Fu is again plotted
at two different scales in (a) and (b) on the vertical axis. For both loading cases, the ultimate load may
be seen to reduce sharply with increasing web slenderness, particularly for hw/tw values less than 60.
4. ASSESSMENT OF EXISTING DESIGN RULES
In this section, the methods provided in the European code EN 1993-1-4 [50] and in the American
AISC Design Guide 27 [40] for the design of stainless steel members under concentrated transverse
loading are described and assessed. The accuracy of the design provisions is evaluated by comparing
the experimental and numerical failure loads (Fu) against the ultimate loads predicted by the
11 concentrated loading and bending moment assuming proportional loading (see Fig. 34) for the internal
one-flange (IOF) loading case. For the internal two-flange (ITF) loading case, the predicted ultimate
loads (Fu,pred) are compared directly with the experimental and numerical ultimate loads. A value for
Fu/Fu,pred greater than unity indicates a safe-sided design prediction. Note that the measured (or
modelled) material and geometric properties were used in all the comparisons and that all partial safety
factors were set equal to unity.
4.1. EUROPEAN DESIGN PROVISIONS: EN 1993-1-4 (EC3)
EN 1993-1-4 [50] adopts the carbon steel design rules set out in EN 1993-1-5 [39] for stainless steel
members under concentrated loading. The design resistance to local failure under concentrated
transverse loading FRd is determined using Eq. (3), where fyw is the web 0.2% proof stress, tw is the
web thickness and Leff is the effective length, which is given by the product of effective loaded length
ly from Eq (4) and the reduction factor χF. The method adopted for the determination of the effective
loaded length ly is based on the four-hinge plastic mechanism model originally proposed by Roberts
and Rockey [51]. The reduction factor χF, determined from Eq. (5) is a function of the slenderness
parameterF, which is equal to the square root of the ratio of the plastic load (Eq. (6)) to the elastic
buckling load Fcr of the member under concentrated force. The buckling load is determined from Eq.
(7) where kF is the buckling coefficient, which has different values for different transverse loading
types (i.e. IOF, ITF etc), and a is the distance between stiffeners taken as the span excluding the end
plate thickness (i.e. aLtep).
Rd yw eff w
F f L t where Leff F yl (3)
y s 2 f 1 1 2
l s t m m where 1 yf f yw w
f b m
f t and
2 w F 2 f F 0.02 0.5 0 0.5 h for m t for (4) F F 0.5 1.0 where y F cr F F (5)
y y w yw
12
3 w
cr F
w 0.9 t
F k E
h
where
2 w
F 2
w 6 2
3.5 2
h
for IOF loading a
k
h
for ITF loading a
(7)
In the case of a member subjected to concentrated transverse loading plus bending moment (i.e.
internal one-flange (IOF) loading), the interaction between the forces should be considered through
Eq. (8), where FEd is the applied concentrated transverse force, FRd is the design resistance to
concentrated transverse loading given by Eq. (3), MEd is the applied bending moment and Mpl,Rd is the
plastic bending moment resistance of the cross-section regardless of its classification (compactness).
Note that the maximum attainable bending moment resistance MRd is still limited to the plastic, elastic
or effective moment capacity for Class 1-2, Class 3 and Class 4 cross-sections, respectively.
Ed Ed
Rd pl,Rd
0.8 1.4
F M
F M
(8)
The experimental and numerical ultimate capacities for the case of internal one-flange (IOF) loading
are plotted on the EC3 interaction diagram in Fig. 35. The comparisons reveal the safe-sided, but
generally overly-conservative nature of the EN 1993-1-5 (EN 1993-1-4) resistance predictions for
stainless steel I-sections, particularly with decreasing web slendernessF. A quantitative evaluation of
the accuracy of the EN 1993-1-5 resistance predictions for the IOF loading case can be found in Table
7, which shows a mean Fu/Fu,EC3 value of 1.91 with a coefficient of variation (COV) of 0.44 for all the
studied cases. The table also shows increasing Fu/Fu,EC3 ratios for the stockier sections (e.g. Fu/Fu,EC3
= 3.53 for hw/tw = 10 in comparison to Fu/Fu,EC3 = 1.44 for hw/tw = 120). The overly-conservative results
for the stockier sections, also observed in Fig. 36, are attributed to the neglect of the pronounced strain
hardening exhibited by stainless steel members with stocky webs. Such behaviour has also be observed
for stocky stainless steel cross-sections in other loading configurations [45, 49] and addressed by
means of the deformation based continuous strength method [52]. Fig. 37 shows a comparison of the
13 Eq. (5) versus the non-dimensional slenderness F, and the IOF test and FE results. The IOF test data
of Sélen [38] on welded stainless steel I-sections are also included in the figure. Note that only results
where failure under concentrated loading (rather than bending) is dominant are shown, which is
deemed to be the case according to the EN 1993-1-5 interaction formula when Mu < 0.5Mpl. The
conservatism of the EN 1993-1-5 provisions is evident over the full analysed slenderness range, but
particularly for the more stocky cross-sections.
For the members under ITF loading, Table 8 and Fig. 38 provide a comparison of the experimental
and numerical failure loads Fu with the predicted failure loads according to EN 1993-1-5 Fu,EC3. The
mean value of Fu/Fu,EC3 is equal to 1.80 with a coefficient of variation (COV) of 0.32, again indicating
substantial conservatism in the current Eurocode design provisions. The ITF loading test and FE results
are plotted against the EN 1993-1-5 strength curve in Fig. 39, revealing, together with Fig. 38,
discrepancies between the reference results and the EN 1993-1-5 predicted values are most significant
for stockier cross-sections (i.e. from hw/tw = 10 to hw/tw = 30). It should be noted also that an increase
in Fu/Fu,EC3 values is observed for cross-sections with slender webs relative to those with webs of
moderate slenderness (i.e. Fu/Fu,EC3 = 1.55 for hw/tw = 90 and Fu/Fu,EC3 = 1.61 for hw/tw = 120).
4.2. NORTH AMERICAN DESIGN PROVISIONS: AISC DESIGN GUIDE 27
The AISC Design Guide 27 [40] for the design of stainless steel hot-rolled/welded I-section members
under concentrated loading refers to the carbon steel design provisions set out in ANSI/AISC 360-16
[53]. The design resistance is obtained through the evaluation of the following limit states: (i) web
yielding, (ii) web crippling, and (iii) web buckling (for the internal two-flange loading only). The
design equations for each limit state are set out in Table 6. No explicit rules for the interaction between
concentrated transverse loading and bending moment are given [54], hence the provisions are
evaluated by comparing the experimental and numerical failure loads Fu with the design resistance
Fu,AISC taken as the minimum of the values determined for the aforementioned limit states. For the IOF
loading case, Table 7 shows a mean value of 2.42 for Fu/Fu,AISC with a coefficient of variation (COV)
14 Table 7 and Fig. 36, ranging from Fu/Fu,AISC = 1.63 for hw/tw = 120 to Fu/Fu,AISC = 3.04 for hw/tw = 10.
For the ITF loading case, Table 8 and Fig. 38 show not only high Fu/Fu,AISC ratios for the stockier
sections (i.e. Fu/Fu,AISC = 2.35 for hw/tw = 30 to Fu/Fu,AISC = 2.82 for hw/tw = 10) but also increasing
Fu/Fu,AISC ratios for the more slender sections (i.e. Fu/Fu,AISC = 2.35 for hw/tw = 30 to Fu/Fu,AISC = 7.69
for hw/tw = 120). The former is attributed to the neglect of the strain hardening experienced by stainless
steel members with stocky webs, while the latter is due to the conservatism of the web buckling limit
state formulae given in AISC 360-16, which do not consider the bearing length and were only
calibrated for sections with hw/tw ≤ 40 [55]. This conservatism has also been observed by Menkulasi
et al. [56].
4.3. DISCUSSION
Overall, the evaluations presented in sections 4.1 and 4.2 reveal that the current European and North
American design provisions for stainless steel members under concentrated transverse loading are
safe-sided but generally overly-conservative; this is the case for both internal one-flange (IOF) loading and
internal two-flange (ITF) loading. In the low slenderness range, the under-predictions of resistance are
attributed to strain hardening, which is particularly prominent in stainless steels, especially the
austenitic grades. In the high slenderness range, substantial under-predictions of resistance arose from
the application of the North American design provisions to the case of ITF loading where web buckling
is dominant. There is considered to be scope for the development of improved design formulae for
resistance to concentrated loading that take account of the particular characteristics of stainless steel
over the full slenderness range.
5. CONCLUSIONS
An extensive experimental and numerical investigation into the structural response of welded stainless
steel I-beams under two types of concentrated transverse loading: (i) internal one-flange (IOF) and (ii)
internal two-flange (ITF) loading has been presented. The physical experimental programme
comprised twenty four member tests: sixteen IOF tests and eight ITF tests. The experimental results
15 the bearing length and the web slenderness on the ultimate web bearing resistance of stainless steel
I-beams. Both the numerical and test results were used to assess the accuracy of the European and North
American design provisions for the ultimate web bearing resistance of welded stainless steel I-sections.
The results showed that the existing design rules generally lead to safe-sided but conservative
resistance predictions for members with stocky webs under both loading conditions; this is attributed
to the neglect of the significant strain hardening associated with stainless steel. Overly conservative
results were also observed for cross-sections with slender webs. The findings of this study highlight
the need for the development of new design rules for stainless steel beams under concentrated
transverse loading that recognise the particular characteristics of stainless steel; this is the focus of
ongoing work.
6. ACKNOWLEDGMENTS
The authors would like to thank Montanstahl AG for providing the test specimens for the project. The
contribution of Gordon Herbert, Les Clark and Behnam Behzadi Sofiani in the experimental part of
this work, as well as the financial support of the Brazilian National Council for Scientific and
16
REFERENCES
[1] Graham, J.D., Sherbourne, A.N., Kabbaz, R.N., and Jensen, C.D. "Welded interior beam-to-column connections". American Institute of Steel Construction (AISC), 1959.
[2] Granath, P. and Lagerqvist, O. "Behaviour of girder webs subjected to patch loading".Journal
of Constructional Steel Research, 50 (1): p. 49-69, 1999.
[3] Chacón, R., Herrera, J., and Fargier-Gabaldon, L. "Improved design of transversally stiffened steel plate girders subjected to patch loading". Engineering Structures, 150 (1): p. 774-785, 2017.
[4] Macdonald, M., Heiyantuduwa, M.A., Harrison, D.K., Bailey, R., and Rhodes, J. "Literature review of web crippling behaviour". in 2nd Scottish Conference for Postgraduate Researchers of the Built and Natural Environment (PRoBE 2005), Rotterdam (Netherlands): In-house Publishing, 2005.
[5] Mijušković, O., Branislav, Ć., Šćepanović, B., and Žugić, L. "Analytical model for buckling analysis of the plates under patch and concentrated loads".Thin-Walled Structures, 101: p. 26-42, 2016.
[6] Bakker, M.C.M. "Yield line analysis of post-collapse behaviour of thin-walled steel members".
Heron, 35 (3), 1990.
[7] Natário, P., Silvestre, N., and Camotim, D. "Localized web buckling analysis of beams subjected to concentrated loads using GBT".Thin-Walled Structures, 61: p. 27-41, 2012. [8] dos Santos, G.B., Gardner, L., and Kucukler, M. "A method for the numerical derivation of
plastic collapse loads".Thin-Walled Structures, 124: p. 258-277, 2018.
[9] Winter, G. and Pian, R.H.J. "Crushing strength of thin steel webs".Engineering Experiment
Station, Bulletin No 35 (Part 1): p. 1-24, 1946.
[10] Yu, W.W. and Hetrakul, N. "Webs for cold formed steel flexural members structural behavior of beam webs subjected to web crippling and a combination of web crippling and bending". University of Missouri-Rolla, 1978.
[11] Wing, B.A. and Schuster, R.M. "Web crippling of multi-web deck sections subjected to interior one flange loading". in Eighth International Speciality Conference on Cold-Formed Steel Structures: Recent Research and Developments in Cold-Formed Steel Design and Construction., St Louis, MO, USA: Univ of Missouri-Rolla, 1986.
[12] Beshara, B. and Schuster, R.M. "Web crippling data and calibrations of cold-formed steel members". Research Report RP00-2, University of Waterloo, 2000.
[13] Young, B. and Hancock, G.J. "Design of cold-formed channels subjected to web crippling".
17 [14] Young, B. and Hancock, G.J. "Cold-formed steel channels subjected to concentrated bearing
load".Journal of Structural Engineering ASCE, 129 (8): p. 1003-1010, 2003.
[15] Bhakta, B.H., LaBoube, R.A., and Yu, W.W. "The effect of flange restraint on web crippling strength". Civil Engineering Study 92-1, University of Missouri-Rolla, 1992.
[16] Cain, D.E., LaBoube, R.A., and Yu, W.W. "The effect of flange restraint on web crippling strength of cold-formed steel Z- and I- sections". Civil Engineering Study 95-2, University of Missouri-Rolla, 1995.
[17] Young, B. and Hancock, G.J. "Web crippling of cold-formed unlipped channels with flanges restrained".Thin-Walled Structures, 42 (6): p. 911-930, 2004.
[18] Janarthanan, B., Mahendran, M., and Gunalan, S. "Bearing capacity of cold-formed unlipped channels with restrained flanges under EOF and IOF load cases".Steel Construction, 8 (3): p. 146-154, 2015.
[19] Sivakumaran, K.S. and Zielonka, K.M. "Web crippling strength of thin-walled steel members with web opening".Thin-Walled Structures, 8 (4): p. 295-319, 1989.
[20] Uzzaman, A., Lim, J.B.P., Nash, D., Rhodes, J., and Young, B. "Cold-formed steel sections with web openings subjected to web crippling under two-flange loading conditions - Part I: Tests and finite element analysis".Thin-Walled Structures, 56: p. 38-48, 2012.
[21] Lian, Y., Uzzaman, A., Lim, J.B.P., Abdelal, G., Nash, D., and Young, B. "Web crippling behaviour of cold-formed steel channel sections with web holes subjected to interior-one-flange loading condition - Part I: Experimental and numerical investigation". Thin-Walled
Structures, 111: p. 103-112, 2017.
[22] Korvink, S.A., van der Berg, G.J., and van der Merwe, P. "Web crippling of stainless steel cold-formed beams".Journal of Constructional Steel Research, 34: p. 225-248, 1995.
[23] Zhou, F. and Young, B. "Experimental and numerical investigations of cold-formed stainless steel tubular sections subjected to concentrated bearing load".Journal of Constructional Steel
Research, 63 (11): p. 1452-66, 2007.
[24] Talja, A. and Hradil, P. "Structural Applications of Ferritic Stainless Steels (SAFSS) WP2: Structural performance of steel members - Model calibration tests". Report of the SAFSS
Project - Structural Applications of Ferritic Stainless Steels, VTT-R-06130-12, VTT Technical
Research Centre of Finland, 2012.
[25] Li, H.-T. and Young, B. "Cold-formed ferritic stainless steel tubular structural members subjected to concentrated bearing loads".Engineering Structures, 145: p. 392-405, 2017. [26] Bock, M., Arrayago, I., Real, E., and Mirambell, E. "Study of web crippling in ferritic stainless
18 [27] Bock, M. and Real, E. "Strength curves for web crippling design of cold-formed stainless steel
hat sections".Thin-Walled Structures, 85: p. 93-105, 2014.
[28] Yousefi, A.M., Lim, J.B.P., Uzzaman, A., and Clifton, G.C. "Numerical study of web crippling strength in cold-formed austenitic stainless steel lipped channels with web openings subjected to interior-two-flange loading". in 11th Pacific Structural Steel Conference, Shanghai, 2016. [29] Granholm, C.A. "Provning av balkar med extremt tunt liv (Testing of girders with extremely
thin web, in Swedish)". Report 202, Institutionen for Byggnadsteknik, 1960.
[30] Bergfelt, A. "Studies and tests on slender plate girders without stiffeners - shear strength and local web crippling". in IABSE Colloquium on Design of Plate and Box Girders for Ultimate Strength, Lisbon, Portugal, 1971.
[31] Roberts, T.M. and Markovic, N. "Stocky plate girders subjected to edge loading".Proceedings
of the Institution of Civil Engineers, Part 2, 75: p. 539-550, 1983.
[32] Dubas, P. and Tschamper, H. "Stabilite des ames soumises a une charge concentree et a une flexion globale (Stability of beams subjected to concentrated loads and bending moments, in French)".Construction Metallique, 2: p. 25-39, 1990.
[33] Gozzi, J. "Patch loading resistance of plated girders - Ultimate and serviceability limit state".
Department of Civil, Mining and Environmental Engineering, Luleå University of Technology,
PhD thesis, 2007.
[34] Chen, Y., Chen, X., and Wang, C. "Experimental and finite element analysis research on I-beam under web crippling".Materials and Structures, 49 (1-2): p. 421-437, 2016.
[35] Zoetemeijer, P. " The influence of normal-, bending- and shear stresses on the ultimate compression force exerted laterally to European rolled sections". Report 6-80-5, TU Delft, 1980.
[36] Oxford, J. and Gauger, H.U. "Beultraglast von Vollwandträgern unter Einzellasten (Ultimate buckling load of web girders under single loads, in German)".Stahlbau, 58 (11): p. 331-339, 1989.
[37] Lagerqvist, O. "Patch loading - Resistance of steel girders to concentrated forces".Division of
Steel Structures, Lulea University of Technology, PhD thesis (1994:159D), 1995.
[38] Sélen, E. "Work package 3.5 - Final Report - Web crippling". Report to the ECSC Project - Development of the use of stainless steel in construction. Contract no. 7210-SA/903, Lulea University of Technology, 2000.
[39] EN 1993-1-5:2006. Eurocode 3: Design of steel structures - Part 1-5: Plated structural
elements, European Committee for Standardization (CEN), Brussels, 2006.
19 [41] EN ISO 13919-1. Welding - Electron and laser beam welded joints - Guidance on quality levels
for imperfections - Part 1: Steel, European Committee for Standardization (CEN), Brussels,
1997.
[42] Gardner, L., Bu, Y., and Theofanous, M. "Laser-welded stainless steel I-sections: Residual stress measurements and columns buckling tests". Engineering Structures, 127: p. 536-548, 2016.
[43] EN ISO 6892-1:2009. Metallic materials - Tensile testing - Part 1: Method of test at ambient
temperature, European Committee for Standardization (CEN), Brussels, 2009.
[44] Schafer, B.W. and Pekoz, T. "Computational modeling of cold-formed steel: characterizing geometric imperfections and residual stresses".Journal of Constructional Steel Research, 47: p. 193-210, 1998.
[45] Zhao, O., Gardner, L., and Young, B. "Structural performance of stainless steel circular hollow sections under combined axial load and bending - Part 1: Experiments and numerical modelling".Thin-Walled Structures, 101: p. 231-239, 2016.
[46] DaVis. "Product-Manual DaVis 8.4". LaVision [Software] 2016.
[47] ABAQUS. "Abaqus version 6.14". SIMULIA - Dassault Systèmes [Software] 2014.
[48] Bu, Y. and Gardner, L. "Finite element modelling and design of welded stainless steel I-section columns".Journal of Constructional Steel Research, 2018, in press.
[49] Saliba, N. and Gardner, L. "Cross-section stability of lean duplex stainless steel welded I-sections".Journal of Constructional Steel Research, 80: p. 1-14, 2013.
[50] EN 1993-1-4:2006+A1:2015. Eurocode 3: Design of steel structures - Part 1.4: General rules
- Supplementary rules for stainless steels, European Committee for Standardization (CEN),
Brussels, 2006.
[51] Roberts, T.M. and Rockey, K.C. "A mechanism solution for predicting the collapse loads of slender plate girders when subjected to in-plane patch loading".Proceedings of Institution of
Civil Engineers, Part 2, 67: p. 155-175, 1979.
[52] Afshan, S. and Gardner, L. "The continuous strength method for structural stainless steel design".Thin-Walled Structures, 68: p. 42-49, 2013.
[53] ANSI/AISC 360-16. Specification for structural steel buildings, EUA, 2016.
[54] Ziemian, R.D. "Guide to stability design criteria for metal structures", 6th ed. USA: Wiley, 2010.
[55] Chen, W.F. and Newlin, D.E. "Column web strength in steel beam-to-column connections". in ASCE Annual and National Environmental Engineering Meeting, Missouri, USA, 1971. [56] Menkulasi, F., Farzana, N., Moen, C.D., and Eatherton, M.R. "Revisiting web compression
21
FIGURES
(a) Schematic setup (b) Test setup Fig. 1. Experimental setup for IOF specimens.
(a) Schematic setup (b) Test setup Fig. 2. Experimental setup for ITF specimens.
[image:22.595.56.544.93.686.2](a) Schematic setup (b) Test setup Fig. 3. Imperfection measurement setup.
L/2
0 L
hw/2
Mid-height Top
Bottom
LVDT
Machine base
I-section web
Lines along which LVDTs were moved
10 mm
10 mm
10 mm 10 mm
hw/2
DT2 ss
L
Bearing plate End
plate
Roller
Roller
Supporting plates Grease
tf
bf
tw
h hw DT1
DT1
L/2
sh
a
ss
L
Bearing plate End
plate tf
bf
tw
h hw
ss
DT1
Bearing plate DT1
hw/2
sh
sh
22
Fig. 4. Measured out-of-plane geometric imperfections uavg for IOF-H102-L300-SS10 test specimen. 0.00
0.01 0.02 0.03 0.04 0.05 0.06 0.07 0.08
0 0.1 0.2 0.3 0.4 0.5 0.6 0.7 0.8 0.9 1
Out
-of
-pl
ane
i
m
per
fec
ti
on
(m
m
)
Normalized distance along member length
umid
ubottom
uavg = umid− (utop+ ubottom)/2
utop
ω0
23
Fig. 5. Failure modes of internal one-flange (IOF) loading test specimens.
IOF-H150-L150-SS60
IOF-H150-L200-SS60
IOF-H150-L300-SS60
IOF-H150-L400-SS60
IOF-H150-L450-SS60
IOF-H102-L300-SS5
IOF-H102-L300-SS7.5
IOF-H102-L300-SS10
IOF-H102-L300-SS12.5
IOF-H102-L300-SS15
IOF-H102-L300-SS20
IOF-H152-L150-SS30
IOF-H152-L300-SS30
IOF-H152-L450-SS30
IOF-H152-L600-SS30
24
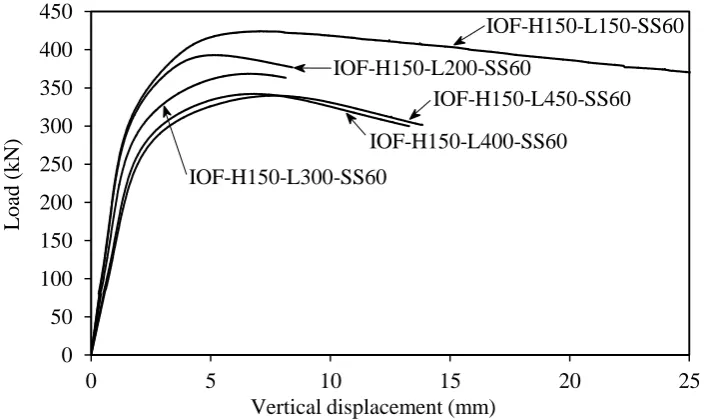
Fig. 6. Load-vertical displacement response of the tested IOF H150 specimens.
Fig. 7. Load-vertical displacement response of the tested IOF H152 specimens. 0
50 100 150 200 250 300 350 400 450
0 5 10 15 20 25
Load
(k
N
)
Vertical displacement (mm)
IOF-H150-L150-SS60 IOF-H150-L200-SS60
IOF-H150-L300-SS60
IOF-H150-L450-SS60 IOF-H150-L400-SS60
0 50 100 150 200 250 300 350 400
0 5 10 15 20 25
Load
(k
N
)
Vertical displacement (mm)
IOF-H152-L150-SS30 IOF-H152-L300-SS30
[image:25.595.119.474.347.558.2]25
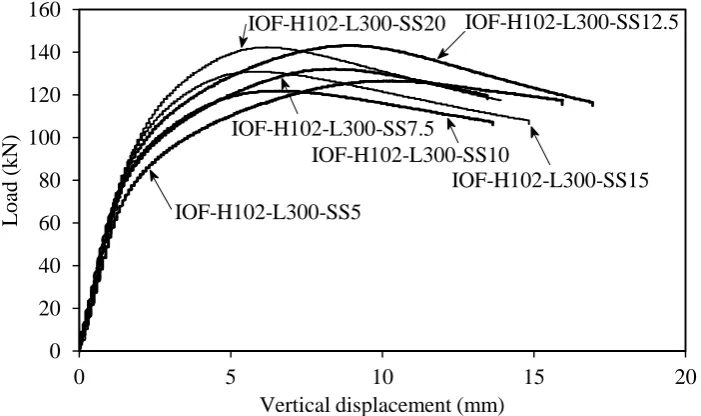
Fig. 8. Load-vertical displacement response of the tested IOF H102 specimens.
Fig. 9. Load-web shortening response of the tested IOF H150 specimens. 0
20 40 60 80 100 120 140 160
0 5 10 15 20
Load
(k
N
)
Vertical displacement (mm)
IOF-H102-L300-SS12.5 IOF-H102-L300-SS20
IOF-H102-L300-SS7.5
IOF-H102-L300-SS10
IOF-H102-L300-SS15 IOF-H102-L300-SS5
0 50 100 150 200 250 300 350 400 450
0 5 10 15 20 25
Load
(k
N
)
Web shortening (mm)
IOF-H150-L150-SS60 IOF-H150-L200-SS60
IOF-H150-L300-SS60
[image:26.595.120.474.357.570.2]26
Fig. 10. Load-web shortening response of the tested IOF H152 specimens.
Fig. 11. Load-web shortening response of the tested IOF H102 specimens. 0
50 100 150 200 250 300 350 400
0 5 10 15 20 25
Load
(k
N
)
Web shortening (mm)
IOF-H152-L150-SS30
IOF-H152-L300-SS30
IOF-H152-L750-SS30 IOF-H152-L600-SS30
IOF-H152-L450-SS30
0 20 40 60 80 100 120 140 160
0 2 4 6 8 10 12
Load
(k
N
)
Web shortening (mm)
IOF-H102-L300-SS12.5 IOF-H102-L300-SS20
IOF-H102-L300-SS7.5
IOF-H102-L300-SS10
[image:27.595.125.470.323.533.2]27
Fig. 12. Load-out-of-plane displacement response of the tested IOF H150 specimens.
Fig. 13. Load-out-of-plane displacement response of the tested IOF H152 specimens. 0
50 100 150 200 250 300 350 400 450
0 5 10 15 20 25
Load
(k
N
)
Out-of-plane displacement (mm)
IOF-H150-L150-SS60 IOF-H150-L200-SS60 IOF-H150-L300-SS60
IOF-H150-L400-SS60 IOF-H150-L450-SS60
0 50 100 150 200 250 300 350 400
0 5 10 15 20 25
Load
(k
N
)
Out-of-plane displacement (mm) IOF-H152-L150-SS30
IOF-H152-L300-SS30
IOF-H152-L600-SS30
[image:28.595.120.474.322.533.2]28
Fig. 14. Load-out-of-plane displacement response of the tested IOF H102 specimens.
Fig. 15. Load-out-of-plane displacement response of test specimen IOF-H150-L400-SS60 and corresponding out-of-plane web deformation fields obtained using Digital Image Correlation.
0 20 40 60 80 100 120 140 160
0 2 4 6 8 10 12
Load
(k
N
)
Out-of-plane displacement (mm)
IOF-H102-L300-SS20 IOF-H102-L300-SS12.5 IOF-H102-L300-SS10 IOF-H102-L300-SS12.5 IOF-H102-L300-SS15 IOF-H102-L300-SS7.5 0 50 100 150 200 250 300 350 400
0 2 4 6 8 10 12 14 16 18 20 22 24
Load
(k
N
)
Out-of-plane displacement (mm)
25
0 12.5
-200 0 200 [mm]
-75 75 0 25 0 12.5
-200 0 200
-75 75 0 25 0 12.5
-200 0 200
-75 75 0 25 0 12.5
-200 0 200
29
Fig. 16. Failure modes of internal two-flange (ITF) loading test specimens.
Fig. 17. Load-web shortening response of the tested ITF H102 specimens. 0
50 100 150 200 250 300
0 5 10 15 20
Loa
d
(k
N)
Web shortening (mm) ITF-H102-L500-SS100
ITF-H102-L500-SS80 ITF-H102-L500-SS60
ITF-H102-L500-SS40 ITF-H102-L500-SS20
ITF-H160-L475-SS20
ITF-H160-L475-SS40
ITF-H160-L475-SS60
ITF-H102-L500-SS20
ITF-H102-L500-SS40
ITF-H102-L500-SS60
ITF-H102-L500-SS80
30
Fig. 18. Load-web shortening response of the tested ITF H160 specimens.
Fig. 19. Load-out-of-plane displacement response of the tested ITF H102 specimens. 0
100 200 300 400 500 600 700 800
0 10 20 30 40
Load
(k
N
)
Web shortening (mm) ITF-H160-L475-SS60 ITF-H160-L475-SS40 ITF-H160-L475-SS20
0 50 100 150 200 250
0 5 10 15 20
Loa
d
(k
N)
Out-of-plane displacement (mm) ITF-H102-L500-SS100
ITF-H102-L500-SS80 ITF-H102-L500-SS60
[image:31.595.119.471.321.535.2]31
Fig. 20. Load-out-of-plane displacement response of the tested ITF H160 specimens.
Fig. 21. Load-out-of-plane displacement response of test specimen ITF-H102-L500-SS20 and corresponding out-of-plane web deformation fields obtained using Digital Image Correlation.
0 100 200 300 400 500 600 700 800
0 5 10 15 20
L
oad
(k
N
)
Out-of-plane displacement (mm) ITF-H160-L475-SS60 ITF-H160-L475-SS40 ITF-H160-L475-SS20 0 20 40 60 80 100 120 140 160 180
0 2 4 6 8 10 12 14 16 18 20
Load
(k
N
)
Out-of-plane displacement (mm)
[mm] -100 0 (mid-span) 100
0 -16 -8 -45 45 0 [mm] -100 0 (mid-span) 100
0 -16 -8 -45 45 0 [mm] -100 0 (mid-span) 100
0 -16 -8 -45 45 0 [mm] -100 0 (mid-span) 100
[image:32.595.123.476.322.531.2]32
Fig. 22. Engineering and true stress-strain curves for material from tested cross-sections.
[image:33.595.55.539.65.423.2](a) IOF (b) ITF Fig. 23. Boundary conditions adopted in the finite element models.
0 100 200 300 400 500 600 700 800 900 1000
0 10 20 30 40 50 60 70
S tr e s s ( M P a ) Strain (%)
I 102x68x5x5, Engineering I 102x68x5x5, True I 1026855 ‒ Engineering I 1026855 ‒ True
0 100 200 300 400 500 600 700 800 900 1000
0 10 20 30 40 50 60 70
S tr e s s ( M P a ) Strain (%)
I 152x160x6x9 flange, Engineering I 152 160 6 9 flange ‒ True I 152x160x6x9 web, Engineering I 152 160 6 9 web ‒ True
I 15216069 flange ‒ Engineering I 15216069 flange ‒ True I 15216069 web ‒ Engineering I 15216069 web ‒ True
0 100 200 300 400 500 600 700 800 900 1000
0 10 20 30 40 50 60 70
S tr e s s ( M P a ) Strain (%)
I 160x82x10x12 flange, Engineering I 160 82 10 12 flange ‒ True I 160x82x10x12 web, Engineering I 160 82 10 12 web ‒ True
I 160821012 flange ‒ Engineering I 160821012 flange ‒ True I 160821012 web ‒ Engineering I 160821012 web ‒ True 0 100 200 300 400 500 600 700 800 900 1000
0 10 20 30 40 50 60 70
S tr e s s ( M P a ) Strain (%)
I 150x75x7x10 flange, Engineering I 150 75 7 10 flange ‒ True I 150x75x7x10 web, Engineering I 150 75 7 10 web ‒ True
I 15075710 flange ‒ Engineering I 15075710 flange ‒ True I 15075710 web ‒ Engineering I 15075710 web ‒ True
U3 = 0 .
2 1
3 L
ss
U1 = 0 U2 = 0 UR2 = 0 UR3 = 0 Applied U2
L/2
2 1 3 U1 = 0
U3 = 0
L ss
Applied U2
ss
L/2
U1 = 0 U2 = 0 U3 = 0
33
Fig. 24. Experimental and numerical failure modes of specimen IOF-H102-L300-SS12.5.
Fig. 25. Experimental and numerical failure modes of specimen ITF-H102-L500-SS60.
Fig. 26. Experimental and numerical load-web shortening responses of the IOF-H102-L300-SS15 specimen. 0
20 40 60 80 100 120 140
0 2 4 6 8 10 12
Load
(k
N
)
Web shortening (mm)
34
[image:35.595.129.461.60.274.2]Fig. 27. Experimental and numerical load-out-of-plane displacement response of the IOF-H152-L450-SS30 specimen.
Fig. 28. Experimental and numerical load-web shortening response of the ITF-H102-L500-SS40 specimen. 0
50 100 150 200 250 300 350
0 2 4 6 8 10 12 14 16
Load
(k
N
)
Out-of-plane displacement (mm)
Test FE
0 20 40 60 80 100 120 140 160 180 200
0 5 10 15 20 25
Load
(k
N
)
Web shortening (mm)
[image:35.595.117.480.336.549.2]35
Fig. 29. Experimental and numerical load-out-of-plane displacement response of the ITF-H102-L500-SS100 specimen.
0 50 100 150 200 250 300
0 5 10 15
Load
(k
N
)
Web shortening (mm)
36
(a) Vertical axis scale up to 3000 kN (b) Vertical axis scale up to 250 kN
Fig. 30. Influence of bearing length (ss), normalized by web height, on ultimate load of IOF models for different web slenderness (hw/tw).
(a) Vertical axis scale up to 2500 kN (b) Vertical axis scale up to 140 kN
Fig. 31. Influence of bearing length (ss), normalized by web height, on ultimate load of ITF models for different web slenderness (hw/tw).
0 500 1000 1500 2000 2500 3000
0.00 0.20 0.40 0.60 0.80 1.00 1.20 1.40
U lt im at e load, Fu (k N )
ss/hw
hw/tw = 10 hw/tw = 30 hw/tw = 60 hw/tw = 90 hw/tw = 120
hw/tw= 10
hw/tw= 30
hw/tw= 60
hw/tw= 90
hw/tw= 120
0 50 100 150 200 250
0.00 0.20 0.40 0.60 0.80 1.00 1.20 1.40
U lt im at e load, Fu (k N )
ss/hw
hw/tw = 60 hw/tw = 90 hw/tw = 120
hw/tw= 60
hw/tw= 90
hw/tw= 120
0 500 1000 1500 2000 2500
0.00 0.20 0.40 0.60 0.80 1.00 1.20 1.40
U lt im at e load, Fu (k N )
ss/hw
hw/tw = 10 hw/tw = 30 hw/tw = 60 hw/tw = 90 hw/tw = 120
hw/tw= 10
hw/tw= 30
hw/tw= 60
hw/tw= 90
hw/tw= 120
0 20 40 60 80 100 120 140
0.00 0.20 0.40 0.60 0.80 1.00 1.20 1.40
U lt im at e load, Fu (k N )
ss/hw
hw/tw = 60 hw/tw = 90 hw/tw = 120
hw/tw= 60
hw/tw= 90
37
(a) Vertical axis scale up to 3000 kN (b) Vertical axis scale up to 500 kN
Fig. 32. Influence of web slenderness (hw/tw) on ultimate load of IOF models for different bearing length to web-height ratios.
(a) Vertical axis scale up to 2500 kN (b) Vertical axis scale up to 500 kN
Fig. 33. Influence of web slenderness (hw/tw) on ultimate load of ITF models for different bearing length to web-height ratios. 0 500 1000 1500 2000 2500 3000
0 25 50 75 100 125 150
U lt im at e load, Fu (k N )
hw/tw
ss/hw = 0.05 ss/hw = 0.34 ss/hw = 0.63 ss/hw = 0.91 ss/hw = 1.20
ss/hw= 0.05
ss/hw= 0.34
ss/hw= 0.63
ss/hw= 0.91
ss/hw= 1.20
0 100 200 300 400 500
0 25 50 75 100 125 150
U lt im at e load, Fu (k N )
hw/tw
ss/hw = 0.05 ss/hw = 0.34 ss/hw = 0.63 ss/hw = 0.91 ss/hw = 1.20
ss/hw= 0.05
ss/hw= 0.34
ss/hw= 0.63
ss/hw= 0.91
ss/hw= 1.20
0 500 1000 1500 2000 2500
0 25 50 75 100 125 150
U lt im at e load, Fu (k N )
hw/tw
ss/hw = 0.05 ss/hw = 0.34 ss/hw = 0.63 ss/hw = 0.91 ss/hw = 1.20
ss/hw= 0.05
ss/hw= 0.34
ss/hw= 0.63
ss/hw= 0.91
ss/hw= 1.20
0 50 100 150 200 250 300 350 400 450 500
0 25 50 75 100 125 150
U lt im at e load, Fu (k N )
hw/tw
ss/hw = 0.05 ss/hw = 0.34 ss/hw = 0.63 ss/hw = 0.91 ss/hw = 1.20
38
Fig. 34. Definition of Fu and Fu,pred for IOF loading case.
Fig. 35. Comparison of IOF test and FE results with EN 1993-1-5 F-M interaction diagram. 0.0
0.5 1.0 1.5 2.0 2.5 3.0 3.5 4.0
0.0 1.0 2.0 3.0 4.0 5.0
FEd
/
FRd
MEd/MRd
Test data FE data EN 1993-1-5
hw/tw= 10
Interaction curve Test or numerical
ultimate load
Predicted resistance Design interaction curve
M F
Fu,pred
Fu
39
[image:40.595.137.460.64.273.2]Fig. 36. Comparison of IOF loading test and FE results against the European and North American design resistance predictions.
Fig. 37. Comparison of ultimate strengths determined from IOF loading tests and FE simulations against EN 1993-1-5 design curve.
0.0 1.0 2.0 3.0 4.0 5.0 6.0 7.0
0.0 0.5 1.0 1.5 2.0 2.5
Fu
/
Fu
,p
red
Test / EN 1993-1-5 FE / EN 1993-1-5 Test / AISC 360-16 FE / AISC 360-16
F
0.0 0.2 0.4 0.6 0.8 1.0 1.2 1.4 1.6 1.8
0.0 0.5 1.0 1.5 2.0 2.5 3.0
χF
FE data Test data
Existing test data [38] EN 1993-1-5
F
40
Fig. 38. Comparison of ITF loading test and FE results against the European and North American resistance predictions.
Fig. 39. Comparison of ultimate strengths determined from ITF loading tests and FE simulations against EN 1993-1-5 design curve.
0.0 1.0 2.0 3.0 4.0 5.0 6.0 7.0 8.0 9.0 10.0
0.0 0.5 1.0 1.5 2.0 2.5 3.0
Fu
/
Fu
,p
red
Test / EN 1993-1-5 FE / EN 1993-1-5 Test / AISC 360-16 FE / AISC 360-16
F
0.0 0.5 1.0 1.5 2.0 2.5 3.0
0.0 0.5 1.0 1.5 2.0 2.5 3.0
χF
Test data
FE data EN 1993-1-5
F
[image:41.595.132.457.354.568.2]41
TABLES
Table 1. Summary of material properties measured from tensile coupon tests [42].
Specimen
E fy f1.0 fu εu εf
42
Table 2. Summary of measured dimensions, geometric imperfections and test results of the IOF specimens.
Specimen
h tw bf tf ss = sh L a hep bf,ep tep ω0 Fu δu δu,v
(mm) (mm) (mm) (mm) (mm) (mm) (mm) (mm) (mm) (mm) (mm) (kN) (mm) (mm) IOF-H150-L150-SS60 149.9 6.95 75.8 9.91 60.0 162.0 149.9 161.3 89.9 12.1 0.098 424.4 6.2 7.1 IOF-H150-L200-SS60 150.0 6.87 75.8 9.79 60.0 212.2 200.1 161.4 89.8 12.1 0.056 393.1 3.4 5.1 IOF-H150-L300-SS60 149.9 6.88 75.8 9.76 60.0 313.1 301.0 162.1 89.9 12.1 0.055 368.6 3.2 6.5 IOF-H150-L400-SS60 150.2 6.81 75.7 9.80 60.0 414.1 402.0 161.6 89.9 12.1 0.029 342.2 9.2 6.8 IOF-H150-L450-SS60 150.0 6.87 75.7 9.79 60.0 464.1 452.0 161.7 89.9 12.1 0.041 340.0 9.9 7.8
IOF-H152-L150-SS30 151.7 6.20 160.0 8.73 30.0 162.2 150.0 164.5 150.0 12.2 0.007 340.0 6.2 6.7 IOF-H152-L300-SS30 152.9 6.18 159.0 8.77 30.0 313.1 301.0 164.0 150.1 12.1 0.058 322.2 4.6 6.5 IOF-H152-L450-SS30 152.0 6.22 159.6 8.73 30.0 463.1 451.0 164.3 150.1 12.1 0.017 301.1 3.8 6.3 IOF-H152-L600-SS30 152.3 6.18 159.6 8.88 30.0 610.1 598.0 164.3 150.1 12.1 0.027 296.7 4.0 8.3 IOF-H152-L750-SS30 151.8 6.13 159.8 8.68 30.0 762.6 750.5 160.5 149.5 12.1 0.030 275.0 4.1 9.5
43
Table 3. Summary of measured dimensions, geometric imperfections and test results of the ITF specimens.
Specimen
h tw bf tf ss = sh L a hep bf,ep tep ω0 Fu δu (mm) (mm) (mm) (mm) (mm) (mm) (mm) (mm) (mm) (mm) (mm) (kN) (mm) ITF-H102-L500-SS20 101.3 4.94 67.8 4.94 20.0 524.0 500.0 112.0 89.8 12.0 0.016 154.5 5.7 ITF-H102-L500-SS40 101.6 4.98 67.8 4.97 40.0 522.4 498.3 111.9 89.9 12.0 0.001 178.4 3.5 ITF-H102-L500-SS60 101.4 4.94 67.7 4.92 60.0 524.4 500.3 112.0 89.8 12.0 0.011 194.8 2.4 ITF-H102-L500-SS80 101.5 4.95 67.7 4.93 80.0 524.0 500.0 111.9 89.8 12.0 0.077 209.6 1.8 ITF-H102-L500-SS100 101.6 5.01 67.8 4.95 100.0 524.0 500.0 111.9 89.8 12.0 0.046 239.6 1.5
44
Table 4. Comparison of the IOF test results with FE results for different imperfection amplitudes.
Specimen
Measured amplitude tw/100 tw/300 tw/500
Fu,FE / Fu,Test δu,FE / δu,Test Fu,FE / Fu,Test δu,FE / δu,Test Fu,FE / Fu,Test δu,FE / δu,Test Fu,FE / Fu,Test δu,FE / δu,Test IOF-H150-L150-SS60 0.99 0.59 0.97 0.47 0.99 0.48 1.00 0.51 IOF-H150-L200-SS60 1.01 1.05 0.99 0.66 1.01 0.73 1.06 0.81 IOF-H150-L300-SS60 1.01 1.36 1.00 0.61 1.01 0.62 1.02 0.62 IOF-H150-L400-SS60 1.04 0.59 1.02 0.22 1.02 0.19 1.03 0.21 IOF-H150-L450-SS60 1.03 0.64 1.01 0.17 1.01 0.19 1.01 0.17
IOF-H152-L150-SS30 1.05 0.79 0.96 0.58 1.00 0.70 1.02 0.64 IOF-H152-L300-SS30 0.96 0.93 0.93 0.57 0.95 0.66 0.96 0.65 IOF-H152-L450-SS30 1.01 1.47 0.96 0.69 0.99 0.78 1.01 0.86 IOF-H152-L600-SS30 0.96 1.53 0.93 0.62 0.95 0.69 0.96 0.68 IOF-H152-L750-SS30 0.95 1.69 0.92 0.53 0.94 0.58 0.95 0.65
IOF-H102-L300-SS5 0.96 0.97 0.95 0.65 0.99 0.68 0.99 0.72 IOF-H102-L300-SS7.5 1.03 1.49 0.96 0.75 0.99 0.77 1.01 0.80 IOF-H102-L300-SS10 1.05 1.52 1.05 0.89 1.07 0.94 1.09 1.03 IOF-H102-L300-SS12.5 0.92 1.08 0.92 0.63 0.94 0.70 0.95 0.70 IOF-H102-L300-SS15 1.02 1.69 1.04 1.01 1.06 1.11 1.07 1.14 IOF-H102-L300-SS20 1.02 1.98 0.96 0.82 0.99 0.91 1.00 0.94
Mean 1.00 1.21 0.97 0.62 0.99 0.67 1.01 0.70
COV 0.04 0.36 0.04 0.35 0.04 0.36 0.04 0.37