warwick.ac.uk/lib-publications
A Thesis Submitted for the Degree of PhD at the University of Warwick
Permanent WRAP URL:
http://wrap.warwick.ac.uk/109831
Copyright and reuse:
This thesis is made available online and is protected by original copyright.
Please scroll down to view the document itself.
Please refer to the repository record for this item for information to help you to cite it.
Our policy information is available from the repository home page.
Essays in Development Economics
by
Paula Lopez Pena
Thesis
Submitted to the University of Warwick
for the degree of
Doctor of Philosophy
Department of Economics
Contents
List of Tables iv
Acknowledgments vi
Declarations vii
Abstract viii
Chapter 1 Stress Management Practices, Owner Wellbeing and Firm
Outcomes in Bangladesh 1
1.1 Introduction . . . 1
1.2 The Stress Management Intervention . . . 5
1.2.1 Conceptual Framework: Owner Stress and Firm Performance 5 1.2.2 The CBT and Empathic Listening Interventions . . . 7
1.3 The Sample and Experimental Design . . . 10
1.3.1 Target Population and Recruitment . . . 10
1.3.2 Data and Randomization Balance . . . 11
1.4 E↵ects on Stress and Firm Outcomes . . . 13
1.4.2 CBT Impact on Stress Levels . . . 14
1.4.3 CBT Impact on Profits and Sales . . . 15
1.4.4 E↵ects on Inputs . . . 16
1.4.5 Robustness to Baseline Imbalance . . . 17
1.5 Heterogeneity Analysis: Who Benefits from Learning Stress Manage-ment Techniques? . . . 19
1.5.1 Di↵erences in Treatment E↵ects Across Sectors . . . 19
1.5.2 Alternative Mechanisms . . . 22
1.6 Conclusion . . . 24
Chapter 2 Willingness to Accept Preschool Incentives in Urban Bangladesh 42 2.1 Introduction . . . 43
2.2 The fragmented supply of childcare services in urban Bangladesh . . . 46
2.3 Target Population and Experimental Design . . . 47
2.3.1 Household Census . . . 47
2.3.2 BDM mechanism design and implementation . . . 48
2.3.3 Living Conditions, Employment and Childcare Use . . . 51
2.3.4 Respondents’ Well-being and Childcare Use . . . 53
2.4 Results . . . 54
2.4.1 BDM Method Results . . . 54
2.4.2 Subsequent Trial and Enrollment Rates . . . 55
2.5 Discussion . . . 56
2.5.2 Did households underestimate the size of the incentive? . . . 57
2.5.3 Could lack of information explain baseline di↵erences in adop-tion? . . . 58
2.5.4 Pricing, location and opening times of the center . . . 59
2.6 Conclusion . . . 60
Chapter 3 Urban Life, Employment and Well-Being in Bangladesh 71 3.1 Introduction . . . 72
3.2 Context and Sampling Frame . . . 74
3.2.1 Bangladesh: A Rapidly Urbanizing Country . . . 74
3.2.2 Sampling Frame . . . 75
3.3 Outcomes and Correlates of Interest . . . 75
3.4 Individual and Household Characteristics . . . 77
3.5 Di↵erences in Mental Health . . . 79
3.6 Di↵erences in Physical Health . . . 82
3.6.1 Number of Days Spent Sick or with Fever . . . 82
3.6.2 BMI and Illness Sources in Dhaka City . . . 85
List of Tables
1.1 Baseline Balance . . . 26
1.2 Impact of Training on the Stress Index . . . 28
1.3 Impact of CBT on Profits and Sales . . . 29
1.4 Impact of Training on Inputs . . . 31
1.5 Di↵erences in Firm and Owner Characteristics by Industry . . . 32
1.6 Heterogeneous E↵ects on Stress by Industry . . . 34
1.7 Heterogeneous Treatment E↵ects on Profits and Sales . . . 36
1.8 Heterogeneous Treatment E↵ects on Inputs . . . 37
A1 Robustness of Main Results to Baseline Imbalance . . . 38
A2 Robustness of Main Results to Di↵erence-in-Di↵erence Estimation . 39 A3 Robustness of Main Results to Multiple Testing Hypothesis (AN-COVA Specification with Sidak-Adjusted P-Values) . . . 40
A4 Robustness of Heterogeneity Analysis to Multiple Testing Hypothesis (Sidak-Adjusted P-Values) . . . 41
A1 Household Characteristics . . . 63
A2 Reported Use and Interest in Trying Formal Childcare . . . 65
A4 Correlates of the Stress Index by Head and Spouse’s Occupational Status . . . 67
A5 Amount of Stipend (BDT) . . . 68
A6 Amount of Stipend (BDT) with Additional Household Controls . . . 69
A7 Amount of Stipend (BDT) Controlling for Low-Adoption Areas . . . 70
A1 Summary Statistics . . . 89
A2 OLS Stress Index on Individual Characteristics . . . 90
A3 Respondent and Other Household Members’ Sick Days . . . 91
A4 Distance from optimal BMI for Overweight Respondents in Urban Areas . . . 92
A5 Correlates of Stress Index II (Standardized Sum of the Nine Mental Health Questions) . . . 93
A6 Correlates of Stress Index Winsorized (95th percentile) . . . 94
A7 OLS Stress Index (I) with Infrastructure and Safety Controls . . . . 95
A8 OLS Stress Index (I) with Missing Data Dummies . . . 96
A9 Respondent and Other Household Members’ Sick Days, with Infras-tructure and Safety Controls . . . 97
Acknowledgments
I am indebted to my thesis advisors Christopher Woodru↵, Anandi Mani and James
Fenske for their guidance and support. I want to extend my thanks to everyone who
provided comments during and after the presentation of my work at seminars in
Warwick, Oxford and the Paris School of Economics. I also want to thank the
Innovations for Poverty Actions team for their continuous support and for making
my stay in Bangladesh highly rewarding and enjoyable. Finally, I want to thank my
Declarations
All three chapters of this thesis contain original research based on novel data used
for the first time in this research. Chapter one has been written solely by me,
incorporating many comments from my thesis supervisors and others with whom I
discussed my research. Chapters two and three resulted from joint research projects
with Atonu Rabbani and Christopher Woodru↵, in which we jointly planned and
implemented the field work and analyzed the data. These chapters were written by
me, under the supervision of Christopher Woodru↵and James Fenske. All errors in
Abstract
This thesis consists of three chapters, which address di↵erent but related research
questions, using original data collected during extensive field work in Bangladesh.
Chapter one studies the impact of training in stress management on firm
out-comes in Bangladesh. 310 female owners were recruited and one-half was randomly
o↵ered a 10-week training based on Cognitive Behavioral Therapy, the current best
practice treatment for chronic stress. The other half was assigned to an active
con-trol group and received empathetic listening. Initially, CBT reduces stress levels but
does not a↵ect profits and sales. For owners in sectors with a high concentration of
women, predominantly clothing and handicrafts shops, the e↵ect of CBT on stress
dissipates within six months and it has no e↵ect on profits and sales. For owners in
sectors with a lower concentration of women, such as electronics or interior design,
the e↵ect of CBT on stress persists six months after the treatment, and profits and
sales grow over time.
Chapter two uses a reverse Becker-DeGroot-Marschak (BDM) mechanism
to elicit the willingness to accept a one-time subsidy to try formal childcare in 17
low-income communities in Bangladesh. We visited 635 households with
preschool-age children and invited the 415 that were not using childcare to participate in
the BDM. The median and modal amounts demanded to try the service are 500
Bangladeshi Taka, approximately 6 US dollars. Households where the head owns a
business or does not work demand significantly lower subsidies, compared to those
or in communities where daycare use is low, also demand smaller subsidies. One
month after receiving the subsidy, only 17 parents had visited the centre and 9
enrolled their child. These results suggest that a single cash transfer might not
be an e↵ective policy for increasing preschool enrollment and regular attendance in
low-income urban areas.
Chapter three studies correlations between physical and mental health
out-comes, employment and household infrastructure in a sample of 1,778 low-income
households in Greater Dhaka, Bangladesh. Women and urban dwellers have lower
well-being levels than men and residents of peri-urban areas, even after controlling
for occupation, consumption and household infrastructure. Participation in paid
employment is associated with higher levels of stress for women, but the e↵ects are
concentrated on women who own a business or work as domestic helpers. Female
garment workers, the largest occupational group among women, fare no worse than
women who do not work. Proximity to central Dhaka is associated with higher
ac-cess to improved sanitation but worse health. Peri-urban dwellers spend less days
Chapter 1
Stress Management Practices,
Owner Wellbeing and Firm
Outcomes in Bangladesh
1.1
Introduction
Small firm owners, particularly those in developing countries, routinely confront daily demands that compete for time and e↵ort needed to address vital, overarching managerial tasks. An emerging theme in the business training literature suggests that nudging owners to direct attention toward long-term business goals, and away from day-to-day operations, can lead to firm growth (Bruhn et al. [2017]; Field et al. [2016]. Furthermore, teaching entrepreneurial attitudes, such as proactiveness and persistence in the pursuit of goals, has been shown to have large positive ef-fects on sales and profits compared to standard business training (Campos et al. [2017]). Identifying interventions and mechanisms conducive to increases in profits of entrepreneurs has implications for economic growth (Berge et al. [2015]), with particular implications for emerging economies, where small and medium-sized en-terprises (SMEs) account for approximately 45 percent of total employment and 33 percent of GDP (OECD [2017]).
information processing and decision making, and has deleterious e↵ects on health (Calvo and Gutierrez-Garcia [2016]; Schneiderman et al. [2005]). The management science literature has documented that firm owners often operate under conditions of high arousal and that their ability to endure stress is strongly correlated with firm revenue and growth (Baron et al. [2016]; Roche et al. [2014]; Baron et al. [2012]). Nonetheless, evidence on causal links in lacking.
In this paper, I test the hypothesis that teaching stress-management skills can lead to increased profits and sales among SMEs in a low-income setting. To investigate this, I evaluate the impact of a 10-week course of Cognitive Behavioral Therapy (CBT) that was provided to female business owners in Bangladesh.
A sample of 310 female owners of SMEs affiliated with the Bangladesh Women Chamber of Commerce and Industry participated in the experiment. Nearly 58 percent of the women owned handicrafts or clothing shops (also known as “bou-tiques”). These are by far the two most popular entrepreneurial choices among women in Bangladesh (Asian Development Bank [2015]). The remaining owners were engaged in a wide range of sectors, including electronics, interior design and food processing. These have a very low concentration of women, and are considered “less traditionally female” (Shamim [2008]).
All participants were told that the purpose of the study was to understand what type of intervention could help improve well-being levels among business-women. Half of the sample was randomly o↵ered CBT, which is considered to be the current best practice treatment for stress and anxiety-related disorders (Hofmann et al. [2012]; Butler et al. [2006]). CBT is a talking therapy that teaches strategies to change habits associated with negative health outcomes.1 In each session, the CBT
therapist guides the trainee through written and physical exercises that facilitate the adoption and maintenance of new behaviors (Schmidt and Woolaway-Bickel [2000]). For example, CBT encourages practicing muscle-relaxation techniques2 instead of
using medication for anxiety. The CBT exercises, which included priority-setting and relaxation techniques, were adapted to the local context for the purposes of this study by the Department of Clinical Psychology of the University of Dhaka. An
1 For instance, stress can induce changes in eating patterns and is considered a common risk
factor for obesity and drug addiction (Sinha and Jastrebo↵[2013].
2 Muscle relaxation has been shown to reduce salivary cortisol and heart rate. See Varvogli and
independent clinical supervisor was hired to ensure adherence to the standard CBT intervention protocol by the therapists.
The other half of the sample consisted of an active control group that was o↵ered Empathic Listening (EL), a form of non-directive counseling often used as a comparison for CBT in studies of clinical e↵ectiveness (Stain et al. [2016]; Kahn et al. [2017]). EL provides emotional support but no direct advice (Rautalinko et al. [2007]).
Immediately after the 10-week-long treatment, measurements of an aggregate index of symptoms of stress showed a 0.33-standard-deviation decrease for the group that had received CBT compared to the group that had received EL. The stress reduction did not translate into immediate increases in profits or sales at that point in time. Six months after the treatment, CBT continued to lead to lower levels of stress but to a smaller degree (0.12 standard deviations and not significant for the average owner), and the e↵ect on profits and sales was positive but statistically insignificant.
These average e↵ects, however, mask large di↵erences across participants. Owners in sectors with a low concentration of women (e.g., electronics, food pro-cessing) experience large and persistent improvements in well-being, and their profits and sales increase over time. Owners in female-dominated industries (e.g., handi-crafts, shops) experience only short-lived reductions in stress levels after receiving CBT, and the impact on profits and sales is null. Looking at the di↵erences in e↵ects of CBT on these two groups of businesswomen shows that less than a month after receiving CBT, owners in sectors with a low concentration of women had stress levels between 0.25 and 0.32 standard deviations lower than owners in female-dominated industries in the CBT group.
to a control mean of USD 407.76. The e↵ect immediately after the treatment was small and negative (USD 39.67 lower than the control group, which had sales of USD 395.27). I find no significant changes in owner working hours or the number of employees. This is consistent with the hypothesis that the treatment improves decision making and time management, and that skill formation takes time before translating into improved business outcomes.
Taken together, my findings suggest that teaching priority setting and stress-management techniques using CBT could help to improve well-being and firm out-comes for female owners in sectors with a low concentration of women. This is in line with previous studies showing that selection into less female-dominated industries proxies for personality traits and skills that a↵ect the returns to capital (De Mel et al. [2009a]). In my context, owners in women-dominated industries have more years of education and business experience, and implement better managerial prac-tices than others. In addition, they spend a similar amount of time doing household chores and caring for family members. These patterns suggest that industry choice reflects entrepreneurial abilities, such as opportunity recognition3, that are difficult
to measure but likely to explain why some owners - namely, those who can identify situations where applying new and existing skills can be valuable - benefit from training and others do not.
This paper is closely related to a growing body of literature studying the influence of soft skills (also called “non-cognitive” or “socio-emotional” skills) on labor market outcomes (Heckman and Corbin [2016]; Glewwe et al. [2013]; Heck-man and Kautz [2013]; HeckHeck-man and Kautz [2012]) and their malleability in adults (Kautz et al. [2014]). Promising evidence has emerged on the efficacy of CBT-based interventions to teach a wide range of socio-emotional skills - including self-control, e↵ective communication and decision making - and to increase the labor supply and productivity of di↵erent sub-populations in developing countries (Blattman et al. [2017]; Adhvaryu et al. [2016]). The present study is distinct in that it focuses on the importance of a narrow set of “entrepreneurial skills,” and its design allows me to identify the e↵ect of skill formation by minimizing social desirability bias4 and
3 Baron [2006] provides an overview of cognitive skills involved in the process of recognizing
business opportunities and mobilizing resources to seize them. See Calderon et al. [2015] and Gielnik et al. [2012] for recent evidence on the importance of opportunity recognition in developing countries.
4 The tendency of respondents to provide answers that are likely to be viewed favorably by the
Hawthorne e↵ects.
My results also add to a growing literature studying sources of heterogene-ity in the e↵ects of business programs. A recurrent finding is that small firms in developing countries di↵er in the obstacles they face, and, hence, standard business approaches often fail to benefit all (Fischer and Karlan [2015]; Bruhn et al. [2017]). Recent studies have found that the impact of providing training and access to fi-nance is moderated by the existence of social constraints. For example, Field et al. [2010] show that inviting women to attend business counseling with a female friend makes them more likely to borrow capital, and to expand their business, but the e↵ects are concentrated on those whose mobility is neither severely restricted nor completely unrestricted. Gine and Mansuri [2017] find that providing training and loans improve business outcomes only for women who own large firms, and who have enough bargaining power within their households to make most of the managerial decisions by themselves. My results suggest that industry choice is indicative of en-trepreneurial traits that are not captured by proxies for intra-household bargaining, such as time-use patterns among women.
The rest of the paper is organized as follows. Section 2 describes the concep-tual framework and the interventions. Section 3 provides details on the sample and experimental design. Section 3 explains the empirical strategy. Section 4 presents the main results. Section 5 discusses sources of heterogeneity in treatment e↵ects. Section 6 concludes.
1.2
The Stress Management Intervention
1.2.1 Conceptual Framework: Owner Stress and Firm Performance
and not having enough time to complete all tasks as important sources of stress.5
Nonetheless, these articles refer to firms in high-income economies. Evidence from low-income settings is limited.
Owners in developing countries are routinely confronted with complex situa-tions that escape their control. Arduous regulatory processes, inadequate access to finance, and the absence of high-quality infrastructure cause workflow disruptions, and demand time and attention (The Asia Foundation [2010]). The World Bank’s Doing Business initiative documents large di↵erences between countries in the time and e↵ort required to comply with relevant regulations at di↵erent stages of the business life cycle. For example, getting electricity takes four procedures and 79 days in the United Kingdom, and nine procedures and 428.9 days in Bangladesh. Similar patterns have been documented in other developing countries.
In addition, female business owners face social barriers that limit their ability to expand their firms, and these barriers can become a source of stress (Asian Devel-opment Bank [2015]). Among the most frequently cited is the behavioral prescrip-tion that women should spend a larger porprescrip-tion of the day than men doing household chores and caring for family members. It has also been documented that women face restrictions in their mobility and social interactions (Field et al. [2016]) that make selling products or purchasing inputs difficult (Gine and Mansuri [2017]).
Exposure to multiple stressful events makes individuals more likely to expe-rience symptoms of anxiety and depression, such as persistent negative thoughts, unpleasant physical sensations (including exhaustion, aches and muscular tension), and changes in sleep and appetite (Liu et al. [2017]; Sinha and Jastrebo↵ [2013]). These symptoms can be worsened by habits adopted by individuals, such as consum-ing ca↵einated drinks to tackle fatigue, or taking sleeping tablets to ease insomnia, which can a↵ect cognitive performance and mood (Lieberman et al. [2002]; Mitchell et al. [2012]).
The negative e↵ects on motivation and decision making of stress, a condi-tion characterized by high levels of anxiety and depressive mood, have been re-cently documented in the economics literature (De Quidt and Haushofer [2017]; Riis-Vestergaard et al. [2017]; Haushofer et al. [2015]). While most studies to date
5 To mention just two examples, Forbes published an article titled “Common Stresses and Reliefs
have focused on the health and cognitive e↵ects of financial worries among the poor, it is increasingly being recognized that stress can a↵ect economic outcomes in the general population and at levels that are not considered clinically significant. In particular, it has been shown that moderate levels of stress are positively correlated with performance, but chronically high stress levels deplete cognitive resources and have deleterious e↵ects on health and everyday functioning (Calvo and Gutierrez-Garcia [2016]; Schneiderman et al. [2005]).
Because of the high number of difficulties they face, female SME owners are at increased risk of experiencing stress. However, character and socio-emotional skills are malleable in adults, and they can be taught through mentoring-based interven-tions (Kautz et al. [2014]). Hence, I ask whether training in stress management can help them improve their health and professional performance, and, thereby, improve their productivity and their firms’ prospects over time. The intervention is expected to operate through two channels. The first is by helping participants identify crucial tasks through priority-setting exercises, and allocate an optimal amount of time to these tasks. The second is by teaching participants strategies to deal e↵ectively with symptoms of stress that may draw attention away from the task at hand.
1.2.2 The CBT and Empathic Listening Interventions
CBT is a psychological intervention that has been proven to be e↵ective in modifying a broad range of behaviors conducive to negative health outcomes, such as using hypnotic drugs to treat insomnia (Morgan et al. [2004]; Gonzalez and McCarl [2010]; Hofmann et al. [2012]; Weck et al. [2015]). Currently it is considered to be the best practice for treatment of anxiety-related disorders and depression. Evidence suggests that its e↵ects persist over time and can be detected six months, one year and even two years after treatment (DiMauro et al. [2013]). CBT is increasingly being used as a general skill-building approach outside of clinical settings because it has been shown to produce persistent reductions in anger, aggression, criminal activities, and sleep and eating disorders (see Butler et al. [2006] for a comprehensive review of applications).
et al. [2004]). For example, deep breathing is presented as a more positive way of reducing feelings of anxiety than prescription drugs, alcohol or smoking, which can have deleterious side e↵ects. Other hallmark techniques of CBT are schedul-ing a “worry time” each day, keepschedul-ing a written log of problems that come to mind while performing a task, and looking for solutions only during the pre-established worry time, instead of engaging in unplanned problem solving throughout the day (Saulsman et al. [2015]).
The skills learned during the sessions are meant to be immediately trans-ferrable to everyday life situations. Participants are told that mastering them re-quires regular practice, and that this is the mechanism through which the treatment e↵ect is expected to last following its termination. New habits are developed pri-marily through learning by doing, although informational handouts and exercises are provided, discussed and practiced during the sessions (Blattman et al. [2017]).
The program was designed jointly with the Department of Clinical Psy-chology of Dhaka University and received Insitutional Review Board (IRB) ap-proval from Innovations for Poverty Action and the University of Warwick. Both the CBT and EL interventions consisted of five individual, face-to-face, two-hour sessions. The sessions were delivered over a period of 10 weeks and took place in the Bangladesh Women Chamber of Commerce and Industry’s training center (BWCCI), in central Dhaka. Six clinical psychologists trained in Cognitive Behav-ioral Therapy and six counselors trained in Empathic Listening delivered the CBT and EL interventions, respectively.
Participants in the CBT group received short follow-up phone calls between sessions in order to o↵er additional coaching, and to ensure adherence to the inter-vention protocol. These calls lasted between five and 10 minutes. The interinter-vention featured strategies to manage time efficiently, and to deal with thoughts and physical sensations that could draw attention away from the task at hand. The time manage-ment component teaches participants to prioritize activities that are important and urgent, and to delegate or postpone those that require immediate attention but are not important. The second component tries to minimize symptoms of stress (anxiety and depression) that result in divided attention by teaching attention training and relaxation techniques, including progressive muscle relaxation and deep breathing.
to Bangla from templates published by the Centre for Clinical Interventions and the National Health Service (NHS). (These are publicly available on their websites.) For internal monitoring purposes, we collected a small sample of handouts from participants at the end of the program.
Following the Ethical Framework for Good Practice of Counseling and Psy-chotherapy of the British Association for Counseling and PsyPsy-chotherapy (BACP (2013)), we hired an external clinical supervisor to take charge of the oversight of the intervention, and to ensure that the therapists adhered to the clinical protocol and the BACP Ethical Framework. The clinical supervisor evaluated the thera-pists’ conduct, and determined whether they needed further training. In addition, he performed patients’ risk assessments, and undertook caseload risk management6. Weekly supervision meetings were held with the CBT therapists to discuss progress, the participants’ responsiveness to exercises, and any difficulties encountered during the sessions.
The EL intervention provided an equal number of therapy sessions. This type of non-directive counseling consists of listening and repeating the situations and feelings shared by the patient in di↵erent words, both factual and emotional, without providing an interpretation, explanations or suggesting techniques to help the client make a decision (Rautalinko et al. [2007]). Participants in the EL group received handouts with general health information. The topics included a diet pyramid displaying types of food that should be consumed several times per week (such as fruits and vegetables) and those that should be limited to once or twice per week (e.g., processed meats and desserts), in addition to press articles on the potential health and mood benefits of developing new hobbies.
Due to financial constraints, it was not feasible to have both an active control and a pure control group. An active control group was preferred because receiving professional counseling could a↵ect response rates, and introduce both recall bias and social desirability bias in the answers. Thus, EL was designed to provide emo-tional support but no specific guidance, with a view to identifying the e↵ect of teaching skills. Providing a small dose of treatment to a comparison group, rather than using a pure control, has the additional advantage of decreasing the risk of dif-ferential attrition between treatment and control groups. Indeed, “light-treatment”
6 The clinical supervisor is a clinical psychologist (BSc Psychology, MSc and MPhil in Clinical
comparison groups have been used in recent evaluations of business programs in the economics literature (Bloom et al. [2013]; Field et al. [2016]).
Both the CBT and EL interventions provided social support and were there-fore expected to have positive e↵ects on well-being in the short run. Recent clinical studies assessing the efficacy of CBT have used active control groups based on EL (Stain et al. [2016]; Kahn et al. [2017]). This design allows me to ascertain whether the e↵ect of teaching coping skills is distinguishable from that of o↵ering a non-judgmental environment to discuss problems and express emotions.
1.3
The Sample and Experimental Design
1.3.1 Target Population and Recruitment
To gain access to a large network of female business owners, I partnered with the Bangladesh Women Chamber of Commerce and Industry. The BWCCI is a non-profit organization established in 2001 to provide training and access to support services to women-owned SMEs.
The Chamber disseminated information about the program among its mem-bers. A sta↵ member contacted them by phone and email, and explained that the purpose of the study was to understand whether training in stress management could increase the well-being levels of businesswomen in the country. After schedul-ing all sessions, the Chamber sent reminders to reduce program dropout and survey attrition. The intervention took place between December 2016 and March 2017. All participants received a travel allowance of a maximum of 400 Bangladeshi Taka (BDT) (equivalent at the time to USD 4.90) and BDT 200 (USD 2.40) per sur-vey round, to compensate them for their time. No other payments were made to encourage participation.
Among those selecting a given slot, half were randomly assigned to CBT, and the other half to EL. Hence, I do not have any reason to believe that the treatment-allocation strategy caused non-random di↵erences in characteristics between CBT and EL recipients. In total, 159 participants were o↵ered CBT, and 151 were o↵ered EL.
1.3.2 Data and Randomization Balance
The baseline survey was conducted on the first day of training, before the session started. Two follow-up surveys were conducted over the phone. The first took place immediately after the training was completed. Some participants were able to attend all sessions within 10 weeks, and finished the training in February. Others requested to reschedule one or more sessions, and received the last one in March. Therefore, the first follow-up survey was conducted between February and March 2017. The second was conducted six months after completion, between July and August 2017. Attrition rates were low and similar across groups. The group of participants who either refused to take part in a survey or who could not be reached consisted of four EL and five CBT participants in the first follow-up survey, and 14 EL and 16 CBT participants in the second survey. These rates are equivalent to approximately 2 percent and 9 percent of the sample in each group, for the first and second follow-up surveys respectively.
Basic business information was collected in each survey round, including profits, sales and inventories in the previous month, daily hours worked by the owner on average and the number of formal and casual employees. We also measured self-reported symptoms of anxiety and depression using the seven-item Generalized Anxiety Disorder (GAD-7) scale and the nine-item Patient Health Questionnaire (PHQ-9), and the number days lost to physical illness in the two weeks prior to the survey.
McKenzie and Woodru↵[2017] for small firms.
I construct a Stress Index by standardizing the unweighted sum of the GAD-7 anxiety score (Spitzer et al. [2006]) and the PHQ-9 depression score ((Kroenke et al. [2010] using the control group mean and standard deviation. These scales have been extensively used to measure stress and monitor symptoms of anxiety and depression by mental health practitioners across the world, and have shown good levels of reliability and validity (Moriarty et al. [2015]; L¨owe et al. [2008]; Spitzer et al. [2006]; Kroenke et al. [2010]). Aggregating variables that are conceptually related and move in the same direction into standardized indices has become common practice in the economics literature, because it helps to address concerns over multiple hypothesis testing (Kling et al. [2007]; Karlan and Valdivia [2011]; Drexler et al. [2014]).
Stress levels, profits and sales have long right tails, even after winsorizing the last two at the 99th percentile. To reduce the influence of observations on the top tail, I compare the e↵ects of CBT on the stress index, profits and sales in levels and the inverse hyperbolic sine transformation of each of these variables.
In addition, more detailed owner and firm characteristics were measured at the baseline and second follow-up surveys. 24-hour recall time use questionnaires were included in both surveys7, but they were modified to capture di↵erent
dimen-sions. The baseline time use survey followed the same structure as the Bangladesh (2012) Time Use Survey Pilot and recorded every primary and secondary activity performed in the 24 hours prior to the survey, and the time spent on each of them. The purpose of using this questionnaire was to obtain a first estimate of the number of hours spent daily on household chores, providing unpaid care services to family members, engaging in a wide range of self-care, entertainment and social activities, and working in the business. The time use section used in the second follow-up survey was a modified version of the Executive Time Use Project questionnaire (Bandiera et al. [2012]), and focused on measuring the amount of time spent on managerial and non-managerial activities during working hours.
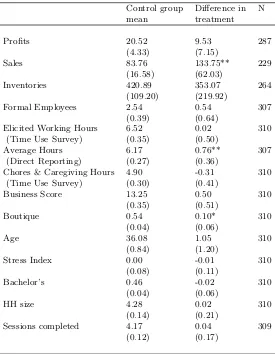
Table 1 shows baseline characteristics and balance across treatment and
7 The use of 24-hour recall methods has limitations, because it might not be representative of an
average day (see Jackson et al. [2008]). I chose it over the more accurate 72-hour recall method for convenience. In my setting, participants were reluctant to answer long questionnaires, and
hence, there was a trade-o↵ between precision and survey attrition. Despite its arguable
active control individuals. It reports regressions of each variable on a treatment dummy, whose coefficient captures the di↵erence between group means, and a con-stant (the control group mean). For most variables, including stress levels and profits, di↵erences in the mean value across experimental groups are not signifi-cant. Average monthly profits are winsorized at the 99th percentile to trim outliers, yielding an average of BDT 18,780 (USD 229) in the control group.
Despite randomization, the treatment group has a higher number of firms in sectors with a high concentration of women (clothing and handicrafts) and higher sales. Owners in the CBT group also report working longer hours (0.76 additional hours per day). However, when using the time use survey to calculate the number of hours worked in the 24 hours prior to the survey, the number of hours members of the two di↵erent groups spent working on the business and doing household chores does not di↵er to a statistically significant degree.
The Stress Index and several measures of managerial ability are balanced. The mean age among owners in the control group is 36 years, and the average household size is 4.28. Only 7 percent of firm owners did not complete class V, which was the last year of primary school until 2016, when a reform to extend primary school until class VIII was approved. Approximately 70 percent of the owners are married, and 46 percent have a bachelor’s degree.
The average number of sessions completed is also balanced across groups. Around 13 percent attended one session only (18 participants in the EL and 22 in the CBT group), and around 74 percent of the EL participants and 77 percent of the CBT participants attended all the sessions.
1.4
E
↵
ects on Stress and Firm Outcomes
1.4.1 Empirical Specification
of the form
Yit= 0+ 1CBTi+ 2Yi,t=0+ 3Xh,i+⌧t+✏it (1.1)
whereYit is an outcome for firm iin period t, CBTi is the treatment dummy and
takes value 1 if the owner was assigned to CBT and 1is the treatment e↵ect. Yi,t=0
is the lagged outcome variable,Xh,i controls for baseline covariates (firm years, the number of workers and a sector dummy, demeaned using the control group mean), and ⌧t is a survey round fixed e↵ect. In my sample, 10 owners run more than one type of business. Hence, standard errors are clustered at the owner level for the specification combining the two rounds of data. Because not everyone who was invited and attended the first session completed the training, these are intent-to-treat estimates.
Participants in my sample had many opportunities to make up for missed ses-sions. Therefore I expect that failing to attend even one session can a↵ect treatment outcomes, in part because it might indicate low engagement and poor adherence to the CBT protocol. A recent meta-analysis of clinical evaluations showed that in-terventions that require treatment completion have larger ITT e↵ects on therapy outcomes than those in which completion is not required (Hans and Hiller [2013]). For this reason, I also estimate treatment e↵ects on the treated (TOT) by creating a dummy for those who attended all five sessions and running the following regression Yit= 0+ 1CBT completei+ 2Yi,t=0+ 3Xh,i+⌧t+✏it (1.2) where CBT completei,t=1 takes the value 1 if an owner assigned to CBT attended
all five sessions. I instrumentCBT completei,t=1 with the variable CBTi.
1.4.2 CBT Impact on Stress Levels
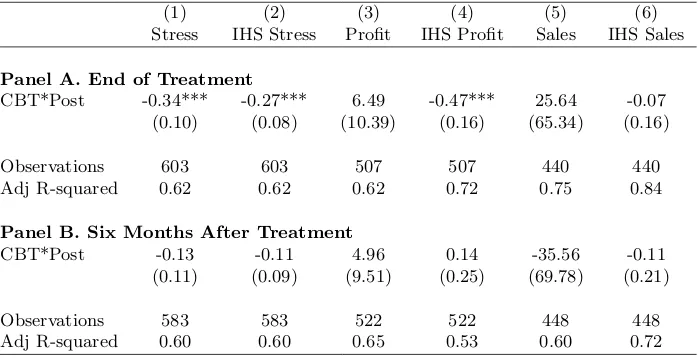
Immediately after finishing the treatment, the e↵ect is large and significant for all owners (Table 2, columns 1 and 2). CBT leads to a reduction of 0.33 standard deviations in the aggregate index of stress symptoms. The e↵ect of CBT on the hyperbolic sine transformation of the index is also large and significant. Since this transformation places less weight on observations at the upper tail of the distribu-tion, these results suggest that the CBT does not only benefit those with very high levels of stress before the program starts.
who attended at least four sessions (around 80 percent) with those who attended three or less, and the results remain qualitatively unchanged. The point estimates are smaller but significant at the 1 percent level.
Six months after the treatment, the e↵ect of CBT on stress is no longer sig-nificantly di↵erent from zero, although it enters with a negative sign. The coefficient is minus 0.12 for stress index. Likewise, the e↵ect among those who completed the program is negative but insignificant.
Figure 1 shows changes in the distribution of stress levels over time for owners in the CBT and EL groups. The evidence does not reject the hypothesis of equality of distribution in initial stress levels between the CBT and EL groups (Graph (a)). Graphs (b) and (c) show a shift to the left in the distribution of stress for owners in the CBT group compared to the EL group. However, the Kolmogorov-Smirnov test only rejects the hypothesis of equality of distributions immediately after treatment (Graph (b)), at the 5 percent level.
1.4.3 CBT Impact on Profits and Sales
I first examine whether the large reduction in stress levels observed immediately after the intervention a↵ected profits and sales. Table 3 reports intent-to-treat estimates for winsorized profits in levels and the inverse-hyperbolic sine transformation of non-winsorized profits. Immediately after the program, the point estimate for profits in levels is BDT 4,980 (USD 60.33) and statistically insignificant. This is relative to a control mean of BDT 33,610 (USD 404.21). The coefficient in the regression using the hyperbolic sine transformation of profits is negative but also insignificant. The coefficient of the treatment dummy in the regression for sales in levels indicates an e↵ect close to zero (BDT 12, less than USD 0.15), while that in the regression using the hyperbolic sine transformation of sales is small but positive. These results suggest that the average e↵ect of CBT is measured with noise, and the e↵ect might be di↵erent for firms at the top and bottom of the distributions of sales and profits.
a mean of BDT 139,770 BDT (USD 1,693.16) in the control group.
Combining the two rounds of data increases power, but all e↵ects remain statistically insignificant. Overall, these results suggest that the positive e↵ects of receiving CBT might be increasing over time for some owners, but are estimated with noise. All TOT coefficients follow a similar pattern to those of the ITT regressions, and are only marginally larger in size.
I next examine the treatment e↵ects on the distribution of profits. Consistent with the results from the regression analysis, Figure 2 shows a slight shift towards the right in the distribution of profits between the first and second follow-up surveys.
Average profits were similar between treatment groups at the time of the baseline. Figure 2 shows that the distribution of the hyperbolic sine transformation of profits had a higher standard deviation in the EL group before the treatment started, but looked similar to that of the CBT group after the treatment ended. My data suggest that, conditional on taking part in the survey, participants provided more accurate answers during the first and second endlines compared to the baseline. No one reported negative profits at the time of the baseline, but some did in the second endline. This could be because we asked them in advance to suggest a time to complete the survey, and they were better prepared to answer our questions (which they knew from previous rounds); or because the intervention helped to build rapport, and they reported more truthfully.
To rule out the possibility that the CBT and EL groups di↵ered in their tendency to trust us with information on profits, and that this may be driving my results, I use two approaches that correct for imbalances in covariates and di↵erences in the probability to be assigned to each treatment group (section 4.5). I find no support for the hypothesis that my results are sensitive to di↵erences in the distribution of baseline profits.
1.4.4 E↵ects on Inputs
(between eight or nine observations, or around three percent in each survey round) which have values above BDT 5,000,000 (USD 60,587.85), fluctuate across rounds, and are not trimmed after winsorizing. Columns 2 and 6 suggest that the treatment had a small, negative and statistically insignificant e↵ect on inventories.
The impact of CBT on the number of working hours and the number of formal employees is not significantly di↵erent from zero. Columns 3 and 4 in Table 4 show that the point estimates are positive in the first follow-up but small in size (0.12 hours and 0.03 workers). Columns 7 and 8 show negative point estimates at the time of the second follow-up (minus 0.15 hours and minus 0.18 workers respectively). The e↵ect of CBT on those who attended all five sessions is similar in sign and magnitude for most of these inputs, with the exception of the sine transformation of inventories, which is negative and significant when combining the two rounds of data.
In addition, I find suggestive evidence that the CBT training did not a↵ect the amount of time allocated to managerial on non-managerial tasks. Using cross-sectional data from the second follow-up, I study changes in time use patterns six months after the treatment by aggregating activities into four categories. The first is essential daily functions that could be delegated to employees, such as providing aesthetic services (facials and haircuts) or selling clothes to customers directly. The second is human resources management, and includes training employees and su-pervising them while they are attending to customers or keeping records. The third is strategic planning and includes tasks as varied as revising the business plan or checking sales and profits. The fourth aggregates all other activities, including at-tending business fairs or training programs. I find no di↵erences between owners in the treatment and control groups in the amount of time they spend in each activity type.
1.4.5 Robustness to Baseline Imbalance
To investigate whether the observed di↵erences in baseline characteristics between the CBT and EL group are driving the results, I compare them with those obtained using alternative matched control groups. I find no evidence that di↵erences in baseline characteristics are driving the main results (Appendix, Table A1).
method has recently been used to address baseline imbalances in the evaluation of a business consulting program (Bruhn et al. [2017]). Table A1 shows similar results to those reported in tables 2 and 3. CBT leads to a 0.35 reduction (significant at the 1 percent level) in the stress index immediately after treatment. The e↵ect disappears within six months. The impact on profits in levels is positive and increases from BDT 10,200 (USD 122.67) in immediately post-treatment to BDT 18,100 (USD 217.68) six months later, with respect to a control group mean of BDT 33,600 (USD 404.09) and BDT 32,600 (USD 392.07) in the first and second follow-up surveys respectively.
Secondly, I use randomization inference, which can be employed to test for the sharp null hypothesis of no treatment e↵ect even if the probability of being assigned to the treatment group is not the same for all units (Imbens and Wooldridge [2009]). I follow Hennessy et al. [2016] and use a conditional randomization test to account for covariate imbalance. The results are shown in Table 9 (Appendix A.1). The estimated e↵ect of CBT on stress and profits remains qualitatively unchanged when using randomization inference. The estimated e↵ect of CBT on sales becomes negative but is measured with noise, and hence the treatment e↵ect coefficient is not statistically significantly di↵erent from zero.
1.5
Heterogeneity Analysis: Who Benefits from
Learn-ing Stress Management Techniques?
To understand the mechanisms through which CBT is likely to operate and why its e↵ect on mental health decreases sharply within six months, I examine whether its impact varies across owners. For this, I focus on the most important sources of heterogeneity documented in the business training literature.
1.5.1 Di↵erences in Treatment E↵ects Across Sectors
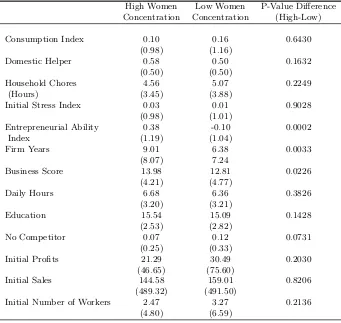
A leading explanation for heterogeneity in the e↵ects of business programs among women is self-selection into a female-dominated industry (De Mel et al. [2009a]). In my sample, nearly 58 percent of the firms are boutiques and handicrafts shops, with some selling both clothes and handicrafts. The rest of the firms are scattered across various sectors, including electronics, food processing and education. I aggregate boutiques and handicrafts shops into a single category (hereafter, I refer to all of them as “boutiques”), which indicates that the owner operates a firm in an industry with a high concentration of women. All others are pooled into a category represent-ing industries with a low concentration of women. Although data on male- to-female ratios in firm ownership at the sub-sector level (within retail or services) are limited, this division has been documented in previous reports on female entrepreneurship in Bangladesh (Shamim [2008]).
First, I document di↵erences in firm and owner characteristics between in-dustries (Table 5). It is important to note that, by many measures, women in female-concentrated sectors have better managerial skills. They have been in busi-ness three more years, on average, and they implement more managerial practices (both di↵erences are significant at the 1 percent level). In addition, their educational attainment and the number of hours devoted to their businesses are slightly higher. I aggregate the four measures into a standardized index of managerial ability, and con-firm that the new variable is, on average, higher for owners in female-concentrated sectors at the 1 percent level.
e↵ects across industries, I follow (De Mel et al. [2009a] and use a regression of the form
Yit = 0+ 1CBTi+ 2CBTi⇤LowF emalei+ H
X
h=1
3CBTi⇤Xh,i
+ H
X
h=1
4CBTi⇤Xh,i⇤LowF emalei+ H
X
h=1
5Xh,i⇤LowF emalei
+ 6LowF emalei+ 7Yi,t=0+✏it
(1.3)
where Yit is an outcome (e.g. stress index, profits or sales) for owner i
in period t, CBTi is the treatment dummy, LowF emale1 takes value one if the
owner operates in an industry with a low concentration of women, Xh,i controls for entrepreneurial ability (standardized index of business practices, education, firm years and daily working hours) and household liquidity8. Yi,t=0 is the baseline
outcome variable. Robust standard errors are estimated. To address concerns over multiple hypothesis testing and sample splitting, I report Sidak-adjusted p-values (Table A.4).
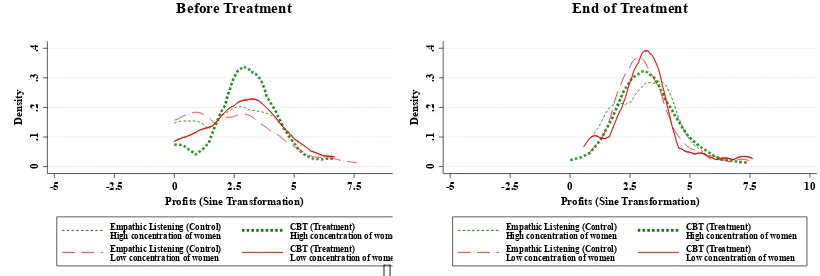
Tables 6 and 7 show that self-selection into a sector with a high concen-tration of female-owned businesses is strongly correlated with treatment e↵ects. After receiving CBT, owners in less female-dominated industries have lower stress levels, relative to their EL counterparts and to those in the CBT group who oper-ate in female-dominoper-ated sectors. In addition, their profits and sales increase over time when compared to those two groups. Table 6 shows that, immediately after the treatment, the stress index is between 0.25 and 0.32 standard deviations lower than for those who received CBT but own a boutique. Six months after the end of the intervention, the impact of CBT on stress levels remains large and statis-tically significant for owners in low-female-concentration sectors. The stress index is between 0.46 and 0.48 standard deviations lower than that for boutique owners in the CBT group (Table 6, column 3). The p-value of the sum of the treatment and the interaction e↵ect is also significant, indicating that owners of firms in non-female-concentrated sectors have statistically significantly lower stress levels than the average owner in the EL group. The di↵erence is approximately 0.4 standard deviations six months after treatment.
Table 7 shows that, immediately after the treatment ends, the e↵ect of CBT
8 The index is the sum of monthly expenditures in food, electricity, gas, water, mobile phone
on profits and sales is not significantly di↵erent for owners in di↵erent sectors. The interaction of the treatment and low-female-concentration dummies enters most specifications with a negative sign, but standard errors are large. Six months af-ter the treatment, profits are between BDT 20,000 (USD 240.53) and BDT 22,620 (USD 272.04) higher for owners in the CBT group who operate in a sector with a low concentration of women, relative to boutique owners in the CBT group (Table 7, column 5). The average e↵ect of CBT on profits for non-boutique owners ranges from BDT 14,860 and BDT 18,600, an increase of between USD 180.01 and USD 225.31 with respect to their baseline levels of USD 440.89. The sum of the CBT treatment and the interaction of the treatment and the low female concentration dummies is significant for the sine transformation at the 10 percent level (column 6) in most specifications. The point estimates are also positive but non-significant for sales, with sizes ranging from BDT 61,990 (USD 745.53) to BDT 116,710 (USD 1,403.63) with respect to owners in the CBT group operating in a female-dominated sector.
I find no di↵erential treatment e↵ects on any source of change in profits be-tween industries (Table 8). Immediately after the program ends, CBT has a negative e↵ect on inventories on average, but owners in low-female-concentration industries have higher inventories after receiving CBT than their control group counterparts (columns 1 and 2). The negative e↵ect of CBT on inventories for the average owner increases in magnitude over time (columns 5 and 6), but owners in sectors with a low concentration of women have higher values of inventories than their EL counter-parts and other owners in the CBT group. The sum of the treatment dummy and the interaction of the treatment and industry type is not significantly di↵erent from zero. Reducing inventories is generally considered a best practice in manufacturing settings, and is a key dimension of the “lean production” system (see, for example, Bloom et al. [2010]). However, I do not have information to confirm that reducing inventories is the optimal decision for all firms in my predominantly retail context. I find no di↵erences in treatment e↵ects on other inputs. The impact on the number of hours worked or the number of employees between sectors is close to zero.
previous studies have documented in other low-income settings (Gine and Mansuri [2017]).
An alternative mechanism could be that, by encouraging participants to think about the payo↵s of spending time on competing personal and professional activities, the CBT treatment prompted some participants to adjust their business-related e↵orts downwards. This might be the optimal decision for those who perceive their returns to investing in personal and social networks to be higher than the return to investing in their business. However, this is not borne out by the data on time-use patterns. Women in di↵erent industries spend similar amounts of time on business and household production activities.
1.5.2 Alternative Mechanisms
In this section I examine mechanisms that could explain the observed heterogeneity in the e↵ects of CBT and have received little attention by economists. I focus on factors that have been identified as key drivers of therapy success and firm outcomes in the clinical psychology and management science literatures respectively.
Traits A↵ecting Therapy Outcomes
Despite strong evidence of efficacy of CBT for improving mental health outcomes, some people do not fully respond to treatment (Flynn [2011]). Most clinical studies suggest that treatment success depends primarily on certain personality traits and non-cognitive skills that are difficult to measure, such as the client’s capacity to identify and share thoughts and feelings (Renaud et al. [2014]). It is then plausible that CBT works best for individuals who have high levels of self-awareness and self-discipline because these make it easier for them to engage in the therapy and comply with homework assignments. As a proxy for these variables, I use data on educational achievement. Having a bachelor’s degree indicates that the individual has the ability to process abstract information. In addition, holding a university degree is an indicator of self-discipline, for this trait has been shown to outperform IQ in predicting academic achievement (Duckworth and Seligman [2005]).
do not have a university degree. I find no evidence that those with higher education benefit more from CBT in terms of improved mental health (Online Appendix). The coefficient associated with the interaction of being assigned to CBT and having a Bachelor’s degree is not statistically di↵erent from zero, and it enters with a positive sign in all specifications for stress. Furthermore, the interaction term enters with a negative sign in many of the regressions for profits and sales, although it is never significant. Similarly, it has no e↵ect on any inputs.
Compliance with treatment, as measured by the level of completion of home-work assignments, has also been shown to predict therapy outcomes (Mausbach et al. [2010]; LeBeau et al. [2013]). The CBT intervention for this study was de-signed to encourage compliance through follow-up phone calls. In addition, a high percentage of participants attended all five sessions, which is likely to be an indi-cator of engagement and motivation. This is because of the high time and e↵ort costs associated with travel within central Dhaka, where the sessions took place. However, my TOT estimates suggest that completion does not make owners more likely to benefit from CBT six months after the treatment. Neither does completion of treatment significantly increase profits, sales or any intermediate outcomes, such as inventories, time-use patterns, or the number of employees.
Entrepreneurial Traits and Success in Developing Countries
Skills gaps are among the most important constraints to firm growth in developing countries (Bruhn et al. [2017]). However, specific skills deficits and training needs vary across firms (Fischer and Karlan [2015]). In my context, a possible explanation for the observed heterogeneity is that owners in female-dominated industries lack essential entrepreneurial skills that impede the CBT treatment from having an e↵ect on mental health and profits.
at-titude, the question becomes whether owners in female-dominated sectors (who, in my setting, have better managerial skills than the others) are unable to turn new skills into increased profits because they do not grasp when and how to apply them.
Testing this mechanism is challenging in practice. Multiple cognitive and non-cognitive abilities are involved in the process of finding and exploiting oppor-tunities. Moreover, there is, to date, no consensus on which specific traits, skills, alone or in combination, are necessary for owners to benefit from training and cap-ital, or to succeed in absence of support. For example, Bhagavatula et al. [2010] provide a comprehensive list of human and social capital dimensions correlated with entrepreneurial success in India, while Gielnik et al. [2012] focus on the role of cre-ativity in explaining new venture success in Uganda. Furthermore, recent evidence from Mexico shows that female SME owners who enter self-employment driven by opportunity, as opposed to necessity, run more profitable firms. However, there is a large overlap in personality traits between “necessity” and “opportunity” en-trepreneurs, including self-control, imagination, attitudes towards risk and the big five (Calderon et al. [2015]).
1.6
Conclusion
This paper investigates the e↵ects of using Cognitive Behavioral Therapy (CBT) to teach stress-management skills to female business owners in Bangladesh. The intervention o↵ered CBT, featuring priority setting and relaxation techniques, to one group of business owners and Empathic Listening (EL), which provides emotional support but no specific guidance on how to develop new skills, to the other group. I compare the impact of CBT and EL on owner stress levels, and firms’ profits and sales.
(58 percent of my sample), the reduction in stress levels is short lived - the e↵ect almost disappears after six months - and the impact on sales and profits is close to zero.
Despite compelling evidence that high-ability owners in developing countries are more likely to benefit from training (Gine and Mansuri [2017]), I find no support for this hypothesis in my setting. Owners in female-dominated industries have slightly higher levels of education than owners in other sectors, their firms are three years older on average and their managerial practices are better.
My results support the hypotheses that non-cognitive skills are malleable and can be taught to adults (Kautz et al. [2014]), and that nudging small business owners to devote more attention to long-term goals and less to day-to-day operations can foster firm growth in many industries (Bruhn et al. [2017]). In my context, the e↵ects are concentrated on women who run firms in sectors with a lower concentration of women. This is in line with previous studies showing that self-selection into female-dominated industries is indicative of traits that moderate the returns to capital (De Mel et al. [2009a]).
Table 1.1: Baseline Balance
Control group Di↵erence in N
mean treatment
Profits 20.52 9.53 287
(4.33) (7.15)
Sales 83.76 133.75** 229
(16.58) (62.03)
Inventories 420.89 353.07 264
(109.20) (219.92)
Formal Employees 2.54 0.54 307
(0.39) (0.64)
Elicited Working Hours 6.52 0.02 310
(Time Use Survey) (0.35) (0.50)
Average Hours 6.17 0.76** 307
(Direct Reporting) (0.27) (0.36)
Chores & Caregiving Hours 4.90 -0.31 310
(Time Use Survey) (0.30) (0.41)
Business Score 13.25 0.50 310
(0.35) (0.51)
Boutique 0.54 0.10* 310
(0.04) (0.06)
Age 36.08 1.05 310
(0.84) (1.20)
Stress Index 0.00 -0.01 310
(0.08) (0.11)
Bachelor’s 0.46 -0.02 310
(0.04) (0.06)
HH size 4.28 0.02 310
(0.14) (0.21)
Sessions completed 4.17 0.04 309
(0.12) (0.17)
Notes: Table reports a regression of the named variable on a constant
and treatment dummy. The coefficients in column 2 are the control
group mean, and those in column 3 report the di↵erence with respect
to the treatment group. Robust standard errors in parenthesis. Profits and sales are winsorized at the 99th percentile to trim outliers. Without winsorizing, profits and inventories remain statistically balanced between treatment and control groups, and sales are imbalanced at the five per-cent level. Profits, sales and inventories are expressed in thousands of
Bangladeshi Taka (1,000 BDT⇡10 GBP). The Business Score is the
num-ber of good business practices implemented by the owner and takes values from 0 to 26. The Stress Index is the standardized sum of symptoms of anxiety and depression, using the control group mean and standard de-viation. The 7-item scale for Generalized Anxiety Disorders (GAD-7) and the 9-item scale Patient Health Questionnaire (PHQ-9) were used to measure symptoms of anxiety and depression, respectively. The final
rows report session attendance. Significance: *** p<0.01, ** p<0.05, *
Figure 1.1: Kernel Density of Standardized Index of Stress Symptoms
0
.1
.2
.3
.4
.5
D
en
si
ty
-2 -1 0 1 2 3
Aggregate Index of Symptoms of Stress
Empathic Listening (Control) CBT (Treatment) Before Treatment
0
.1
.2
.3
.4
.5
D
en
si
ty
-2 -1 0 1 2 3
Aggregate Index of Symptoms of Stress
Empathic Listening (Control) CBT (Treatment)
End of Treatment
0
.1
.2
.3
.4
.5
D
en
si
ty
-2 -1 0 1 2 3
Aggregate Index of Symptoms of Stress
Empathic Listening (Control) CBT (Treatment)
Six Months After Treatment
Notes: Figure shows the distribution of stress levels before the intervention, immediately after and six months later. The Stress Index is the standardized sum of symptoms of anxiety and
depression, using the control group mean and standard deviation. The 7-item scale for Generalized Anxiety Disorders (GAD-7) and the 9-item scale Patient Health Questionnaire
(PHQ-9) were used to measure symptoms of anxiety and depression, respectively. The Kolmogorov-Smirnov test does not reject the null hypothesis of equality of distributions in (a)
Table 1.2: Impact of Training on the Stress Index
End of Treatment 6 Months After End
(1) (2) (3) (4)
Stress Index IHS Stress Stress Index IHS Stress
ITT -0.33*** -0.26*** -0.12 -0.11
(0.09) (0.08) (0.10) (0.08)
Adj R-squared 0.31 0.32 0.26 0.26
TOT -0.44*** -0.35*** -0.16 -0.15
(0.12) (0.10) (0.13) (0.11)
First stage F-stat 419.80 419.90 395.05 395.36
Control Mean 0.00 -0.03 0.15 0.11
Observations 297 297 277 277
Figure 1.2: Kernel Density of Monthly Profits (Hyperbolic Sine Transformation)
[]
0
.1
.2
.3
.4
D
en
si
ty
-5 -2.5 0 2.5 5 7.5 10
Profits (Sine Transformation)
Empathic Listening (Control) CBT (Treatment)
Before Treatment
[]
0
.1
.2
.3
.4
D
en
si
ty
-5 -2.5 0 2.5 5 7.5 10
Profits (Sine Transformation)
Empathic Listening (Control) CBT (Treatment)
End of Treatment
[]
0
.1
.2
.3
.4
D
en
si
ty
-5 -2.5 0 2.5 5 7.5 10
Profits (Sine Transformation)
Empathic Listening (Control) CBT (Treatment)
Six Months After Treatment
Table 1.5: Di↵erences in Firm and Owner Characteristics by Industry
High Women Low Women P-Value Di↵erence
Concentration Concentration (High-Low)
Consumption Index 0.10 0.16 0.6430
(0.98) (1.16)
Domestic Helper 0.58 0.50 0.1632
(0.50) (0.50)
Household Chores 4.56 5.07 0.2249
(Hours) (3.45) (3.88)
Initial Stress Index 0.03 0.01 0.9028
(0.98) (1.01)
Entrepreneurial Ability 0.38 -0.10 0.0002
Index (1.19) (1.04)
Firm Years 9.01 6.38 0.0033
(8.07) 7.24
Business Score 13.98 12.81 0.0226
(4.21) (4.77)
Daily Hours 6.68 6.36 0.3826
(3.20) (3.21)
Education 15.54 15.09 0.1428
(2.53) (2.82)
No Competitor 0.07 0.12 0.0731
(0.25) (0.33)
Initial Profits 21.29 30.49 0.2030
(46.65) (75.60)
Initial Sales 144.58 159.01 0.8206
(489.32) (491.50)
Initial Number of Workers 2.47 3.27 0.2136
(4.80) (6.59)
Figure 1.3: Kernel Density of Standardized Index of Stress Symptoms. Heteroge-neous Treatment E↵ects by Industry
[]
0
.1
.2
.3
.4
.5
D
en
si
ty
-2 -1 0 1 2 3
Aggregate Index of Symptoms of Stress
Empathic Listening (Control)
High concentration of women CBT (Treatment)High concentration of women Empathic Listening (Control)
Low concentration of women CBT (Treatment)Low concentration of women
Before Treatment
[]
0
.1
.2
.3
.4
.5
D
en
si
ty
-2 -1 0 1 2 3
Aggregate Index of Symptoms of Stress
Empathic Listening (Control)
High concentration of women CBT (Treatment)High concentration of women Empathic Listening (Control)
Low concentration of women CBT (Treatment)Low concentration of women End of Treatment
[]
0
.1
.2
.3
.4
.5
D
en
si
ty
-2 -1 0 1 2 3
Aggregate Index of Symptoms of Stress
Empathic Listening (Control)
High concentration of women CBT (Treatment)High concentration of women Empathic Listening (Control)
Low concentration of women CBT (Treatment)Low concentration of women Six Months After Treatment
Notes: Figure shows the distribution of stress levels before the intervention, immediately after and six months later. The Stress Index is the standardized sum of symptoms of anxiety and
depression, using the control group mean and standard deviation. The 7-item scale for Generalized Anxiety Disorders (GAD-7) and the 9-item scale Patient Health Questionnaire (PHQ-9) were used to measure symptoms of anxiety and depression, respectively. In figure (a),
the Kolmogorov-Smirnov test does not reject equality of distribution of any of the pairwise distributions; in figure (b) the test rejects the hypothesis of equality of distribution between treatment and control group for owners in sectors with a low concentration of women (at the 10 % level), but not for owners in female-dominated sectors. When studying pairwise di↵erences within
each experimental group, the test does not reject the hypothesis of equality of distribution by sector (high versus low concentration of women) for owners in either experimental group. In figure
Table 1.6: Heterogeneous E↵ects on Stress by Industry
End of Treatment 6 Months After End
(1) (2) (3) (4)
Stress IHS Stress Stress IHS Stress
Panel A. Controlling for treatment heterogeneity with: entrepreneurial ability
CBT* Low Female Concentration -0.30 -0.25 -0.48** -0.35**
(0.19) (0.16) (0.20) (0.16)
CBT -0.18 -0.14 0.08 0.03
(0.13) (0.10) (0.13) (0.10)
LowFem 0.17 0.15 0.25* 0.18
(0.14) (0.11) (0.14) (0.11)
CBT*LowCon+CBT -0.48*** -0.39*** -0.40*** -0.32***
P-value: CBT*LowCon+CBT 0.001 0.001 0.01 0.012
Panel B. Controlling for treatment heterogeneity with: household liquidity
CBT* Low Female Concentration -0.25 -0.20 -0.46** -0.33**
(0.19) (0.15) (0.19) (0.16)
CBT -0.23** -0.18* 0.07 0.02
(0.12) (0.10) (0.12) (0.10)
LowFem 0.19 0.16 0.25* 0.18
(0.14) (0.11) (0.14) (0.11)
CBT*LowCon+CBT -0.48*** -0.38*** -0.39*** -0.30***
P-value: CBT*LowCon+CBT 0.001 0.002 0.009 0.014
Panel C. Controlling for treatment heterogeneity with: all factors
CBT* Low Female Concentration -0.32* -0.27* -0.47** -0.33**
(0.19) (0.16) (0.20) (0.16)
CBT -0.17 -0.13 0.07 0.02
(0.12) (0.10) (0.13) (0.10)
LowFem 0.21 0.17 0.24* 0.17
(0.14) (0.11) (0.15) (0.12)
CBT*LowCon+CBT -0.50*** -0.40*** -0.40*** -0.31***
P-value: CBT*LowCon+CBT 0.001 0.001 0.009 0.013