0
The Impact of MBA Programme Attributes on Post-MBA Salaries*
Caroline Elliott† Kwok Tong Soo‡
The Business School Department of Economics
University of Huddersfield Lancaster University
Huddersfield Lancaster
HD1 3DH LA1 4YX
Abstract
This paper explores the impact of various MBA programme attributes on the average
post-MBA salary of graduates, contributing to the literature on the returns to an post-MBA degree,
which to date has instead focused predominantly on the impact of individual student traits.
The analysis uses a new panel dataset, comprising MBA programmes from across the world.
Results indicate that pre-MBA salary and quality rank of programme are key determinants of
post-MBA salary.
Keywords
MBA; Returns to education; programme characteristics
Journal of Economic Literature Codes
I21; J31
* Many thanks to two anonymous referees, Colin Green, Geraint Johnes, Giuseppe Migali, Ian Walker, Chengang Wang, participants of the 2013 Second Lisbon Research Workshop on Economics, Statistics and Econometrics of Education and the 2013 Scottish Economic Society Conference, and seminar participants at Bradford University School of Management for helpful comments received. Any remaining errors of course remain the responsibility of the authors.
†
Prof Caroline Elliott, The Business School, University of Huddersfield, HD1 3DH; [email protected]; Tel. +44(0)1484 471032
1
The Impact of MBA Programme Attributes on Post-MBA Salaries
Abstract
This paper explores the impact of various MBA programme attributes on the average
post-MBA salary of graduates, contributing to the literature on the returns to an post-MBA degree,
which to date has instead focused predominantly on the impact of individual student traits.
The analysis uses a new panel dataset, comprising MBA programmes from across the world.
Results indicate that pre-MBA salary and quality rank of programme are key determinants of
post-MBA salary.
1. Introduction
This paper explores the impact of various MBA programme attributes on the average
post-MBA salary of full-time post-MBA graduates. Studies of the salary returns to a full-time post-MBA
qualification are particularly valuable, given not only the premium fees typically associated
with these programmes, but also the opportunity cost of not working while studying for the
degree.1 The analysis can offer potential MBA students an insight into the factors that impact
post-MBA salary, including those under their control such as whether to engage in full-time
MBA study when younger or older. Simultaneously, the results highlight to university policy
makers the factors that the employers of MBA graduates value, and those factors that are
seemingly of little relevance.
The premium fees and changes to the salary returns to an MBA in recent years have also been
the subject of media attention (The Economist, 2014). This paper makes use of a dataset of
US and non-US MBA programmes. Much of the previous research on MBAs has focused on
2
the US market. However, there are large and significant differences between the US and
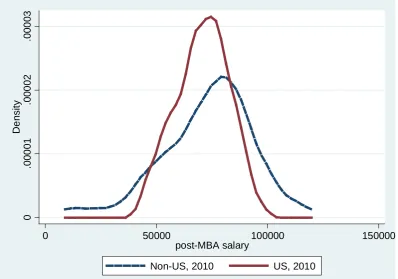
non-US MBA markets. Figure 1 shows real post-MBA salaries in non-US dollars in 2010 using
year-average exchange rates from our dataset, dividing the sample into US and non-US
universities.
Figure 1 about here
It highlights significant differences in post-MBA salaries: US universities have a smaller
variance and slightly lower average post-MBA salaries than non-US universities. This in part
motivates our analysis into whether post-MBA salaries of non-US universities have different
determinants from those of US universities.
This paper offers the following contributions to the literature on the financial returns to an
MBA. First, to examine the impact of programme characteristics on post-MBA salaries we
use data from a newly constructed dataset, using institution level data from the Which MBA
Guide. The use of institution level data means that we lose some of the richness of the data
compared with some of the recent research in this area which use individual level data from
GMAC (Graduate Management Admission Council) (see Literature Review below). Also, we
must assume that student cohorts are relatively similar rather than heterogeneous 2.
Nevertheless, an institutional level dataset provides information on variables such as
university and programme accreditations, as well as published programme rankings. As noted
above, the data allow us to extend the analysis to consider both US and non-US universities.
3
We are also able to divide the sample into 2004-2007 and 2008-2010 periods, to consider any
impact of the recent, more challenging, international economic climate on the analysis.
The second principal contribution of the paper is in the inclusion of pre-MBA salaries in the
regression model. Pre-MBA salaries capture a range of workplace abilities that may not be
captured by other measures such as GMAT scores and previous work experience, and
therefore may be a better determinant of post-MBA salaries than these other measures. We
find that this is indeed the case: pre-MBA salaries are positively and significantly related to
post-MBA salaries, while in contrast to existing literature, average GMAT scores and
pre-MBA work experience have no significant effect. The third key contribution of this paper,
which has not been addressed in existing literature on the returns to an MBA, is to deal with
the issue of unobserved student ability, which may bias the results. We account for this by
instrumenting pre-MBA salaries and GMAT scores with differences and lagged differences
of these variables. We perform standard tests for instrument validity, and show that the
results obtained using conventional fixed effects remain when using instrumental variables.
The next section reviews the related literature on the returns to MBAs and other forms of
education. Section 3 describes the dataset and the methods employed. Section 4 describes the
results, including subsections on unobserved student ability; sensitivity analysis and
additional results. Section 5 provides the conclusions.
2. Literature Review
An extensive economics literature considers factors determining the financial returns to
various levels of education. For example, the influential paper by Card and Krueger (1992)
concluded that public school quality in the US is directly related to male pupils’ financial
returns to school-level education, although more recently Jensen (2010) concluded that there
4
financial returns to schooling. The literature on the financial rewards to schooling also
considers, for example, the differential wage returns to studying at a private versus a state
(public in the US) school, with Green et al. (2011) offering a recent UK contribution to this
literature. Many studies of the financial returns to further and higher education also exist,
with recent analyses such as Walker and Zhu (2011) considering the differential financial
returns associated with studying undergraduate degrees in different disciplines and according
to final degree classification, as well as the financial rewards associated with studying for a
postgraduate qualification.
Walker and Zhu (2011) are unable within their dataset to distinguish between studying for an
MBA and other vocational postgraduate degrees. Nevertheless, there are a growing number
of papers that specifically consider the financial returns to an MBA degree, stretching back to
Reder (1978). However, as is typical in the literature discussing financial returns to various
levels of education, much of the existing literature focuses on individual level analyses. Tracy
and Waldfogel (1997) is notable for using business school level data and regression analysis
to determine the impact of student cohort characteristics and the ratio of acceptances to
applications on post-MBA average salaries which they then use to determine the value-added
of an MBA at a particular institution. These value-added figures are used to derive an
alternative to published MBA programme rankings.3
More recently, Arcidiacono et al. (2008) and Grove and Hussey (2011) estimate the financial
returns to an MBA, with Grove and Hussey (2014) considering school and individual factors
impacting on returns to an MBA. To date this more recent literature focuses predominantly
on the impact of individual student characteristics as in the broader literature on financial
returns to education, using individual student and alumni data collated by the GMAC.
5
Nevertheless, Grove and Hussey (2014) and Hussey (2012) do consider a number of
programme factors. For example, in a US analysis, Grove and Hussey (2014) control for
factors including (but not restricted to) the type of MBA undertaken, i.e. full-time, part-time,
executive; programme specialisms; the percentage of faculty with a PhD; the extent of faculty
publications; an indicator of faculty salaries; average class size and whether a programme has
AACSB (Association to Advance Collegiate Schools of Business) accreditation.
Other literature on the impact of rankings on education markets has focused predominantly
on the impact of published rankings on applications decisions; see most recently Luca and
Smith (2013). A separate literature focuses on the differential between male and female
post-MBA salaries; for example see Graddy and Pistaferri (2000), Montgomery and Powell
(2003).
The present paper examines the impact on post-MBA salaries of a much broader range of
programme variables than in existing analyses, and also considers full ranking information
provided in the Which MBA Guides. The present paper innovates relative to Tracy and
Waldfogel (1997) by not only employing a wider range of covariates, capturing programme
characteristics as well as student characteristics, but by using a panel of both US and non-US
universities (Tracy and Waldfogel focus on US universities and are limited by the use of
cross-sectional data in much of their analysis). This not only enables us to control for
unobserved university fixed effects, but also to compare results between US and non-US
universities for a much larger dataset.
3. Data and Methods
Data are from successive editions of the Which MBA Guide, published by The Economist.
This annual publication contains information on MBA programmes, increasingly from
6
programmes. Appendix A lists the number of observations in each country in our sample.
Some data in the Guide are collected directly from each institution, for example data on fees,
staff and student numbers, and accreditations. Accreditations from each of the three main
business school accreditation bodies are included: AACSB (Association to Advance
Collegiate Schools of Business), EQUIS (European Quality Improvement System), and
AMBA (Association of MBAs). Although EQUIS is a European body, EQUIS accreditation
is not restricted to European schools.4 While details on response rates from institutions are
not publicly available for all years in the sample, for the most recent year for which data were
collected (2010), only nine institutions failed to respond to the survey, with an additional five
institutions not providing sufficient data to be included in the Which MBA Guide.
Since 1993, alumni have also been surveyed for the Which MBA Guide, scoring their
programme, faculty, facilities, careers services and peers, each on a five-point scale.
Institutions contact alumni with the online address of a web-based questionnaire that they are
asked to complete, responses being collated by The Economist. This prevents universities
from filtering out any negative alumni responses. Aggregated responses are reported in the
Guide, allowing us to use variables that reflect alumni views of the programmes undertaken.
A minimum number of alumni responses are required for these data to be published in the
Which MBA Guide and used in the rankings, in an effort to ensure the representativeness of
the responses and limit sample selection bias.5
4 There are some similarities between AACSB and EQUIS as their accreditations operate at the business school level, however AMBA accreditation is more distinctive as the accreditation is at the programme rather than the school level.
5
7
The Which MBA Guide has produced an overall ranking of the top MBA programmes since
the 2002 edition of the Guide. The ranking is regularly publicised in the Economist
newspaper, most recently in the 11 October 2014 edition (The Economist, 2014), and is
constructed from a weighted average of the current and previous two years’ data (the weights
are 50 percent for the current year, 30 percent for the year before, and 20 percent for two
years before) to reduce the volatility in the rankings. It consists of 21 components; Ridgers
(2009) has details of the construction of the overall ranking, with a summary also provided in
Appendix B. Each data item is reported on an annual basis; it is only the ranking that is
constructed from three years of data.
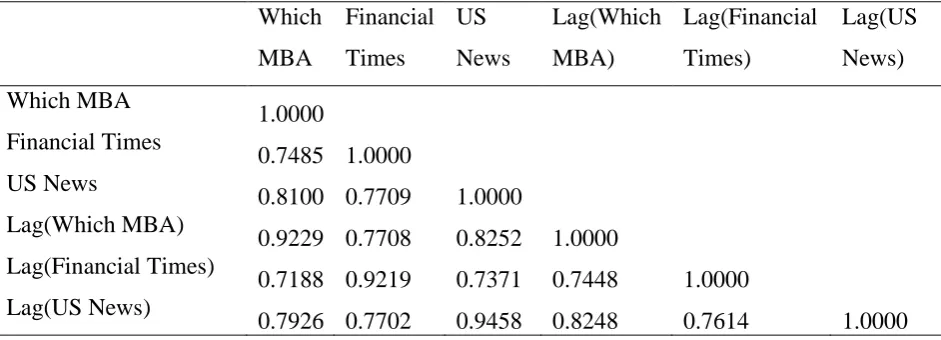
Other high profile MBA programme rankings exist, for example The Financial Times, US
News and World Report and Business Week rankings. We were able to obtain the rankings of
The Financial Times and US News and World Report, for the years 2004 to 2010, to compare
with the rankings in the Which MBA Guide. Table 1 presents the correlations between the
three rankings, and their respective one-year lags.
Table 1 about here
The correlation between each pair of rankings is never lower than 0.75. In addition, the
correlation between each ranking and its own one-year lag is never lower than 0.92,
indicating substantial persistence in the data. Also, the correlation between each ranking and
the one-year lag of the other two rankings is never lower than 0.71, which indicates that there
is a strong tendency for the rankings to move together. Taken together, these suggest
confidence in the Which MBA Guide rankings used in this paper. The US News and World
Report rankings were not used as they focus exclusively on US business schools, while the
Business Week rankings are only published bi-annually and again only rank US business
8
schools. Further, it can be argued that even if a particular publication is not read, students and
potential employers are likely to have some awareness of a university’s approximate position
in any ranking as programme publicity often draws attention to rankings obtained, and newly
published rankings are widely reported in the news media.
All monetary values are converted into US dollars in real terms using the year-average
exchange rates obtained from the International Financial Statistics of the International
Monetary Fund (IMF) and the Consumer Price Index of each country obtained from the
World Economic Outlook database of the IMF.
The final sample is an unbalanced panel, covering seven years from 2004 to 2010 and a
maximum of 606 observations from 115 universities, with 311 observations from 52
universities in a sample restricted to US universities. All results reported below make use of
this unbalanced panel, although performing the analysis on a balanced panel yields very
similar results (the balanced panel has 364 observations from 52 universities, 26 of which are
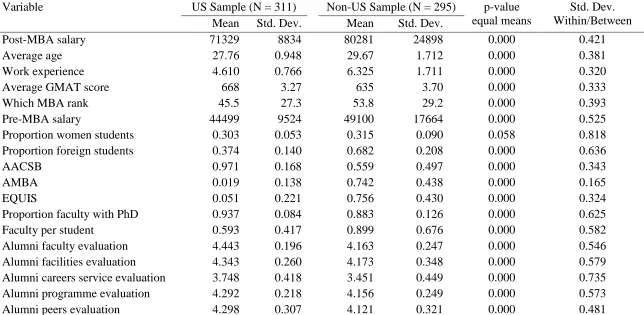
US universities).6 Table 2 provides basic descriptive statistics, dividing the sample into US
and non-US programmes. As the data are from the Which MBA Guide, observations relate to
MBA programmes identified by that publication as the best quality MBA programmes, which
since 2002, the guide ranks as amongst the top 100 in the world.
Table 2 about here
Except for the proportion of women students, there are statistically significant differences
between US and non-US programmes in all variables at the 5 percent level. Compared to
non-US universities, US universities occupy lower ranks in the Which MBA Guide
(indicating higher quality), and have younger students with higher average GMAT scores and
6
9
fewer years of work experience. Both pre- and post-MBA salaries are lower for students from
US programmes than from non-US programmes.
We estimate Mincer (1974) type equations of the natural log of post-MBA salaries as a
function of pre-MBA salaries, age, work experience, average GMAT score, the rank of the
MBA programme, and other covariates:
ln𝑆𝑆𝑖𝑖𝑖𝑖 =𝛼𝛼𝑖𝑖 +𝛾𝛾𝑖𝑖+βXit+𝜖𝜖𝑖𝑖𝑖𝑖 (1)
Where 𝛼𝛼𝑖𝑖 are programme-specific effects, 𝛾𝛾𝑖𝑖 are year-specific effects, and Xitis a vector of
explanatory variables. Post-MBA salaries are conditional on securing a post-MBA job.
Pre-MBA salaries, age, work experience, and the average GMAT score capture the human capital
of MBA holders; in particular, the inclusion of pre-MBA salaries helps to capture aspects of
workplace ability that are not captured by measures such as GMAT scores. These pre-MBA
salaries have been calculated by the authors using data from the Which MBA Guide on
post-MBA salaries and percentage increase in salaries; our pre-post-MBA salaries are therefore for the
same cohort of students as the post-MBA salaries. Apart from age and work experience, all
non-dichotomous explanatory variables are in natural logs. Squared age and work experience
variables were initially included in regressions, however the coefficients on these squared
variables were never found to be significantly different from zero, and so were dropped from
the analysis.
Since the dataset is a panel, we use fixed-effects estimation including a full set of year and
programme fixed effects, so the coefficients are estimated based on changes in the variables
over time within each programme, and all time-invariant programme-specific effects are
eradicated by the fixed effects. Therefore the estimates require variation within universities in
both dependent and independent variables. The rightmost column of Table 2 shows the
10
that there is more between-institution variation than within-institution variation in all
variables, the within-institution variation is still quite large relative to the between-institution
variation7.
4. Results
4.1 Main Results
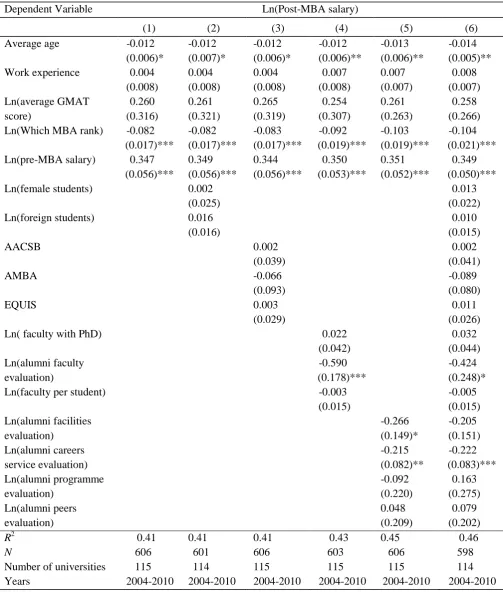
Table 3 presents the results for all universities in the sample. All results in this table use fixed
effects estimation with heteroskedastic-robust standard errors. Column (1) reports the
baseline specification; column (2) adds additional student characteristics, column (3) adds
professional accreditations, column (4) adds faculty characteristics, column (5) adds alumni
evaluations, and column (6) includes all covariates.
Table 3 about here
As expected, higher post-MBA salaries are associated with higher pre-MBA salaries and
having attended a lower ranked (higher quality) university. Also, it may pay to study for an
MBA at a younger age, a result in line with the results of Hussey (2012) as studying for an
MBA at a younger age may be a strategy undertaken to signal graduate quality8. Consistently,
the regressions reported in Table 3 indicate that a 1% increase in pre-MBA salary (US$ 467
at the mean) is associated with approximately a 0.35% increase in post-MBA salary (US$
265 at the mean), holding other variables constant. Similarly, a 1% decrease in university
7 In addition to using university fixed effects, we also experimented with using country fixed effects. This yielded qualitatively similar results to those reported, which suggests that universities share similar characteristics within country, and are different across countries.
8
11
rank increases post-MBA salaries by 0.09% (US$ 68 at the mean), while a student who is a
year older will have a 1% lower post-MBA salary (US$ 757 at the mean). The result that
ranking of university is linked to post-MBA salary does not simply reflect a high weighting
given to MBA salary in the calculation of Guide rankings. In the Which Guide
post-MBA salary is one of twenty one indicators contributing to the final ranking of a university,
having a weight of 0.15, as shown in Appendix B. In addition, as discussed above in Section
3, each year’s ranking is a weighted average of scores from the current year and the previous
two years, further reducing the weight of this year’s post-MBA salary on this year’s rank.
An alternative (and perhaps more interesting) way of interpreting the coefficient on pre-MBA
salaries is as follows. Equation (1) may be rewritten as:
ln𝑆𝑆𝑖𝑖𝑖𝑖−ln𝑆𝑆𝑖𝑖𝑖𝑖−1 =𝛼𝛼𝑖𝑖 +𝛾𝛾𝑖𝑖+𝛿𝛿ln𝑆𝑆𝑖𝑖𝑖𝑖−1+βXit+𝜖𝜖𝑖𝑖𝑖𝑖 (2)
Where 𝑆𝑆𝑖𝑖𝑖𝑖−1 is the pre-MBA salary. As a simple algebraic manipulation this has no impact on
the coefficients of the remaining variables Xit. However, it allows us to interpret the
coefficient on pre-MBA salaries 𝛿𝛿 as the impact of pre-MBA salaries on the growth rate of
salaries post-MBA. Then the coefficient on pre-MBA salaries in Table 3 would be 1 +𝛿𝛿.
Since in Table 3 the coefficient on pre-MBA salaries is always less than 1, this implies 𝛿𝛿 <
0, and hence from equation (2) that a higher pre-MBA salary implies lower growth of salaries
as a result of doing an MBA, all else being equal. This is what we may expect; students with
higher pre-MBA salaries are typically older students (the correlation between pre-MBA wage
and age is 0.3818), hence may already have more workplace skills than their younger
classmates, and thus have less to gain from attending an MBA.
Of particular note are the variables that do not seem to impact significantly on post-MBA
12
experience. Both factors might have been expected to have a significant impact and have
consistently been identified as important factors determining returns to an MBA degree in the
analyses using individual student level data described in the Literature Review in Section 2.
We speculate that through the use of a greater number of programme level explanatory
variables which have not been used in previous studies, and through the use of average
pre-MBA salary as an explanatory variable that captures the potential accumulated human capital
of full-time MBA students, we are able to distinguish more accurately the variables that
impact upon post-MBA salaries.
Accreditations of universities and MBA programmes by professional bodies (AACSB,
EQUIS and AMBA) are often considered to be signals of quality. Universities invest large
amounts of effort into obtaining and maintaining these accreditations. The fraction of
universities in our sample which are “triple accredited” has more than doubled between 2004
and 2010, from about 11 percent to about 23 percent. At the same time, the fraction of
universities in the sample which have no accreditation has decreased from 14 percent to 2
percent, while the percentages which have one and two accreditations have remained fairly
constant.
Nevertheless, from Table 3, these accreditations are not found to have a significant impact on
post-MBA salaries. We offer three, related, possible explanations for the non-significance of
professional accreditation. First, universities only rarely change accreditation status (this
occurs for less than 4 percent of the sample), so the fixed effects estimates may be unable to
recover the coefficients associated with these variables. This is partly because the
professional bodies accredit a university or MBA programme for periods greater than one
year: five years in the case of AACSB, three or five years in the case of EQUIS, and one,
13
signals may be more important to applicants, students and academics than potential
employers. By focusing on top ranking MBA programmes across the world, many of the
universities in the dataset have at least one accreditation and so little impact of the
accreditations can be detected. Finally, accreditation bodies take into account some of the
factors already included in the regressions reported in Table 3 when they make accreditation
decisions, for example the percentage of faculty holding PhD degrees.9 This may make it
more difficult to identify a separate impact of accreditations on post-MBA salaries.
The other noteworthy result from Table 3 is that there is a significantly negative relationship
between alumni evaluations of careers services and post-MBA salaries. As will be seen
below, this is a finding which is robust to alternative samples and model specifications. None
of the other alumni evaluations are statistically significant, apart from alumni evaluations of
faculty which is significant at only the 10 percent level. It may be observed from Table 2 that,
relative to the other alumni evaluations, the alumni evaluation of careers services has a larger
standard deviation, and a higher within relative to between variation. Both of these enable us
to obtain a more precise (and hence statistically significant) estimate of the coefficient on
careers services, which we cannot obtain for the other alumni evaluations10.
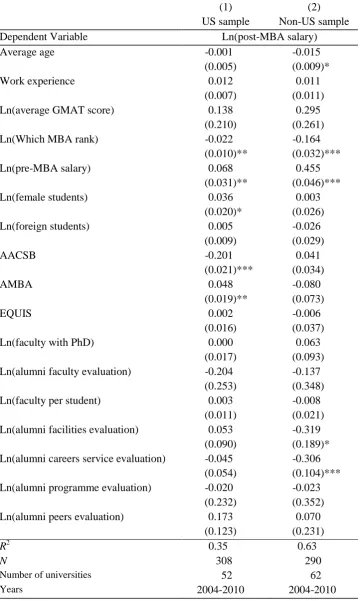
Table 4 shows that dividing the sample into US and non-US universities yields additional
results.
Table 4 about here
9 AMBA, for example, expect 75% of faculty to hold a relevant postgraduate degree, with at least 50% of faculty holding a Doctorate.
14
Most significantly, the negative relationship between alumni perceptions of careers services
and post-MBA salaries holds only for the non-US sample. It may be that the older students in
the latter sample already have wider business networks and so have less need for careers
services. University ranks and pre-MBA salaries continue to be highly significant predictors
of post-MBA salaries in both US and non-US samples, although both variables have larger
effects for non-US universities than for US universities. We speculate that the Which MBA
university rankings are more important for non-US universities as these institutions do not
feature in the US-based Business Week and US News and World Report rankings. Hence, the
Which MBA rankings may be more salient to non-US students than US students (see Chetty
et al, 2009).
It is only in the results reported in Table 4 that any impact of accreditations on post-MBA
salaries can be identified, although any significant impact is confined to US universities.
Interestingly the US based AACSB accreditation is linked to significantly lower post-MBA
salaries, while the UK based AMBA accreditation is associated with high salaries. These
results may reflect the large numbers of US universities in the dataset that have AACSB
accreditation, while relatively few US universities seek to obtain AMBA accreditation,
making universities with this accreditation particularly note-worthy in the US MBA market11.
Therefore, these results are driven by small numbers of observations.
The findings of Table 4, when combined with the descriptive statistics in Table 2 which
suggest that US students are younger and less experienced, are consistent with the idea that
US students have more to gain from investing in an MBA, because they are earlier in their
11
15
career life cycle. A higher return to an MBA for younger students is consistent with the
evidence on the decreasing growth rates of incomes over the life cycle (see Polachek (2008)
for a survey).
4.2 Unobserved Ability
It has been recognised since Griliches (1977) that unobserved ability which is correlated with
observed variables such as post-MBA salaries, pre-MBA salaries and GMAT scores may bias
conventional estimates of the returns to education. Therefore, in addition to the fixed effects
estimation, we use Two Stage Least Squares (2SLS) methods to overcome this bias. To
instrument for pre-MBA salaries and GMAT scores in levels, we use the first differences and
lagged first differences of these variables; this approach was first proposed by Anderson and
Hsiao (1982). The identifying assumption is that changes in pre-MBA salaries are correlated
with pre-MBA salaries in levels, but are uncorrelated with the error term. This will be true if
pre-MBA salaries and GMAT scores are pre-determined, such that the current period error
term is uncorrelated with current and lagged values of these variables, see Blundell and Bond
(1998). The validity of our identifying assumption is tested using the Hansen J test of
overidentification.
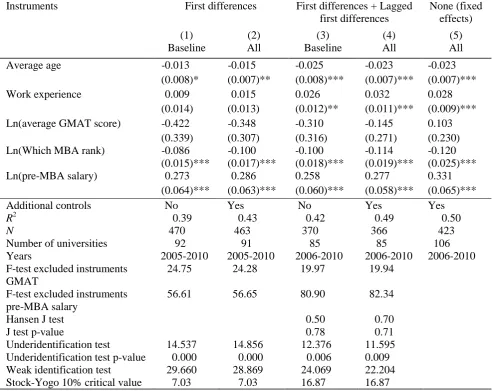
Table 5 reports the results of estimating the model using 2SLS. We instrument pre-MBA
salary and average GMAT score in levels with the first differences in columns (1) and (2),
and first differences and lagged first differences in columns (3) and (4).
Table 5 about here
The results are similar to those obtained in Table 3 using conventional fixed effects
estimation. Average age and the rank of the programme are always significantly negatively
16
to post-MBA salary. The average GMAT score never has a significant effect on post-MBA
salaries. The new result we obtain is that in columns (3) and (4) when we use both first
differences and lagged first differences as instruments, work experience becomes positively
and significantly related to post-MBA salary. This is mainly an artifact of the data; in these
results the sample period is restricted to 2006 to 2010 since we use lagged differences as
instruments. Column (5) of Table 5 shows that performing conventional fixed effects
estimates using the same sample period yields the same positive effect of work experience on
post-MBA salary.
Table 5 also reports some specification tests for the 2SLS models; all specification tests
reported are robust to heteroskedasticity. First, we report the F-tests of the joint significance
of the excluded instruments on the instrumented variables in the first stage regressions. These
are always highly significant, indicating that the instruments are highly correlated with the
instrumented variables. Second, we report the Hansen J-test of overidentification. This can
only be performed for the models in columns (3) and (4), since the models in columns (1) and
(2) are exactly identified. The null hypothesis is that the instruments are jointly valid. We do
not reject the null hypothesis in either case, so conclude that the overidentifying restrictions
are valid. Third, we report the Kleibergen and Paap (2006) rk LM statistic, which is a test of
underidentification. The null hypothesis is that the equation is underidentified. Since we
reject the null in each specification in Table 5, we conclude that the model is identified. A
fourth specification test we report is the Kleibergen and Paap (2006) rk Wald F statistic,
which is a test of weak instruments, along with the associated Stock and Yogo (2005) 10%
critical values. We reject the null hypothesis that the instruments are weak in each
specification of Table 5.
17
Here we discuss the sensitivity of our results to different model specifications and definitions
of the explanatory variables. First, we replaced the continuous institution ranks with dummy
variables for different ranks. Second, we experimented with different combinations of
explanatory variables, to overcome multicollinearity. Third, we probe deeper into the
negative impact of careers services by interacting the alumni careers score with other
explanatory variables.
It was hypothesised that employers may offer higher salaries to graduates from high ranking
programmes, paying less attention to the particular rank of a programme. Hence in line with
the approach used by Grove and Hussey (2011), the regressions were rerun instead using
dummy variables to indicate whether an institution was ranked 1-10, or 11-25 in the Which
MBA Guide. We found results that were similar to those reported in Tables 3 and 4, i.e.
better ranked universities perform better, as also reported in the results of Grove and Hussey
(2011). This suggests that the way that university rankings are defined does not materially
change the results.
We were also concerned about possible effects of the international economic downturn on the
analysis. For example, it may be that graduates of better ranked programmes fare better
during recessions; on the other hand, it may also be that the recession eliminated the
highest-paying jobs obtained by those in the better-ranked programmes. Therefore, the analysis above
was repeated, comparing results for the full sample, US and non-US subsamples, with the
data divided into 2004-2007 and 2008-2010 periods. Again, results remained comparable to
18
coefficients before and after the crisis.12 This may suggest that the two possible effects of the
recession offset each other.
A possible explanation for the lack of significant coefficient estimates in Tables 3 and 4
above is that some of the variables are collinear. This is a particular concern as the overall
ranking of a programme reflects to differing extents many of the programme characteristics
that we include as explanatory variables, while accreditations as well as rankings are signals
of quality. Correlations are especially high among the alumni evaluations of various
programme characteristics, exceeding 0.6 in many cases. Including only one alumni
evaluation in the regression indicatess that the included alumni evaluation is always
significantly negative (results suppressed for brevity). That is, regardless of which alumni
evaluation is considered, better alumni evaluation is always associated with lower post-MBA
salaries. We speculate that this is because students may trade off a good experience whilst on
an MBA programme with lower post-MBA salaries. What the results in Tables 3 and 4 also
show is that, despite the high correlation across alumni evaluations, it is the negative
evaluation of careers services that has the largest independent effect on post-MBA salaries13.
Our inclusion of pre-MBA salaries as an explanatory variable is an important innovation, as it
controls for other unobserved characteristics of students in MBA programmes, which may be
correlated with workplace performance and hence salaries. Pre-MBA salaries and the Which
MBA rank always have highly significant effects on post-MBA salaries. There is also the
12 For the full sample, the coefficient on university rank changes from -0.086 before the crisis to -0.114 after the crisis, with standard errors of 0.021 in each case, so a better ranking is more highly rewarded post-crisis, but not significantly so. Additional results withheld for the sake of brevity but available on request.
13
19
possibility of simultaneity between MBA salaries and the Which MBA rank, since
post-MBA salaries are a component of the rank. Therefore, one additional sensitivity check we
perform is to estimate the model sequentially omitting each of these variables, to check if the
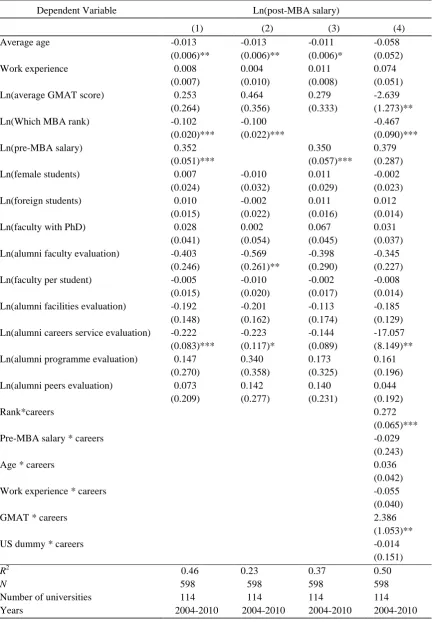
omission leads to omitted variable bias in the results. Table 6 reports regression results for the
full sample, dropping the accreditation variables.
Table 6 about here
Column (1) reports the analogue to column (6) of Table 3; dropping the accreditation
variables has no appreciable impact on the results. Columns (2) and (3) drop pre-MBA
salaries and the Which MBA rank, respectively. Once again this does not change the results,
suggesting that whilst these variables are important determinants of post-MBA salaries, they
are not highly correlated with other explanatory variables in the model14.
The result that careers services (as evaluated by alumni) have a negative, significant impact
on post-MBA salaries, at least for non-US programmes, is surprising and counter-intuitive.
Consequently, the final column of Table 6 replicates the model in column (1), but includes a
set of interaction terms of the alumni careers score with the Which MBA rank, pre-MBA
salary, average student age, work experience, GMAT score, and a dummy variable for
whether the university is in the US or not. Some interesting results emerge. While institutions
with lower alumni evaluations of careers services are still associated with higher post-MBA
salaries, the positive, significant coefficient on the rank and careers interaction variable
suggests that at higher ranked (lower quality) institutions, better careers services have a
14
20
negative effect on post-MBA salaries (the sum of the coefficients on careers services and on
the interaction term is still negative). Further, GMAT scores and careers services can be
considered complementary goods. The interaction between the US dummy and careers
services is not significant, suggesting that the difference between US and non-US institutions
in the effect of careers services is a result of differences in their Which MBA ranks and their
students’ GMAT scores.
4.4 Additional Results
In this section we document two additional sets of results. First, we divided the sample into
public and private universities. Second, we discuss possible measurement error in the
pre-MBA salaries.
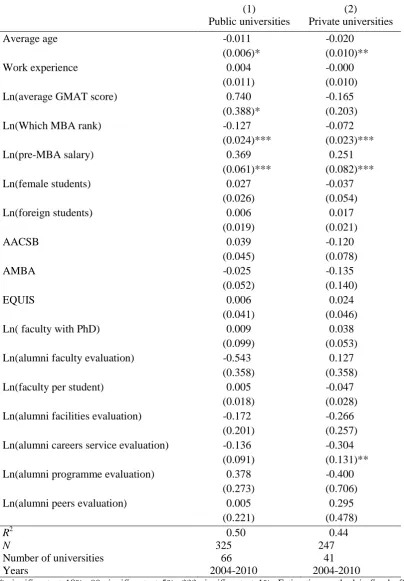
Public universities may have different characteristics than private universities. In general,
public universities charge much lower fees than private universities ($48,420 for public
universities compared to $66,282 for private universities in our sample), so this may
influence students’ university application decisions.15 In our sample there are 67 public
universities, 41 private universities, and 7 independent (partly private) universities. When the
regressions in Table 3 are run for public and private universities separately, we obtain the
same qualitative results as for the full sample; the results are reported in Table 7.
Table 7 about here
21
The main variables that have significant effects on post-MBA salaries are average student age
(negative relationship), rank (negative relationship) and pre-MBA salaries (positive
relationship).
The main differences in results between public and private universities are the following.
First, it is only in private universities that alumni evaluation of careers services has a negative
impact on post-MBA salaries. Second, in public universities, average GMAT scores have a
positive relationship with post-MBA salaries, whereas no such relationship exists for private
universities. Third, there are differences in magnitude of some of the coefficients; the impact
of average age is much larger for private universities, while the impact of rank and pre-MBA
salaries is larger for public universities. Whilst these differing results may suggest differences
between public and private universities, an alternative interpretation is that they reflect
national differences in the way universities are run. Appendix A shows the division into
public and private universities by country. While the US has both public and private
universities, 17 of the 18 universities in the UK sample are public, as are all the observations
from Canada and Australia. On the other hand, other countries such as Spain and Switzerland
only have private universities, while some universities in Belgium and France are defined as
independent.
A final concern was possible measurement error in the pre-MBA salaries, which may result
in attenuation bias in the corresponding coefficient16. Our use of instrumental variables to
control for unobserved student ability also helps to overcome measurement error. However,
our use of first differences of the variables as instruments may not provide a convincing
solution to the problem, especially if there are systematic trends in the measurement error.
22
Experimenting with reverse regressions and comparing first-differences with fixed effects
estimates (Hausman (2001), Grilliches and Hausman (1986)) suggested that measurement
error may indeed be present in the data. In light of this (and without any good external
instruments in our data) our results may be viewed as a lower bound on the effect of
pre-MBA salaries on post-pre-MBA ones.
5. Conclusions
The MBA degree is unusual, not only because it is often aimed at post-experience students,
but also because of its explicit focus on the business world. Because of this business
orientation, the MBA is perhaps the university degree for which the question of economic
returns is the most appropriate. Whilst the economic returns to other degrees can be
calculated, it may be more difficult to calculate the other, intangible returns to other types of
degrees, whereas such concerns may be less important in the context of MBAs17.
This paper explores the programme attributes impacting on post-MBA salaries, using a
unique and much more extensive panel dataset than has previously been used of programme
characteristics from an international sample of universities. Results indicate that pre-MBA
salary and quality of programme as measured by Which MBA Guide rankings are key
determinants of post-MBA salary. There is also some evidence that it pays to undertake a
full-time MBA at a younger age, and in line with this result, the length of previous work
experience of students, as well as better GMAT scores, have no bearing on post-MBA
salaries, in contrast to the existing literature. These results highlight which human capital
variables impact on post-MBA salaries, using a broader range of human capital variables than
are typically employed. Interestingly, professional accreditations and alumni evaluations of
23
faculty, facilities and programme undertaken are found to have no significant impact on
post-MBA salaries, and careers services, as evaluated by alumni, may have a negative impact on
MBA salaries. Hence, not all potential signals of MBA programme quality affect
post-MBA salaries.
Ultimately, these results can guide potential MBA students as to when in their careers it may
be most advantageous to undertake an MBA, and how to select amongst MBA programmes.
For university policy makers, the results suggest that attention needs to be paid to the reasons
for seeking professional accreditations: the accreditation bodies offer a number of services to
members and the benefits of these should be compared to the seeming lack of emphasis
placed on accreditations by the employers of MBA graduates. Similarly, the effectiveness of
MBA careers services should be reviewed.
References
Anderson, T.W., and C. Hsiao. 1982. “Formulation and Estimation of Dynamic Models using
Panel Data.” Journal of Econometrics 18: 47-82.
Arcidiacono, P., J. Cooley, and A. Hussey. 2008. “The Economic Returns to an MBA.”
International Economic Review 49: 873-899.
Blundell, R., and S. Bond. 1998. “Initial Conditions and Moment Restrictions in Dynamic
Panel Data Models.” Journal of Econometrics 87: 115-143.
Card, D., and A. Krueger. 1992. “Does School Quality Matter? Returns to Education and the
Characteristics of Public Schools in the United States.” Journal of Political Economy 100:
1-40.
Chetty, R., A. Looney, and K. Kroft. 2009. “Salience and Taxation: Theory and Evidence.”
24
Fitzgerald, R. A. 2000. “College Quality and the Earnings of Recent College Graduates.”
National Center for Education Statistics: Research and Development Report, August, U.S. Department of Education.
Graddy, K., and L. Pistaferri. 2000. “Wage Differences by Gender: Evidence from recently
graduated MBAs.” Oxford Bulletin of Economics and Statistics 62: 837-854.
Green, F., S. Machin, R. Murphy, and Y. Zhu. 2011. “The Changing Advantage from Private
Schools.” Economica 79: 658-679.
Griliches, Z. 1977. “Estimating the Returns to Schooling: Some Econometric Problems.”
Econometrica 45: 1-22.
Griliches, Z., and J. Hausman. 1986. “Errors in Variables in Panel Data.” Journal of
Econometrics 31: 93-118.
Grove, W.A., and A. Hussey. 2011. “Returns to Field of Study versus School Quality: MBA
Selection on Observed and Unobserved Heterogeneity.” Economic Inquiry 49: 730-749.
Grove, W.A., and A. Hussey. 2014. “Returns to MBA Quality: Pecuniary and Non-pecuniary
Returns to Peers, Faculty, and Institution Quality.” Labour Economics 26: 43-54.
Hausman, J. 2001. “Mismeasured Variables in Econometric Analysis: Problems from the
Right and Problems from the Left.” Journal of Economic Perspectives 15: 57-67.
Hussey, A. 2012. “Human Capital Augmentation versus the Signaling Value of MBA
Education.” Economics of Education Review 31: 442-451.
Jensen, R. 2010. “The (Perceived) Returns to Education and the Demand for Schooling.”
Quarterly Journal of Economics 125: 515-548.
Kleibergen, F., and R. Paap. 2006. “Generalized Reduced Rank Tests using the Singular
Value Decomposition.” Journal of Econometrics 133: 97-126.
Luca, M., and J. Smith. 2013. “Salience in Quality Disclosure: Evidence from the U.S. News
25
Mincer, J.A. 1974. “Schooling, Experience, and Earnings.” New York, Columbia University
Press.
Montgomery, M., and I. Powell. 2003. “Does an Advanced Degree Reduce the Gender Wage
Gap? Evidence from MBAs.” Industrial Relations 42: 396-418.
Polachek, S.W. 2008. “Earnings over the Life Cycle: The Mincer Earnings Function and its
Applications.” Foundations and Trends in Microeconomics 4: 165-272.
Reder, M.W. 1978. “An Analysis of a small, closely observed Labor Market: Starting
Salaries for University of Chicago MBAs.” Journal of Business 51: 263-297.
Ridgers, B. ed. 2009. “Which MBA?” 21st Edition. London: The Economist Newspaper.
Stock, J.H., and M. Yogo. 2005. “Testing for Weak Instruments in Linear IV Regression.” In
Identification and inference for econometric models: Essay in honor of Thomas Rothenberg, edited by Andrews, D.W.K. and J.H.Stock, Cambridge: Cambridge University Press.
Stoker, T.M. 2008. “Aggregation (Econometrics).” In The New Palgrave Dictionary of
Economics , edited by Durlauf, S.N. and L.E. Blume, 2nd Edition, London: Palgrave Macmillan.
The Economist (2014). “Which MBA?, 2014” (Business Section), The Economist 11
October.
Tracy, J., and J. Waldfogel. 1997. “The Best Business Schools: A Market-Based Approach.”
The Journal of Business 70: 1-31.
Walker, I., and Y. Zhu. 2011. “Differences by Degree: Evidence of the New Financial Rates
of Return to Undergraduate Study for England and Wales.” Economics of Education Review
26
Figure 1: Real Post-MBA Salaries, US and Non-US Samples, 2010.
Source: Which MBA Guide 2010
0
.000
01
.000
02
.000
03
De
ns
it
y
0 50000 100000 150000
post-MBA salary
27
Table 1: Correlation Between Different MBA Rankings
Which
MBA
Financial
Times
US
News
Lag(Which
MBA)
Lag(Financial
Times)
Lag(US
News)
Which MBA
1.0000 Financial Times
0.7485 1.0000 US News
0.8100 0.7709 1.0000
Lag(Which MBA)
0.9229 0.7708 0.8252 1.0000
Lag(Financial Times)
0.7188 0.9219 0.7371 0.7448 1.0000
Lag(US News)
0.7926 0.7702 0.9458 0.8248 0.7614 1.0000
28 Table 2: Descriptive Statistics
Variable US Sample (N = 311) Non-US Sample (N = 295) p-value
equal means
Std. Dev. Within/Between
Mean Std. Dev. Mean Std. Dev.
Post-MBA salary 71329 8834 80281 24898 0.000 0.421
Average age 27.76 0.948 29.67 1.712 0.000 0.381
Work experience 4.610 0.766 6.325 1.711 0.000 0.320
Average GMAT score 668 3.27 635 3.70 0.000 0.333
Which MBA rank 45.5 27.3 53.8 29.2 0.000 0.393
Pre-MBA salary 44499 9524 49100 17664 0.000 0.525
Proportion women students 0.303 0.053 0.315 0.090 0.058 0.818
Proportion foreign students 0.374 0.140 0.682 0.208 0.000 0.636
AACSB 0.971 0.168 0.559 0.497 0.000 0.343
AMBA 0.019 0.138 0.742 0.438 0.000 0.165
EQUIS 0.051 0.221 0.756 0.430 0.000 0.324
Proportion faculty with PhD 0.937 0.084 0.883 0.126 0.000 0.625
Faculty per student 0.593 0.417 0.899 0.676 0.000 0.582
Alumni faculty evaluation 4.443 0.196 4.163 0.247 0.000 0.546
Alumni facilities evaluation 4.343 0.260 4.173 0.348 0.000 0.579
Alumni careers service evaluation 3.748 0.418 3.451 0.449 0.000 0.735
Alumni programme evaluation 4.292 0.218 4.156 0.249 0.000 0.573
Alumni peers evaluation 4.298 0.307 4.121 0.321 0.000 0.481
29 Table 3: Regression Results – Fixed Effects Estimates
Dependent Variable Ln(Post-MBA salary)
(1) (2) (3) (4) (5) (6)
Average age -0.012 -0.012 -0.012 -0.012 -0.013 -0.014
(0.006)* (0.007)* (0.006)* (0.006)** (0.006)** (0.005)**
Work experience 0.004 0.004 0.004 0.007 0.007 0.008
(0.008) (0.008) (0.008) (0.008) (0.007) (0.007)
Ln(average GMAT score)
0.260 0.261 0.265 0.254 0.261 0.258
(0.316) (0.321) (0.319) (0.307) (0.263) (0.266)
Ln(Which MBA rank) -0.082 -0.082 -0.083 -0.092 -0.103 -0.104
(0.017)*** (0.017)*** (0.017)*** (0.019)*** (0.019)*** (0.021)***
Ln(pre-MBA salary) 0.347 0.349 0.344 0.350 0.351 0.349
(0.056)*** (0.056)*** (0.056)*** (0.053)*** (0.052)*** (0.050)***
Ln(female students) 0.002 0.013
(0.025) (0.022)
Ln(foreign students) 0.016 0.010
(0.016) (0.015)
AACSB 0.002 0.002
(0.039) (0.041)
AMBA -0.066 -0.089
(0.093) (0.080)
EQUIS 0.003 0.011
(0.029) (0.026)
Ln( faculty with PhD) 0.022 0.032
(0.042) (0.044)
Ln(alumni faculty evaluation)
-0.590 -0.424
(0.178)*** (0.248)*
Ln(faculty per student) -0.003 -0.005
(0.015) (0.015)
Ln(alumni facilities evaluation)
-0.266 -0.205
(0.149)* (0.151)
Ln(alumni careers service evaluation)
-0.215 -0.222
(0.082)** (0.083)***
Ln(alumni programme evaluation)
-0.092 0.163
(0.220) (0.275)
Ln(alumni peers evaluation)
0.048 0.079
(0.209) (0.202)
R2 0.41 0.41 0.41 0.43 0.45 0.46
N 606 601 606 603 606 598
Number of universities 115 114 115 115 115 114
Years 2004-2010 2004-2010 2004-2010 2004-2010 2004-2010 2004-2010
30 Table 4: US and Non-US Universities
(1) (2)
US sample Non-US sample
Dependent Variable Ln(post-MBA salary)
Average age -0.001 -0.015
(0.005) (0.009)*
Work experience 0.012 0.011
(0.007) (0.011)
Ln(average GMAT score) 0.138 0.295
(0.210) (0.261)
Ln(Which MBA rank) -0.022 -0.164
(0.010)** (0.032)***
Ln(pre-MBA salary) 0.068 0.455
(0.031)** (0.046)***
Ln(female students) 0.036 0.003
(0.020)* (0.026)
Ln(foreign students) 0.005 -0.026
(0.009) (0.029)
AACSB -0.201 0.041
(0.021)*** (0.034)
AMBA 0.048 -0.080
(0.019)** (0.073)
EQUIS 0.002 -0.006
(0.016) (0.037)
Ln(faculty with PhD) 0.000 0.063
(0.017) (0.093)
Ln(alumni faculty evaluation) -0.204 -0.137
(0.253) (0.348)
Ln(faculty per student) 0.003 -0.008
(0.011) (0.021)
Ln(alumni facilities evaluation) 0.053 -0.319
(0.090) (0.189)*
Ln(alumni careers service evaluation) -0.045 -0.306
(0.054) (0.104)***
Ln(alumni programme evaluation) -0.020 -0.023
(0.232) (0.352)
Ln(alumni peers evaluation) 0.173 0.070
(0.123) (0.231)
R2 0.35 0.63
N 308 290
Number of universities 52 62
Years 2004-2010 2004-2010
31 Table 5: 2SLS Results
Instruments First differences First differences + Lagged
first differences
None (fixed effects)
(1) (2) (3) (4) (5)
Baseline All Baseline All All
Average age -0.013 -0.015 -0.025 -0.023 -0.023
(0.008)* (0.007)** (0.008)*** (0.007)*** (0.007)***
Work experience 0.009 0.015 0.026 0.032 0.028
(0.014) (0.013) (0.012)** (0.011)*** (0.009)***
Ln(average GMAT score) -0.422 -0.348 -0.310 -0.145 0.103
(0.339) (0.307) (0.316) (0.271) (0.230)
Ln(Which MBA rank) -0.086 -0.100 -0.100 -0.114 -0.120
(0.015)*** (0.017)*** (0.018)*** (0.019)*** (0.025)***
Ln(pre-MBA salary) 0.273 0.286 0.258 0.277 0.331
(0.064)*** (0.063)*** (0.060)*** (0.058)*** (0.065)***
Additional controls No Yes No Yes Yes
R2 0.39 0.43 0.42 0.49 0.50
N 470 463 370 366 423
Number of universities 92 91 85 85 106
Years 2005-2010 2005-2010 2006-2010 2006-2010 2006-2010
F-test excluded instruments GMAT
24.75 24.28 19.97 19.94
F-test excluded instruments pre-MBA salary
56.61 56.65 80.90 82.34
Hansen J test 0.50 0.70
J test p-value 0.78 0.71
Underidentification test 14.537 14.856 12.376 11.595
Underidentification test p-value 0.000 0.000 0.006 0.009
Weak identification test 29.660 28.869 24.069 22.204
Stock-Yogo 10% critical value 7.03 7.03 16.87 16.87
32
Table 6: Excluding Accreditation and including Interaction Terms
Dependent Variable Ln(post-MBA salary)
(1) (2) (3) (4)
Average age -0.013 -0.013 -0.011 -0.058
(0.006)** (0.006)** (0.006)* (0.052)
Work experience 0.008 0.004 0.011 0.074
(0.007) (0.010) (0.008) (0.051) Ln(average GMAT score) 0.253 0.464 0.279 -2.639
(0.264) (0.356) (0.333) (1.273)**
Ln(Which MBA rank) -0.102 -0.100 -0.467
(0.020)*** (0.022)*** (0.090)***
Ln(pre-MBA salary) 0.352 0.350 0.379
(0.051)*** (0.057)*** (0.287) Ln(female students) 0.007 -0.010 0.011 -0.002
(0.024) (0.032) (0.029) (0.023) Ln(foreign students) 0.010 -0.002 0.011 0.012
(0.015) (0.022) (0.016) (0.014) Ln(faculty with PhD) 0.028 0.002 0.067 0.031
(0.041) (0.054) (0.045) (0.037) Ln(alumni faculty evaluation) -0.403 -0.569 -0.398 -0.345
(0.246) (0.261)** (0.290) (0.227) Ln(faculty per student) -0.005 -0.010 -0.002 -0.008
(0.015) (0.020) (0.017) (0.014) Ln(alumni facilities evaluation) -0.192 -0.201 -0.113 -0.185
(0.148) (0.162) (0.174) (0.129) Ln(alumni careers service evaluation) -0.222 -0.223 -0.144 -17.057
(0.083)*** (0.117)* (0.089) (8.149)** Ln(alumni programme evaluation) 0.147 0.340 0.173 0.161
(0.270) (0.358) (0.325) (0.196) Ln(alumni peers evaluation) 0.073 0.142 0.140 0.044
(0.209) (0.277) (0.231) (0.192)
Rank*careers 0.272
(0.065)***
Pre-MBA salary * careers -0.029
(0.243)
Age * careers 0.036
(0.042)
Work experience * careers -0.055
(0.040)
GMAT * careers 2.386
(1.053)**
US dummy * careers -0.014
(0.151)
R2 0.46 0.23 0.37 0.50
N 598 598 598 598
Number of universities 114 114 114 114
Years 2004-2010 2004-2010 2004-2010 2004-2010
33 Table 7: Public and Private Universities
(1) (2)
Public universities Private universities
Average age -0.011 -0.020
(0.006)* (0.010)**
Work experience 0.004 -0.000
(0.011) (0.010)
Ln(average GMAT score) 0.740 -0.165
(0.388)* (0.203)
Ln(Which MBA rank) -0.127 -0.072
(0.024)*** (0.023)***
Ln(pre-MBA salary) 0.369 0.251
(0.061)*** (0.082)***
Ln(female students) 0.027 -0.037
(0.026) (0.054)
Ln(foreign students) 0.006 0.017
(0.019) (0.021)
AACSB 0.039 -0.120
(0.045) (0.078)
AMBA -0.025 -0.135
(0.052) (0.140)
EQUIS 0.006 0.024
(0.041) (0.046)
Ln( faculty with PhD) 0.009 0.038
(0.099) (0.053)
Ln(alumni faculty evaluation) -0.543 0.127
(0.358) (0.358)
Ln(faculty per student) 0.005 -0.047
(0.018) (0.028)
Ln(alumni facilities evaluation) -0.172 -0.266
(0.201) (0.257)
Ln(alumni careers service evaluation) -0.136 -0.304
(0.091) (0.131)**
Ln(alumni programme evaluation) 0.378 -0.400
(0.273) (0.706)
Ln(alumni peers evaluation) 0.005 0.295
(0.221) (0.478)
R2 0.50 0.44
N 325 247
Number of universities 66 41
Years 2004-2010 2004-2010
34 Appendix A: List of Universities by Country
Country University-year
Observations
Universities Public
universities
Private universities
Independent universities
Australia 11 5 5
Belgium 9 2 2
Canada 22 8 8
China 4 1 1
Denmark 1 1 1
France 32 8 2 1 5
Germany 3 1 1
Hong Kong 16 3 3
Ireland 6 1 1
Italy 7 1 1
Japan 7 1 1
Mexico 3 1 1
Monaco 7 1 1
Netherlands 19 3 2 1
New Zealand 2 1 1
Singapore 12 2 2
Spain 25 4 4
Switzerland 7 1 1
UK 102 18 17 1
US 311 52 23 29
Total 606 115 67 41 7
35
Appendix B: Composition of Which MBA Guide Ranking
The table below shows the weights placed on each of the 21 components that make up the
Which MBA Guide ranking. In addition, each year’s ranking is a weighted average of the
current and previous two years’ data (50 percent for the current year, 30 percent for the year
before, and 20 percent for two years before). For each component that is assessed by alumni,
if the student intake is 43 or fewer, a minimum of 10 alumni responses is required for
inclusion in the Guide. If the student intake is 44 to 200, a 25 percent alumni response rate is
required. If the student intake is more than 200, a 50 percent alumni response rate is required.
Categories Components Alumni
Surveyed
Weight %
Careers Number industry sectors recruiting
students
8.75
% Graduates in jobs 3 months after graduation
8.75
% Graduates finding jobs through careers service
8.75
Did careers service meet expectations and needs?
Yes 8.75
Personal Development / Education Experience
Ratio of faculty to students 1.75
% Full-Time faculty with PhD 3.5
Average GMAT score 6.5625
Average length work experience 2.1875
International diversity of students 2.9155
% Women students 2.9155
Range overseas exchange programmes 2.1875
Number languages offered 2.1875
Faculty rating Yes 3.5
Rating of culture and classmates Yes 2.9155
Rating of programme content and range of electives
Yes 2.1875
Rating of facilities and other services Yes 2.1875
Increase Salary Salary change pre-MBA to post-MBA
(excluding bonuses)
Yes 5
Post-MBA salary (excluding bonuses) Yes 15
Potential to Network Ratio of registered alumni to current
students
3.3
Number overseas countries with official alumni branch
3.3