warwick.ac.uk/lib-publications
Manuscript version: Author’s Accepted Manuscript
The version presented in WRAP is the author’s accepted manuscript and may differ from the
published version or Version of Record.
Persistent WRAP URL:
http://wrap.warwick.ac.uk/112452
How to cite:
Please refer to published version for the most recent bibliographic citation information.
If a published version is known of, the repository item page linked to above, will contain
details on accessing it.
Copyright and reuse:
The Warwick Research Archive Portal (WRAP) makes this work by researchers of the
University of Warwick available open access under the following conditions.
© 2019 Elsevier. Licensed under the Creative Commons
Attribution-NonCommercial-NoDerivatives 4.0 International
http://creativecommons.org/licenses/by-nc-nd/4.0/.
Publisher’s statement:
Please refer to the repository item page, publisher’s statement section, for further
information.
Numerical simulation of flashing jets atomisation using
a unified approach
Konstantinos G. Lyrasa, Siaka Dembelea, Jennifer X. Wenb,∗
aDepartment of Mechanical and Automotive Engineering, Kingston University London, SW15 3DW, London, UK
bSchool of Engineering, University of Warwick, Coventry, UK
Abstract
The physics of the atomisation of flash boiling jets is known to be extremely
complex with plethoric interactions of different mechanisms in microscopic and
macroscopic level. Early studies describe both the mechanical and
thermody-namic effectes focusing on the influence of the initial pressure and temperature
on the spray characteristics. The resulting flashing jet usually emerges to the
low-pressure region with a high velocity and fragments to large blobs and
liga-ments which break up to droplets due to both mechanical and thermodynamic
effects. This paper presents a numerical approach for simulating the
atomi-sation of flashing liquids suitable for both primary atomiatomi-sation and secondary
break-up using the Eulerian-Lagrangian-Spray-Atomisation model coupled with
a pressure equation for the metastable jet. The proposed approach aims at
de-scribing the atomisation of superheated jets and the impact of bubble nucleation
at different stages and regimes inside the channel the liquid emerges from. The
changes in the regime outside the nozzle are discussed for varius cases of flashing
liquids providing insights for the interactions of the mechanisms that contribute
to the liquid fragmentation and the spray characteristics such as the droplet size
and velocity and the spray angle.
Keywords: flashing, boiling, atomisation, ELSA model
∗Corresponding author
1. Introduction
The disintegration of liquid jets from a high pressure region to a small
pres-sure environment is a process where multiple interactions take place. Depending
on the application a pressure drop may occur when the liquid flows through a
nozzle or a pipe. If the pressure drops below the vapour pressure, a rapid phase
5
change begins which is generally termed flashing. In case of pure cavitation,
the pressure recovers above the limit of the vapour pressure unlike the extreme
case of flashing in which pressure remains below the saturation pressure. Both
of these processes have multiple industrial applications in fuel spray injection
systems, health and safety in nuclear energy and in aerosol industries to name a
10
few. Prior research from Oza (1984) and Ishii (1975) suggest that flash boiling
is associated to three different processes, which are, bubble nucleation, bubble
growth and atomisation. In order to establish a modelling strategy for flashing
one has to give an illustration of the factors that contribute to this multi-facet
problem. Flashing of a liquid can occur when the fluid, initially being either
sub-15
cooled or saturated, follows an isothermal pressure drop or an isobaric heating
path respectively. As long as the liquid moves towards the low pressure region,
the pressure drops and upon reaching the liquid saturation curve it becomes
superheated yielding a wide range of droplet sizes stemming from an explosive
atomisation at the exit of the channel. In cases of a liquid flowing within a
20
channel, the fluid might be superheated inside or outside the channel depending
on the geometry and the thermodynamic conditions.
Experimental investigations on the nucleation kinetics report a different
re-sponse of the liquids in the temperature variations which corresponds to different
nucleation rates (Pavlov, 1988). The intensity of the bubble nucleation rate
gen-25
erally leads to an enhanced boiling and is a primary cause of change in the flow
regime which might be combined with a shattering of the jet attributing
explo-sive characteristics to the process. Previous studies have shown that even small
changes in temperature may alter the jet structure (Park and Lee, 1994). In
light of this, it is likely to have a two-phase jet inside the nozzle with a variety of
possible regimes (Sher et al., 2008; Park and Lee, 1994). A paradigm of the most
crucial parameters for bubble nucleation is the geometry of the nozzle the fluid
flows through (Park et al., 1997). Many studies have been carried out
regard-ing the expected regimes in industrial depressurisations applications (van den
Bosch and Waterings, 2005; Benajes et al., 2004; Yildiz, 2005; Cleary, 2008).
35
Usually, phenomenological approaches induced from experiments consider the
length-to-diameter of the nozzle to be the integral geometrical parameter that
influences the flow regime. The resulting jet can be thought as the outcome of
two mechanisms; the fluid instabilities (i.e. Kelvin-Helmholtz) and the boiling
conditions together with bubble nucleation. These mechanisms act within the
40
jet in a competing way and give rise to a violent disintegration, characteristic of
the flashing process. Flashing continues until the generated vapour has enough
energy to achieve equilibrium. Thermodynamic and mechanical effects act
in-side the jet and on the jet surface altering the jet shape and dynamics. The
pressure drops rapidly leading to a phase transition in cases of cavitation and
45
flashing. During flashing bubbles form and grow from the vapour clusters. The
changes that happen in a microscopic level vary locally in time and space and is
hard to define a characteristic spatial scale for the liquid structures. The liquid
break-up gives droplets with a spectrum of sizes from a droplet size (dmax) of
the order of some milimetres to a minimum size which can be thousands of times
50
less.
Various experimental works have been conducted the last three decades for
unravelling the mysteries of the liquid atomisation of flashing jets. Reitz (1990)
studied flash boiling atomisation of water under relatively small pressure (pinj)
and different initial temperatures (Tinj). The jet was well atomised giving small
55
sized droplets that dispersed downstream the nozzle exit. The majority of the
droplet sizes was measured to be around 100µm. The flow was bubbly with a
two-phase jet observed outside the nozzle with minimum and maximum droplet
diameters varying around two orders of magnitude. The droplet diameter
de-creased along the radial direction by contrast to the trend at the axial direction.
60
propane jets. The diameters measured, were within the range of some microns
up to 500µm for a storage pressure of 6 bar. Some insights for the velocity
profiles across the jet were obtained. The velocity had a characteristic bell
shape with a maximum at the jet centreline. The velocity decreased moving
65
further away the nozzle exit while preserving the same shape. The change in
the regime of the jet was observed. The change in the measured drop sizes was
attributed to the bubbles that burst each other giving new drops with smaller
diameter. Park and Lee (1994) using flashing water provided some interesting
details regarding the anatomy of flashing jets. The droplet sizes were measured
70
at various locations at the radial direction. The higher size at the jet centreline
indicated an intact liquid core which progressively disintegrated across the
ra-dial and axial directions. Similar velocity profiles at different locations are also
reported in the literature in the work of Yildiz (2005) for flashing R134A jets
with high degrees of superheat. Although the velocities at the radial direction
75
of flashing jets tend to follow the same trend as non-flashing jets (as illustrated
in (Abramovich, 1963), the axial behaviour of velocity is expected to change
regarding if flashing happens inside or outside the nozzle.Hervieu and Veneau
(1996) provided some results for the jet shape of flashing jets for propane
re-leases but did not include details for the spray angles. Park and Lee (1994)
80
illustrated the spray angle and how it changes with respect to the initial flow
conditions. They showed that the spray angle increased while increasing the
initial temperature with values smaller to 90oC. Recently, Wang et al. (2017)
studied the effect of the internal flow patterns in the spray dynamics. In their
study for flashing R134A jets the flow was bubbly for relatively small storage
85
pressure (p ≤ 15bar) with nucleation occurring at random locations and the
spray angle increasing for higher pressure.
Empirical models for the spray properties of superheated consider the
ge-ometry and initial conditions jets in a zero-dimensional correlations (Johnson
and Woodward, 1999; van den Bosch and Waterings, 2005; Witlox and Bowen,
90
2002). A common practice to tackle the varying thermodynamic effects which
the release process. The isenthalpic and isentropic assumptions are possible for
the expansion region of the flashing jets. In the isenthalpic formulations the
change in the kinetic energy is small compared with the enthalpy change. On
95
the other hand, in case of isentropic conditions either the momentum equation
is replaced with an entropy equation or the energy equation is substituted in
favour of well-established isentropic relationships. The shortcomings of the
isen-thalpic and isentropic assumptions are not apparent and there is an ambiguity
in the literature regarding the assumption to be made for flashing expansion.
100
The most recent state of the art three-dimensional CFD studies for flashing,
including the HRM model, are implemented following Schmidt et al. (2010).
Moulai et al. (2015) and Duke et al. (2015) used HRM and successfully calculated
the mass flow rate and the liquid penetration. Price et al. (2016) used an
evaporation model for simulating flashing jets using Lagrangian particle tracking
105
with the droplet shape changing due to flashing providing validation for the
liquid penetration. Characterisation of the spatial scale of the liquid blobs and
ligaments is still an ongoing research topic and poses significant challenges due
to the multi-scale nature of the process.
The complex interactions during the atomisation of superheated jets pose
110
the biggest challenge for three-dimensional CFD models for calculating the size
and velocity of the droplets. One of the major difficulties for modelling the
atomisation of superheated jets regarding physics is the metastable two-phase
mixture that occurs during depressurisation. This paper presents a
numeri-cal approach for simulating the atomisation of flashing liquids accounting for
115
the distinct stages, from primary atomisation to secondary break-up to small
droplets using the Eulerian-Lagrangian-Spray-Atomisation model coupled with
the HRM. The Σ-equation is implemented and solved in a fully Eulerian
ap-proach for tracking liquid structures of any shape, and computes the spray
characteristics. A modified version for the transport equation of the surface
120
density is used and a new source term accounting for the changes in Σ due to
evaporation in both dense and dilute spray regions is added. The HRM is a
be easily implemented in an Eulerian framework taking advantage of the more
detailed repsresentation of the primary atomisation region in such appproaches.
125
An algorithm that links the standard pressure-velocity coupling algorithm to
the HRM and volume of fluid method is used as a basis to simulate cryogenic
and water jets (Lyras et al., 2018). The method has been previously derived for
examining the internal flow regimes of superheated liquids and is coupled here
with a spray model for modelling atomisation.
130
The proposed approach has the advantage of avoiding the unrealistic
com-mon assumption of pure liquid rather than a mixture at the nozzle exit. It
models the change in the regime inside the nozzle treating flashing in a unified
approach simulating the metastable jet both inside and outside the nozzle.
Im-portant mechanisms such as thermal non-equilibrium, aerodynamic break-up,
135
droplet collisions and evaporation are modelled in a novel atomisation model.
Results for turbulent flows for superheated liquids are presented showing that
the proposed approach can accurately simulate the primary atomisation.
2. Numerical modelling of flash boiling
2.1. Non-equilibrium vapour generation
140
The vapour mass fraction (denoted asxhereafter) is calculated for both the
internal flow and atomisation region. Introducing the transport equation in a
compressible framework with a mixture density ρ and a velocity field uj it is
given as,
∂ρx ∂t +
∂ρujx ∂xj
= Γ (1)
The term Γ stands for the vapour generation rate. Vapour mass fraction is
145
changing through time and space and needs to be modelled for closure.
Fol-lowing Downar-Zapolski et al. (1996) as first approximation,xcan be assumed
dependent on pressure. The HRM is written in the following way,
Γ =−ρ
x
−xeq
Θ
(2)
This is first order approximation to Γ using Taylor series expansion. This
formulation attains an exponential tendency for the system from an initial state
x0 to equilibrium through time,
x=xeq(1−e−
t
Θ) +x0e−
t
Θ (3)
The equilibrium value for the vapour mass fraction can be calculated as,
xeq=
h−hl,sat hv,sat−hl,sat
(4)
In this formulation, hl,sat, hv,sat are the saturated enthalpies of liquid and
vapour state. The timescale for the model is calculated as,
Θ = Θ0α−0.257ψ−2.24 (5)
The non-dimensional pressure ψ is equal (psat−p)/psat. The timescale Θ is
150
a function of the constant Θ0 = 6.51×10⁻⁴[s] and local densities. The void
fraction is calculated from the liquid and vapour densities ρl, ρv as α= (ρl−
ρ)/(ρl−ρv). The last two equations have been derived from Downar-Zapolski
et al. (1996) for water jets at initial pressure up to 100kP a. The low-pressure
correlation for HRM has been used before for superheated R134A Lyras et al.
155
(2017).
2.2. Pressure calculation
The concept of the pressure equation is to create an equation that
encapsu-lates all the processes involved in the fluid flow motion. The algorithm of Lee
et al. (2009) and Schmidt et al. (2010) has been used as a basis. Since density is
a function of pressure, temperature and quality,ρ=ρ(p, h, x). Following Bilicki
and Kestin (1990), the material derivative of density becomes
Combining with the continuity equation
−ρ∂ui ∂xi Dρ Dt = ∂ρ ∂p h,x Dp Dt + ∂ρ ∂h p,x Dh Dt + ∂ρ ∂x p,h Dx Dt (7)
The momentum equation in a matrix notation following Jasak (1996) is
aPuP =H(uj)− ∂p ∂xi
+Fσ (8)
In this formulation,aP is the diagonal coefficients tensor for a cellP andH(uj)
is the coefficient matrix for all the neighbours ofP including other source terms
except for the pressure gradient. Solving foruP (denoted withuhereafter) and
substituting to Eq.(7) a matrix equation for pressure is obtained
ρ ∂ ∂xj
1
ap H(uj)
f
−ρ ∂ ∂xj 1 ap ∂p ∂xi
+ρ ∂ ∂xj 1 ap Fσ + ∂ρ ∂p h,x Dp Dt + ∂ρ ∂h p,x Dh Dt + ∂ρ ∂x p,h Dx Dt = 0
(9)
The operator ()f stands for the interpolation to the cell faces. In cases of air
entrainment to the mixture another term can be added to this last equation.
Introducing an indicator function γ for the mixture (liquid and its vapour)
(γ = 1 for no air and γ= 0 in case of no mixture) and substituting the HRM
expression the pressure equation becomes
ρ ∂ ∂xj
1
ap H(uj)
f
−ρ ∂ ∂xj 1 ap ∂p ∂xi
+ρ ∂ ∂xj 1 ap Fσ + ∂ρ ∂p h,x Dp Dt + ∂ρ ∂h p,x Dh Dt + ∂ρ ∂x p,h
x−xeq
Θ + ∂ρ ∂γ Dγ Dt = 0
(10)
This equation is used for the pressure update (without the pressure gradient
cor-rection) and includes the effects of the surface tension, thermal non-equilibrium
and multiphase mixing (Lyras et al. 2018). In this paper an additional term
for thermal expansion is incorporated. The densities of each phasekwith
com-pressibility Ψkare calculated using a linear approximation from a reference state
(saturation conditions) of the following form
ρk =ρref + Ψk(p−pref) (11)
2.3. Interface tracking
The volume of fluid (VOF) approach is used here to capture the interface
be-tween the liquid and gaseous phases. VOF method is a distinct interface
captur-ing method for resolvcaptur-ing the inter-phase dynamics (Prosperetti and Tryggvason,
2009). Surface forces due to liquid-gas interfacial instabilities can be significant
for the spray dynamics (Crowe, 2005). VOF has been employed before for
cav-itating flows by Ishimoto et al. (2008), Edelbauer (2017) and Srinivasan et al.
(2010) and for non-evaporating sprays by Tomar et al. (2010) and Ling et al.
(2015). In cases of mass transfer due to phase change, the interface changes
through time and space at any direction. This is included in the continuity
equation and consequently in the pressure equation. The liquid mass fraction
is updated first for the VOF term in the momentum equation in favour of the
volume fraction which is generally recommended in incompressible flows (Jiang
et al., 2010). The continuum surface force (CSF) of Brackbill et al. (1992) is
used to calculate the surface tension force in the momentum equation. This
force is acting on the liquid-gas interface and is explicitly calculated as
Fσ =σκ∇φl (12)
The liquid volume fractionφlis calculated from the mass fraction of the liquid
according to Lyras et al. (2018). The surface tension is denoted withσand the
curvature of the interface withκand is given by
κ=−∇ ·
∇φ
l
|∇φl|
(13)
This expression is added to the pressure equation. The HRM and VOF are
160
naturally coupled together addressing different inherent physical phenomena.
This is a volume conservative formulation and is adopted for both the flow
inside the channel and the primary and secondary break-up.
3. Liquid atomisation
The characterisation of liquid atomisation can be considered as a problem of
space. In two phase flows (liquid and gas) the two fluids are separated by
an interface. The presented method in this paper considers liquid/gas cases,
al-though the same method applies to two immiscible fluids e.g. two liquids
(Lhuil-lier, 2003). The interface is a two-dimensional surface in the three-dimensional
space. The representation in spacex= (x, y, z) and timetof this surfaceS can
be done through a geometrical constraintF(x, t) = 0 (Aris, 1962). The phase
indicator function can be defined via a Heaviside functionH() (Prosperetti and
Tryggvason, 2009) as
φl(x) = 1−φg(x) =H(F(x), t) (14)
For each phasek, liquid (l) or gas (g), φk = 1 if and only if xlies inside phase
k. The velocity at the surface S is then uc = (∂x/∂t)S. Since the function F
becomes zero at the interface, its material derivative is zero
∂F ∂t +uc·
∂F ∂xj
= 0 (15)
From the last two equations it is clear that every velocity field with the same
normal component will produce the same same motion of the interface. Since
the normal unit vectors arenl=−ng=∇F/|∇F|, this normal velocity is equal
touc·nl =−uc·ng = (1∂F /∂t/|∇F|). Recalling the definition of the phase indicator
φk, for each phasek, ∇φl=−∇φg=δ(F)∇F where δ() is the Dirac function.
Now the local instantaneous interfacial area concentration (fine-grained surface
density) δI can be defined as δI ≡ −nk · ∇φk =δ(F)|∇F|. This definition is
employed from Marle (1982), Kataoka et al. (1986), Lhuillier (2003) and Morel
(2007). Using the microscopic velocityuc, Lhuillier (2003) has demonstrated an
equation for the evolution ofδI using the following transport equation
∂δI δt +uc·
∂δI ∂xj
=−δIninj: ∂uc ∂xj
(16)
Following Ishii (1975) and Delhaye (1976) the ensemble average of δI is equal
to the integral of the fine-grained surface density over a volumeV with surface
S which is equal to the surface density Σ(x, t) =< δI >= V1 RV δIdV = S(Vx,t).
is equal to the fluid velocity uj. Integration of Eq.16 over V and using the
definition of Σ leads to an equation for the surface density
∂Σ
∂t +uj· ∂Σ
∂xj
=−Σninj : ∂ui ∂xj
(17)
Because of the complex motion of the interface, the associated quantities
re-165
sponsible for the description of Σ such as the interfacial stress or the interfacial
orientation tensors need to be averaged. Hence the average Σ in space is used
hereafter.
3.1. An equation for surface density
The equation for the evolution of the surface density in time and space Eq.17,
contains in the RHS all factors that cause changes in a macroscopic level. The
surface can be produced and destroyed by different dynamic processes happening
during the atomisation. Vallet and Borghi (1999) illustrated a model for the
including the effect of these processes in Σ. This approach, the so-called Σ−Y
model was established in an Eulerian framework and gave rise to the
Eulerian-Lagrangian-Spray-Atomisation (ELSA) method (Vallet et al., 2001). In this
paper the model proposed by Menard et al. (2006) and modified by Lebas et al.
(2009) is used as basis. The model defines different source terms which describe
the surface change due to turbulence, aerodynamic break-up and evaporation.
Here, the model is written spliting the evaporation term into a dense and dilute
part (Svap,den, Svap,dil) as
∂Σ¯
∂t + ∂u˜jΣ¯
∂xj
= ∂
∂xj
ν
t Sct
∂Σ¯
∂xj
+ Ψ (Sinit+Sturb+Svap,den) +
(1−Ψ) (Scoll+S2ndBU+Svap,dil)
(18)
The Reynolds average, ¯Σ is used and ˜uj is the mass weighted Favre average
of velocity. The model consists of several source terms on the RHS, which are
associated with different processes that might have an impact on the
atomi-sation. This approach extends the original model of Vallet and Borghi (1999)
considering different and more mechanisms which can potentially alter the
Here, they are split for the dense and dilute part of the spray using an indicator
function Ψ which is equal to one if the liquid mass fraction, ˜Ylis between 1 and
0.5 and is zero for cells with a liquid mass fraction less than 0.1. The indicator
function can be written as a function of the liquid volume fraction,φl, where
φl= ¯ρY˜l/ρ¯l as,
Ψ(φl) =H(φl−0.1)H(φl−0.5) + (H(φl−0.1)−H(φl−0.5))(2.5φl−0.25) (19)
where H() is the Heaviside step function. In an analogy of the Σ-equation of
Vallet and Borghi (1999) a primer approximation for the terms on the RHS is
to write them in the form
S= ¯ Σ
τΣ
1− ¯Σ¯ Σeq
(20)
where ¯Σeq, τΣ are an equilibrium value for the interface and the time-scale of
170
the corresponding process. A shortcoming of this restoration equilibrium model
is that it is not well defined when no perturbations are present since at rest
¯
Σeq = 0 which implies that for a finite time-scaleτΣthe surface will be destroyed
infinitely fast. The term Sinit corresponds to the minimum liquid-gas surface
produced in the atomisation process and is larger where the gradient of liquid
175
mass fraction is higher. By the definition of ¯Σ, this minimum interface has
to be proportional to the inverse of the integration kernel which can be also
associated to the characteristic turbulent spatial scales. Following Menard et al.
(2006) and assuming that the first blobs that form will be approximatelly of
the scale of lt, it is Sinit = Yl(1−Yl)/lt with the limiting case where liquid
180
mass fraction becomes small where the minimum production of interface is a
function of the liquid mass fraction gradient,Sinit= 2Scµttρlρ6 ¯ρglt∂
˜
Yl
∂xi
∂Y˜l
∂xi. Sturbis
the term responsible for the production or destruction of the interface density
due to stretching caused by turbulence and collisions/coalescences in the dense
part of the spray and is calculated using a formulation similar to Eq.20. It
185
is assumed that interface will be created or destroyed due to turbulence until
Σ reaches an equilibrium value, Σ∗turb which is defined from an equilibrium
turbulent time-scale τt for this process, in case of
Reynolds-Averaged-Navier-Stokes (RANS), is equal tok/for the k- turbulence models and for the k-ω
190
models it isτt= 1/ω, where k, , ω are the turbulent kinetic energy, turbulent
kinetic energy dissipation and the specific turbulence dissipation respectively.
In Large-Eddy-Simulations (LES) the turbulent time-scale is τt = ||Sij||−1,
where Sij is the strain rate tensor. The source terms Scoll and S2nBU for the
surface creation/destruction due to collisions and the surface production due to
195
secondary break-up in the dilute spray region are updated using the restoration
equilibrium equation with different time-scales, τcoll, τ2ndBU respectively. The
equilibrium time-scales forScoll isτcoll= 1/Σ¯
p
2k/3 and the equilibrium Σ∗coll
for the collision-coalesence source term is calculated according to Lebas et al.
(2009). The equilibrium timescale for S2nBU is done using the experimental
200
work of Pilch and Erdman (1987) in case of the secondary break-up and the
equilibrium Σ∗
2ndBU is calculated for a Weber number equal to 12 at the limit of
Ohnesorge number equal to zero (Pilch and Erdman, 1987; Lebas et al., 2009).
More details for the source termsSinit, Sturb, ScollandS2nBU are provided from
Lebas et al. (2009).
205
Evaporating sprays
Finally, the last term in Eq.(18) areSvap,den, Svap,dil, which are responsible
for the change in interface density due to evaporation. These terms are usually
omitted in the literature since there is no available model valid for all the spray
regions. In cryogenic superheated liquids such as R134A, evaporation could
be important and can be influenced by mechanical effects. The distinction to
dense and dilute contribution for the evaporation source term is proposed here
for the first time since different conditions for the dense and dilute regions are
acknowledged (Faeth, 2002). Accepting the classical view, drop evaporation
dominates dilute sprays in the same way break-up dominates dense sprays.
Hence, Svap,dil might have a contribution to the equation for Σ comparable
structures that occur in the flow can be considered to be spherical droplets.
Then it is
Svap,dil=fv,s
¯ Σ2
ρ (21)
The logic behind this formulation is that the term fv,s is the mass transfer
due to vaporisation per surface and is multiplied with the surface per area and
surface per volume. The mass flux at the surface of a droplet of radius rs is
fv,s =mv/4πr2s, where mv is the mass vaporisation rate typically taken from
a droplet evaporation model. From Abramzon and Sirignano (1989) one gets
mv = 2πρgD32Dln(1 +BM)Sh∗, whereBM =Yl/(1−Yl) is the mass transfer
number (Spalding number). The modified Sherwood number,Sh∗ depends on
the flow characteristics, Sh∗ = Sh∗(Re, Sc) and is a function of Sherwood,
Reynolds and Schmidt numbers. The modifiedSh∗is calculated as in Abramzon
and Sirignano (1989). Substituting the expression ofD32 one gets
Svap,dil=−
DSh∗ln(1 +BM)
6Yl
ρ
lρg ρ2
¯
Σ3 (22)
The above expression has units [1/ms]. It is important to mention that this
formulation depends on the drop evaporation model expression that is used in
each case. Ignoring the vapour film around the droplet, we can assumeSh=Sh∗
and the vaporisation model of Spalding (1953) can be retrieved. In the dilute
region of the spray, we expect that evaporation on the drop surface leads to
surface reduction alongside with the droplet radius decrease justified by theD2
-law. Consequently, a minus sign is included on the RHS of the above formula.
The terms containing Yl in Eq. 22 form a function of Yl that tends to 1 for
Yl→0 and the source term scales toKΣ3, whereK=DSh∗/6. Regarding the
dense part,Svap,den, a simple correlation is introduced here, originally proposed
in Lyras et al. (2017),
Svap,den=
¯ Σ Θ
x
eqρeq
ρ −x
(23)
where the ρeq is the density at the thermodynamic equilibrium. Since in the
primary atomisation region the liquid core is likely to remain in a metastable
in Eq.23. The time-scale Θ can be used regardless the boiling mechanism one
might assume for the numerical simulation, e.g. homogeneous or surface boiling.
The evaporation source term contribution in the surface density equation is then
summarised as
Svap= Ψ
Σ¯
Θ
x
eqρeq
ρ −x
+ (1−Ψ)
−Kln(1 +BM)
Yl
ρ
lρg ρ2 ¯ Σ3 (24)
The Σ-equation can now be written in its full form as
∂Σ¯
∂t + ∂u˜jΣ¯
∂xj = ∂ ∂xj ν t Sct
∂Σ¯
∂xj
+ Ψ
Y
l(1−Yl) lt
+Σ¯
τt
1− ¯Σ¯ Σ∗turb
+ Σ¯ Θ
x
eqρeq
ρ −x
+ (1−Ψ)
Σ¯
τcoll
1− ¯Σ¯ Σ∗coll
+ ¯ Σ
τ2ndBU
1− ¯ Σ¯ Σ∗2ndBU
−Kln(1 +BM)
Yl
ρ
lρg ρ2 ¯ Σ3 (25)
The developed method is implemented within the open source CFD code
Open-FOAM (Weller et al., 1998). Typically a second order bounded scheme is used
to solve this equation together with a van Leer limiter. The method presented
in the previous chapter for calculating the pressure is naturally coupled with
210
the modified version of ELSA model proposed here. The vapour mass fraction
equation is solved prior to the surface density equation calculating the mass
frac-tions and the related source terms in Eq.(18). The HRM and modified ELSA
are coupled for the first time with interface tracking to simulate superheated
liquid jet atomisation. The PIMPLE algorithm, combination of the PISO and
215
SIMPLE algorithms, (Ferziger and Peric, 2001) is used to couple pressure and
velocity in a segregated manner. After calculating x with Eq.(1) the matrix
H(uj) which contains all the terms the momentum equation, except for the
gradient of pressure, is updated and is used to calculate the fluxes without the
contribution of∇p. The pressure equation is solved including the contributions
220
of surface tension, thermal non-equilibrium e.t.c. and a new velocity field is
ob-tained which will be relaxed (under-relaxation factors for pressure, velocity and
surface density were within the range of 0.3 to 0.7). In most of the simulations 5
to 8 PISO loops were used with 1 to 3 outer loops for updating theH(uj) matrix
using Courant numbers up to 2.2. Fixed values for pressure and velocity were
225
Lelef (1992) forpand zero gradient foruat the low-pressure farfield (two-phase
jet outlet). For LES velocity and viscocity boundary conditions are set following
Montorfano et al. (2013). A second-order bounded scheme (Jasak et al., 1999)
for the convective terms was used for the calculations. The scheme is a blend
230
of upwind and central scheme using a smooth transition between the low order
to the second order scheme offering a good trade-off of accuracy and stability.
Second order schemes with a linear correction were used for the gradient terms.
The variables are stored in the cell centres in a co-located arrangement and they
are interpolated at the cell faces.
235
4. Results and discussion
Results from numerical simulations regarding flashing R134A (1,1,1,2 –
Tetraflu-oroethane: CF3−CH2F) are presented first. The experimental domain
con-sists of a high-pressure region where R134A is stored at a pressure above its
vapour pressure at ambient conditions (663kP aat 293.15K). The liquid passes
240
through a nozzle of diameterDand lengthLand is released into a low-pressure
region which is equal to the atmospheric pressure.
4.1. R134A jets: Zhou et al. (2012) experiment
Previous expermental studies describe that flashing might start either inside
or outsied the channel it emerges from, depending on the channel geometry
245
and superheat conditions. Yildiz (2005) observed that for smallL/Dthe axial
velocity does not change in the vicinity of the nozzle exit. The reported large
values of droplet Sauter mean diameter (SMD) might be an indication that the
jet flashed outside the nozzle. On the other hand, internal flashing with forming
bubble nuclei might lead to more catastrofic flow patterns that influence the jet
250
dynamics. It is of major importance to investigate these changes in the spray
patterns with respect to macroscopic changes. For this reason, the experimental
work of Zhou et al. (2012) is studied here. In this experiment, R134A flows
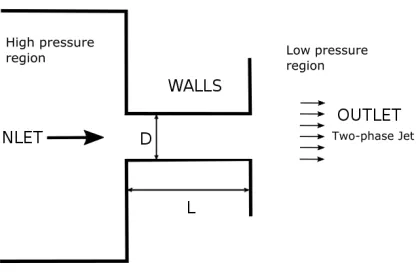
The domain used for simultions is shown in Fig. 1. The spray characteristics,
255
the velocity and the Sauter mean diameter at various positions were measured.
The flow patterns inside the nozzle were not studied in the experiment. Both
RANS and LES framework were used. In Fig. 2 an example of small-scale
LES simulations is shown for the experiment. The iso-contours of ˜Yl = 0.28
are included to illustrate the very first stages of the liquid jet atomisation.
260
The outlet patches of the simulated domain were far enough, typically in more
than 50D distance from the jet axis in the radial direction, and at 193D from
the nozzle exit. RANS results are presented here for validation. The results
were taken until steady state reached and any boundary effect at the far-field,
downstream the nozzle has negligible impact. All the physical parameters of the
265
experiment are listed in Table 1. The axial velocity profiles are shown in Fig. 3
as a function of the radial distance at two different positions. The axial velocity
takes its maximum at the jet centreline in all cases. This is in accordance
to the experimental and theoretical studies (Abramovich, 1963). An obvious
differentiation occurs for the rate of the velocity decrease moving towards the jet
270
periphery. The results indicate that the distance from the nozzle exit plays a role
in the jet dispersion. Axial velocity decreases faster closer to the release point
x= 50mm (x/D = 61.7), compared to the position x= 90mm (x/D = 111)
where velocity changes in a smoother manner. This smaller gradient in the
largest distance results indicates a more uniform jet morphology in the droplet
275
cloud. The maximum predicted axial velocity at the x = 50mm position is
around 35 m/s. The spray velocity starts to increase fast (in the so-called
expansion zone) and becomes maximum and then decreases again (entrainment
zone). The maximum at the numerical results occurs at approximately x=60mm
(x/D = 60) whereas in experiments the peak value was observed for a small
280
number of particles in x=40mm (x/D= 49). This increase in the axial velocity
of the spray was not observed in Allen (1998) and a small increase in Yildiz
(2005) was reported. The axial velocity is shown in Fig. 4. The jet, after
emerging at the low-pressure region, is a dense spray consisting of droplets
moving through a vapour cloud, which is a direct consequence of the evaporation
mechanism. The acceleration of the droplets is attributed by the authors of
the experiment, to the explosive character of the atomisation of the cryogen.
Up to the maximum velocity point, the liquid core might be considered to be
practically intact. The velocity starts to decrease due to drag forces which
prevail over the inertia forces and govern the droplets’ kinematics. From a
290
numerical point of view, this acceleration imposes some major challenges in
terms of stability and an under-relaxation procedure is recommended. The
rapid increase and decrease in the axial velocity might cause weakness to the
pressure-velocity coupling, and a good choice of turbulence model from the
k-ω family with near-wall treatment is required. Here the SST-k−ω model of
295
[image:19.612.200.408.333.469.2]Menter (1993) is employed.
Figure 1: Schematic of the domain used in simulations. The superheated liquid flows through
the channel and exits at the low-pressure region as a two-phase jet.
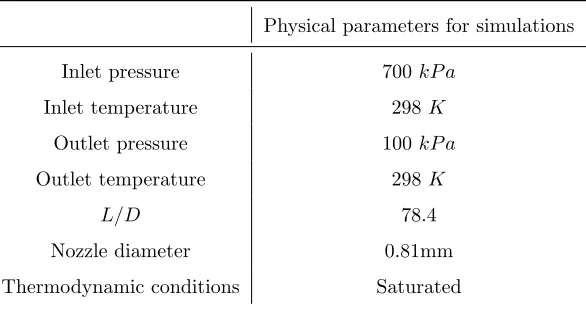
Figure 2: Snapshot of iso-contour ˜Yl for LES simulations at the first 5mm of spray motion
downstream the nozzle exit. A mean cell size equal to 4µmwas used close to the nozzle exit.
Table 1: Physical properties for simulations.
Physical parameters for simulations
Inlet pressure 700kP a
Inlet temperature 298K
Outlet pressure 100kP a
Outlet temperature 298K
L/D 78.4
Nozzle diameter 0.81mm
Thermodynamic conditions Saturated
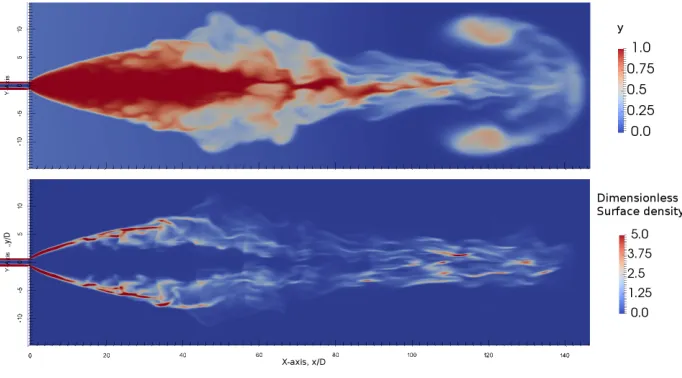
shown in Fig. 5. Quantifying the size of ligaments and blobs that form within
the jet is not a trivial task. The limited visibility of the moving particles and the
need for non-intrusive measurement techniques makes the experimental
charac-300
terisation of the mean droplet size extremely difficult. Statistical analysis of the
Phase Doppler Particle Analyzer (PDPA) results gave the SMD which is used
for comparison here. Fig. 5 shows the radial variations of SMD forx/D= 61.7
andx/D = 111. The model overestimated theD32 closer to the jet centreline
and showed good agreement after 1.5Ddistance in the radial direction. This
be-305
haviour is reasonable and appears in other numerical studies (Vallet et al., 2001).
This can be caused due to the numerical parameters used in the Σ-equation and
the source terms in particular. The equilibrium values are also subject to
nu-merical tuning. The difference might also be an indication for changing the
HRM constants for R134A. The HRM contribution is both in the pressure
up-310
date and equation Eq.(18). A slightly increasing trend in theD32 observed in
the experiments is also captured from the atomisation model. Fig. 5 illustrates
the multi-scale character of flash-boiling atomisation. The nozzle length of the
experiment wasL= 63mm. Moving along the nozzle, the flashing inception
be-gins in the internal flow, and one might reasonably assume that at some point
315
the regime transition from pure liquid to a dispersed flow happens. The size
Figure 3: Radial velocity at x=50, 90mm. Comparison with Zhou et al. (2012).
and drops due to mechanical and thermodynamic effects becoming O(10−6)m
at the measured axial positions and at the radial direction. Hence, the average
particle size can be reduced to one thousand times its original size.
320
The reason for this reduction in spatial scale of the blobs and droplets can
be attributed to the explosive character of the atomisation. This character is
fundamentally associated with the flashing mechanism which starts inside the
nozzle. Results in Fig. 5 forD32 simulating the same experiment but without
considering the internal flow reveal a higher deviation with experiments atx=
325
50mm but smaller in the x = 90mm position. Exclusion of the internal flow
simulation tends to under-predict the SMD atr/D= 3 and afterwards for both
positions. The droplets emerge to the atmosphere at a temperature higher than
the saturation temperature and become locally superheated. This metastable
state follows a violent liquid fragmentation (explosive atomisation) with new
330
smaller droplets. Moving further away from the nozzle exit, the flow is expected
to become more uniform, with droplet evaporation becoming more important.
Figure 4: Distribution of dimensionless axial velocity along the jet centreline,ux/umax.
of the jet become smaller until they are practically negligible. Under these
conditions, the mean surface density decreases (Fig. 6) which
335
[image:22.612.138.471.364.554.2]Figure 6: Distribution of dimensionless liquid and vapour mass fraction,yand surface density,
Σ/Σ0 along the jet centreline.
means that the SMD becomes bigger (D32 ∝ 1/Σ), hence the increasing¯
trend in Fig. 5. In Fig. 6 the surface density is shown normalised with a
theoret-ical initial value Σ0= 1/∆3 where ∆ is the LES filter used in the simulations.
This is the value that Σ will scale with a very fine mesh, Navarro-Martinez
(2014). This value is expected to be the upper limit for Σ in dilute regions
340
where only small blobs and droplets exist (sub-grid scale). Comparing the
re-sults inD32with the experimental findings of Yildiz (2005) one might elucidate
the impact of the nozzle length-to-orifice ratio on the spray dynamics. The
av-erageD32in the experiment considered here (L/D= 78.4) for a long nozzle was
less than 15µm whereas for an inlet pressure approximately 8bar and a short
345
nozzle withL/D= 2 the measured average droplet sizes were much higher and
remained always greater than 50µm. The nature of the relationship between
L/D and SMD was studied by Yildiz (2005). In particular, atx/D = 110 the
higher values of D32 for the longer nozzle were justified from the incomplete
atomisation that occurred inside the nozzle for the case of nozzles with larger
350
the internal flashing is expected to cause bubble nucleation and bursting earlier,
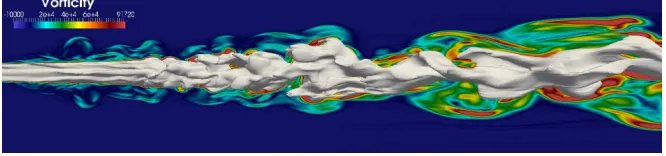
giving in general smaller droplet sizes. A three-dimensional caption of the liquid
[image:24.612.138.471.194.272.2]jet atomisation for shorterL/D= 4 using LES is presented in Fig. 7.
Figure 7: Iso-contour for y=0.47 with the magnitude of vorticity using LES for the first 10mm
of the spray. The physical parameters are the same as in Zhou et al. (2012) but for shorter
nozzleL/D= 4.
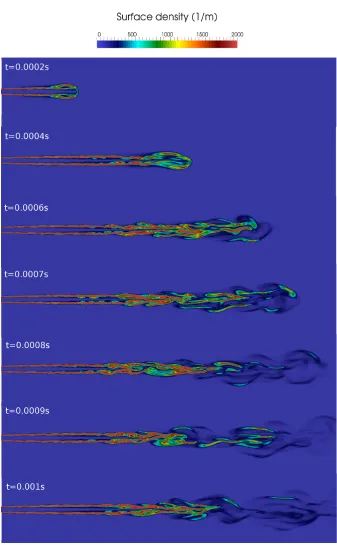
4.2. Water experiments: Park and Lee (1994)
355
The next flashing scenario examined was for water jets flowing through sharp
nozzles. The classic experiments of Park and Lee (1994) are considered here.
The test cases were for small pressures up to 4bar and initial temperatures up
to 125oC. A long nozzle was used which offers an opportunity to study the
internal flashing mechanism. All the major physical properties for the
sim-ulations are listed in Table 2. LES was tested for simulating the internal
flow and the primary atomisation region up to a distance 7D. The
Smagorin-sky model was used and the sub-grid-scale Reynolds stress, τsgs is modelled
as τijsgs −1/3τkksgsδij = 2µtS¯ij. The sub-grid-scale eddy viscosity can be
de-rived by dimensional arguments to be equal to µt = CS2ρ∆
2 k S¯ k, where
k S¯ k= ( ¯SijS¯ij)1/2. Here, a low value of the constant CS = 0.065 is used,
recommended for channel flows. Results shown in Fig. 8 for the liquid-gas
in-terface show the gradual liquid fragmentation though time. The long channel
and the low inlet pressure resulted in an increased residence giving time for
bubbles to form, burst and collapse signalling a regime change. The growing
waves acting on the jet start to influence the jet and the result of these
Rayleigh’s theory (is more clear here after t=0.0006s). Moving further
down-stream the nozzle exit, the liquid surface decreases due to large ligaments and
blobs shedding to smaller structures. The authors of the experiment
investi-gated a thorough analysis for determining primarily the relationship between
the superheat degree and the spray characteristics in low pressure flashing jets.
In their study they concluded that for long nozzles bubble nucleation starts at
the walls region. They distinguished three regimes for the internal flow:
bub-bly, annular and slug. They observed that for low superheat degrees the bubbly
regime is sustained across the nozzle with bubble formation and growth moving
towards the nozzle exit. The bubbles burst outside the nozzle fragmenting the
liquid core into ligaments. The intact liquid core becomes shorter with
increas-ing the superheat degree. In this case the bubble nucleation inside the nozzle
was reported to be more extensive, predicating a slug or annular regime for the
channel flow. During the primary atomisation process in slug regime, the slug
bubbles that form from smaller bubbles that collide and coalesce, burst into
lig-aments. On the other hand, in the annular regime the liquid phase was moved
towards the walls and then an enhanced disintegration downstream the nozzle
exit due to the interactions with the vapour core gave generally smaller SMD
values for the droplets. The numerical results in Fig. 9 seem to agree with the
observations of Park and Lee (1994) that increasing the degree of superheat,
the SMD decreases, at least for a constant pressure. Fig. 9 illustrates the mean
SMD value at the radial direction at distancex= 50mm(x/D=33.3). Results
are plotted using the normalised superheat degree ∆ˇTsh with respect to the
ambient conditions (out)
ˇ ∆Tsh=
Tin−Tsat(pout) Tsat(pin)−Tsat(pout)
(26)
Small values of ˇ∆Tshindicate a non-superheated state of the liquid jet and for
ˇ
∆Tsh = 1 the liquid boils inside the storage vessel. The results show good
agreement for higher superheat degrees. The deviation for ˇ∆Tsh= 0.2 could be
associated to the higher residence time inside the channel and the Σ-equation
constants. The impact of the initial storage pressure is illustrated in the
imental and numerical results. Bubble nucleation appears to attain a random
occurrence pattern. Pressure change might also alter the jet stability, with
higher pressures leading to a more stable regime (Wang et al., 2017). For the
same pressure (p=3bar) increasing ˇ∆Tshreduces the SMD. This could be
con-nected to the number of bubbles inside the nozzle which is expected to increase
365
with increasing the superheat degree since the surface tension of the vapour
decreases with a consequent decreasing for the departure diameter for the
bub-ble (Hutcherson et al., 1983). Hence, the internal flow becomes more bubbly.
In the numerical results, the mean SMD reduces approximately 43 percent of
the value for ∆ˇTsh = 0.3 and in the experiments the mean Sauter mean
di-370
ameter is 33 percent of the former. On the contrary, keeping the temperature
constant, Tin = 110 and decreasing the pressure from 4bar ( ˇ∆Tsh = 0.2) to
3bar ( ˇ∆Tsh= 0.5) the meanD32decreased approximately 20µmin the
experi-ment but slightly increases a few microns in the CFD results. The effect of the
pressure on the droplet SMD was also studied by Cleary (2008) who suggested
375
thatD32∝p−0.54. This suggests that increasing the pressureD32decreases, at
[image:26.612.167.440.460.616.2]least within the limits of the proposed correlation (L/D <50). Fig. 10 shows
Table 2: Physical properties for simulations.
Physical parameters for simulations
Inlet pressure 20-40kP a
Inlet temperature 110-125oC
Outlet pressure 100 kP a
Outlet temperature 298 K
L/D 72
Nozzle diameter 1.5mm
Thermodynamic state Saturated
the dimensionless spray angle which is the calculated spray angle divided by
its maximum value. Both in experiments and CFD the angle is defined as the
included angle between the lines connecting the nozzle exit and the points at
the spray edge at 20mm (x/D=13.3) downstream the nozzle exit. The angle
shows initially an increasing trend increasing the superheat for both cases of
2bar and 3bar. Higher values of superheat correspond to an increment in the
number of critical vapour nuclei that form per unit volume and time, J. For
higher temperatures, the waiting time for the critical nuclei to form decreases
385
(τ ∼ 1/J) giving rise in nucleation rate (Avedisian, 1985) and consequently
more vapour appears in jet (see Fig. 11). The jet dispersion in the radial
di-rection is wider which indicates that the spray angle is larger. As Park and
Lee (1994) point out, the bubbles that form burst and increase the velocity in
the radial direction. The spray angle increases until it reaches a maximum and
390
decreases rapidly after. The maximum angle location is not the same for each
case. For inlet pressure equal to 2bar it occurs at approximately in ˇ∆Tsh'0.9
(Tin = 122.5oC) whereas for the case of 3bar, it occurs at approximately in
ˇ
∆Tsh ' 0.65 (Tin = 120oC). The spray angle after reaching its maximum
starts to decrease due to entrainment effects (see Fig. 12). The enhanced
atom-395
isation results in a finer spray and the smaller droplets, which are influenced
more by drag forces, vaporise until they become negligible or return back to the
Figure 9: Cross-sectional averaged SMD versus the dimensionless superheat∆ˇTshat 50mm
(x/D=33.3) distance downstream the nozzle exit. Comparison with Park and Lee (1994).
Figure 10: Normalised spray angle with respect to the dimensionless superheat ˇ∆Tshat 50mm
[image:29.612.135.472.418.611.2]Figure 11: Liquid volume fraction at the radial direction for two different initial temperatures
at x=20mm.
Figure 12: Velocity profile at the radial direction,ux/umaxfor two different initial
[image:30.612.138.470.416.603.2]5. Conclusion
A novel method for modelling the atomisation of flashing jets is presented
400
in this paper. The method is coupled with a newly developed pressure
equa-tion for flash boiliing constructing a unified approach for modelling superheated
jets primary atomisation and secondary break-up considering the flow inside
the channel they emerge from. This is an Eulerian approach for modelling the
spray motion and employs the liquid-gas interface density concept. Based on the
405
existing ELSA models, a new extension is proposed for the Σ-equation which
is appropriate for the evaporation contribution in Σ in the dense and dilute
spray regions. This new Σ-Y model has the capability to simulate all the stages
of flashing jets atomisation. A validation series is presented for some
impor-tant spray characteristics such as the Sauter mean diameter of the droplets,
410
the velocity and spray angle. Different flashing jets scenarios are demonstrated
for flashing water and R134A for validation and predictions for the droplet
characterisation of superheated jets. The model can be easily implemented in
pressure-based CFD codes for turbulent reactive flows allowing the description
of the jet disintegration into liquid ligaments and droplets. The modified Σ
equa-415
tion employs constants for the surface creation and destruction from previous
DNS simulations and experiments for specific liquids. This induces
uncertain-ties especially for the evaporation source terms. Hence, parametric studies for
model calibration for realistic flashing releases would give insights regarding the
optimum selection of the numerical constants. Further research should be made
420
for the implicit/explicit treatment of the source terms in the Σ-Y model and
the impact of the turbulence modelling approach on the primary atomisation.
Acknowledgements
The authors would like to thank Prof. David P. Schmidt from the University
of Massachusetts, Amherst and the Marie Curie Action of the 7th Framework
425
project (Project ID: 606754) regarding the numerical characterisation and
sim-ulation of the complex physics underpinning the Safe Handling of Liquefied
Natural Gas (2014-2017).
References 430
Abramovich, G.N., 1963. The Theory of Turbulent Jets. Cambridge, Mass,
M.I.T. Press.
Abramzon, B., Sirignano, W., 1989. Droplet vaporization model for spray
com-bustion calculations. International Journal of Heat and Mass Transfer 32,
1605–1618.
435
Allen, J., 1998. Laser-based measurements in two-phase flashing propane jets.
part one: velocity profiles1some aspects of the work described in this paper
were presented at the ukala symposium on laser anemometry and
compu-tational solutions, university of loughborough, 2nd-3rd july, 1997.1.
Jour-nal of Loss Prevention in the Process Industries 11, 291–297. doi:https:
440
//doi.org/10.1016/S0950-4230(98)00015-1.
Aris, R., 1962. Vectors, Tensors and the Basic Equations of Fluid Mechanics.
Prentice Hall Inc., Englewood Cliffs.
Avedisian, C.T., 1985. The homogeneous nucleation limits of liquids. Journal of
Physical and Chemical Reference Data 14, 695–729. doi:10.1063/1.555734.
445
Benajes, J., Pastor, J., Payri, R., Plazas, A., 2004. Analysis of the influence of
diesel nozzle geometry in the injection rate characteristic. Journal of Fluids
Engineering 126, 63–71.
Bilicki, Z., Kestin, J., 1990. Physical aspects of the relaxation model in
two-phase flow. The Royal Society 428, 379–397. doi:10.1098/rspa.1990.0040.
450
van den Bosch, C.J.H., Waterings, R., 2005. Methods for the calculation of
Brackbill, J.U., Kothe, D.B., Zemach, C., 1992. A continuum method for
modeling surface tension. J. Comput. Phys. 100, 335–354. doi:10.1016/
0021-9991(92)90240-Y.
455
Cleary, V.M., 2008. Source Term Models for Superheated Releases of Hazardous
Materials PhD thesis. University of Wales Cardiff, Cardiff.
Crowe, C.T., 2005. Multiphase Flow Handbook. Mechanical and Aerospace
Engineering Series, CRC Press.
Delhaye, J., 1976. Sur les surfaces volumiques locale et inte grale en e coulement
460
diphasique. C. R. Acad. Sci. Paris t. 282, 243–246.
Downar-Zapolski, P., Bilicki, Z., Bolle, L., Franco, J., 1996. The non-equilibrium
relaxation model for one-dimensional flashing liquid flow. International
Journal of Multiphase Flow 22, 473–483. doi:https://doi.org/10.1016/
0301-9322(95)00078-X.
465
Duke, D., Battistoni, M., Swantek, A., Sovis, N., Kastengren, A., Powell, C.,
Som, S., Schmidt, D., 2015. Validation of cavitation simulations in submerged
nozzles. ILASS .
Edelbauer, W., 2017. Numerical simulation of cavitating injector flow and
liq-uid spray break-up by combination of eulerianeulerian and volume-of-flliq-uid
470
methods. Computers & Fluids 144, 19–33. doi:https://doi.org/10.1016/
j.compfluid.2016.11.019.
Faeth, G., 2002. Dynamics of secondary drop breakup-a rate controlling process
in dense sprays. Proceedings of the ILASS-Europe 2002 .
Ferziger, J., Peric, M., 2001. Computational Methods for Fluid Dynamics.
475
Springer Berlin Heidelberg.
Hervieu, E., Veneau, T., 1996. Experimental determination of the droplet size
and velocity distributions at the exit of the bottom discharge pipe of a
Prevention in the Process Industries 9, 413–425. doi:https://doi.org/10.
480
1016/S0950-4230(96)00030-7.
Hutcherson, M.N., Henry, R.E., Wollersheim, D.E., 1983. Two-phase vessel
blowdown of an initially saturated liquidpart 2: Analytical. ASME. J. Heat
Transfer. 105, 694–699.
Ishii, M., 1975. Thermo-fluid Dynamic Theory of Two-phase Flow. Eyrolles.
485
Paris/Scientific and Medical Publications of France, New York.
Ishimoto, J., Ohira, K., Okabayashi, K., Chitose, K., 2008. Integrated numerical
prediction of atomization process of liquid hydrogen jet. Cryogenics 48, 238–
247. doi:https://doi.org/10.1016/j.cryogenics.2008.03.006.
Jasak, H., 1996. Error Analysis and Estimation for the Finite Volume Method
490
with Applications to Fluid Flows PhD thesis. Ph.D. thesis. Imperial College.
Jasak, H., Weller, H.G., A. D., G., 1999. High resolution nvd differencing scheme
for arbitrarily unstructured meshes. International Journal for Numerical
Methods in Fluids 31, 431–449. doi:10.1002/(SICI)1097-0363(19990930)
31:2<431::AID-FLD884>3.0.CO;2-T.
495
Jiang, X., Siamas, G., Jagus, K., Karayiannis, T., 2010. Physical modelling
and advanced simulations of gasliquid two-phase jet flows in atomization and
sprays. Progress in Energy and Combustion Science 36, 131–167.
Johnson, D.W., Woodward, J.L., 1999. Release: a model with data to
pre-dict aerosol rainout in accidental releases. A CCPS concept book, American
500
Institute of Chemical Engineers.
Kataoka, I., Ishii, M., Serizawa, A., 1986. Local formulation and
measure-ments of interfacial area concentration in two-phase flow. International
Journal of Multiphase Flow 12, 505–529. doi:https://doi.org/10.1016/
0301-9322(86)90057-1.
Lebas, R., Menard, T., Beau, P., Berlemont, A., Demoulin, F., 2009. Numerical
simulation of primary break-up and atomization: Dns and modelling study.
International Journal of Multiphase Flow 35, 247–260. doi:https://doi.
org/10.1016/j.ijmultiphaseflow.2008.11.005.
Lee, J., Madabhushi, R., Fotache, C., Gopalakrishnan, S., Schmidt, D., 2009.
510
Flashing flow of superheated jet fuel. Proceedings of The Combustion
Insti-tute 32, 3215–3222.
Lhuillier, D., 2003. Dynamics of interfaces and rheology of immiscible
liq-uidliquid mixtures. Comptes Rendus Mcanique 331, 113–118. doi:https:
//doi.org/10.1016/S1631-0721(02)00004-9.
515
Ling, Y., Zaleski, S., Scardovelli, R., 2015. Multiscale simulation of
atomiza-tion with small droplets represented by a Lagrangian point-particle model.
International Journal of Multiphase Flow 76, 122–143. doi:10.1016/j.
ijmultiphaseflow.2015.07.002.
Lyras, K., Dembele, S., Schmidt, D., Wen, J., 2018. Numerical simulation
520
of subcooled and superheated jets under thermodynamic non-equilibrium.
International Journal of Multiphase Flow 102, 16–28.
Lyras, K., Dembele, S., Vendra, C.R., Wen, J., 2017. Numerical simulation of
superheated jets using an eulerian method. ILASS-Europe 2017 .
Marle, C., 1982. On macroscopic equations governing multiphase flow with
dif-525
fusion and chemical reactions in porous media. International Journal of
Engi-neering Science 20, 643–662. doi:https://doi.org/10.1016/0020-7225(82)
90118-5.
Menard, T., Beau, P.A., Tanguy, S., Demoulin, F.X., Berlemont, A., 2006.
Primary break-up: Dns of liquid jet to improve atomization modelling.
Com-530
putational Methods in Multiphase Flow III 50, 343–352.
Menter, F., 1993. Zonal two equation k- turbulence models for aerodynamic
Montorfano, A., Piscaglia, F., Ferrari, G., 2013. Inlet boundary conditions
for incompressible les: A comparative study. Mathematical and Computer
535
Modelling 57, 1640–1647. doi:https://doi.org/10.1016/j.mcm.2011.10.
077.
Morel, C., 2007. On the surface equations in two-phase flows and reacting
single-phase flows. International Journal of Multiphase Flow 33, 1045–1073.
doi:https://doi.org/10.1016/j.ijmultiphaseflow.2007.02.008.
540
Moulai, M., Grover, R., Parrish, S., Schmidt, D., 2015. Internal and
near-nozzle flow in a multi-hole gasoline injector under flashing and non-flashing
conditions, SAE International. doi:10.4271/2015-01-0944.
Navarro-Martinez, S., 2014. Large eddy simulation of spray atomization with
a probability density function method. International Journal of Multiphase
545
Flow 63, 11–22.
Oza, R.D., 1984. On mechanism of flashing injection of initially subcooled fuels.
Journal of Fluid Mechanics 106, 105–109.
Park, B.S., Lee, S.Y., 1994. An experimental investigation of the flash
atomiza-tion mechanism. Atomizaatomiza-tion and Sprays 4, 159–179.
550
Park, C.K., J. W. Park, M.K.C., Chung, M.H., 1997. An emperical correlation
for the critical flow rates of subcooled water through short pipes with small
diameters. Journal of the Korean Nuclear Society 29, 35–44.
Pavlov, P., 1988. Dynamics of Superheated Liquid Boiling. Sverdlovsk.
Pilch, M., Erdman, C., 1987. Use of breakup time data and velocity history
555
data to predict the maximum size of stable fragments for acceleration-induced
breakup of a liquid drop. International Journal of Multiphase Flow 13, 741–
757. doi:https://doi.org/10.1016/0301-9322(87)90063-2.
Poinsot, T.J., Lelef, S.K., 1992. Boundary conditions for direct simulations of
compressible viscous flows. Journal of Computational Physics 101, 104–129.
560
Price, C., Hamzehloo, A., Aleiferis, P., Richardson, D., 2016. An approach to
modeling flash-boiling fuel sprays for direct-injection spark-ignition engines.
Atomization and Sprays 26.
Prosperetti, A., Tryggvason, G., 2009. Computational Methods for Multiphase
565
Flow. Cambridge University Press.
Reitz, R.D., 1990. A photographic study of flash-boiling atomization. Aerosol
Science and Technology 12, 561–569. doi:10.1080/02786829008959370.
Schmidt, D.P., Gopalakrishnan, S., Jasak, H., 2010. Multi-dimensional
simulation of thermal non-equilibrium channel flow.
Interna-570
tional Journal of Multiphase Flow 36, 284–292. URL: http:
//www.sciencedirect.com/science/article/pii/S030193220900192X,
doi:https://doi.org/10.1016/j.ijmultiphaseflow.2009.11.012.
Sher, E., Bar-Kohany, T., Rashkovan, A., 2008. Flash-boiling atomization.
Progress in Energy and Combustion Science 106, 417–439.
575
Spalding, D.B., 1953. The Combustion of Liquid Fuels. A Proc. 4th Symp.
(Int.) on Combustion, Williams and Wilkins, Baltimore, MD.
Srinivasan, V., Salazar, A., Saito, K., 2010. Modeling the disintegration of
cavitating turbulent liquid jets using a novel vof-cimd approach. Chemical
Engineering Science 65, 2782–2796.
580
Tomar, G., Fuster, D., Zaleski, S., Popinet, S., 2010. Multiscale simulations of
primary atomization. Computers & Fluids 39.
Vallet, A., Borghi, R., 1999. Modelisation eulerienne de iatomisation dun jet
liquide. C. R. Acad. Sci. Paris, t. 327 t. 327, 1115–1200.
Vallet, A., Burluka, A., Borghi, R., 2001. Development of an eulerian model for
585
the atomization of a liquid jet. Atomization and Sprays 11, 619–642.
Wang, X., Chen, B., Wang, R., Xin, H., Hui, Zhu, Z., 2017. Experimental
of r134a using straight tube nozzles. International Journal of Heat and Mass
Transfer 114, 675–687.
590
Weller, H.G., Tabor, G., Jasak, H., Fureby, C., 1998. A tensorial approach
to computational continuum mechanics using object-oriented techniques.
Comput. Phys. 12, 620–631. URL:http://dx.doi.org/10.1063/1.168744,
doi:10.1063/1.168744.
Witlox, H.W.M., Bowen, P.J., 2002. Flashing liquid jets and two-phase
disper-595
sion A review. HSE.
Yildiz, D., 2005. Experimental investigation of supeheated liquid jet atomization
due to flashing phenomena PhD thesis. von Karman institute, Universite libre
De Bruxelles.
Zhou, Z.F., Wu, W., Chen, B., Wang, G.X., Guo, L., 2012. An
experimen-600
tal study on the spray and thermal characteristics of r134a two-phase
flash-ing spray. International Journal of Heat and Mass Transfer 55, 4460–4468.