warwick.ac.uk/lib-publications
Original citation:
Banks, James R. and Bloodworth, Alan G. (2018) Lateral stress profiles on integral bridge abutments. Proceedings of the Institution of Civil Engineers - Bridge Engineering . pp. 1-60. doi:10.1680/jbren.17.00017
Permanent WRAP URL:
http://wrap.warwick.ac.uk/101471
Copyright and reuse:
The Warwick Research Archive Portal (WRAP) makes this work by researchers of the University of Warwick available open access under the following conditions. Copyright © and all moral rights to the version of the paper presented here belong to the individual author(s) and/or other copyright owners. To the extent reasonable and practicable the material made available in WRAP has been checked for eligibility before being made available.
Copies of full items can be used for personal research or study, educational, or not-for-profit purposes without prior permission or charge. Provided that the authors, title and full
bibliographic details are credited, a hyperlink and/or URL is given for the original metadata page and the content is not changed in any way.
Publisher’s statement:
© ICE Publishing
Published version: http://dx.doi.org/10.1680/jbren.17.00017
A note on versions:
The version presented here may differ from the published version or, version of record, if you wish to cite this item you are advised to consult the publisher’s version. Please see the ‘permanent WRAP URL’ above for details on accessing the published version and note that access may require a subscription.
1
Paper title: Lateral stress profiles on integral bridge abutments
Authors: J. R. Banks1 and A. G. Bloodworth2
1Mott Macdonald Ltd, Croydon, UK
2 School of Engineering, University of Warwick, UK
This is the Author Postprint. Published version available at DOI: 10.1680/jbren.17.00017.
Keywords: Bridges, Computational mechanics, Design methods & aids, Thermal effects
Abstract
Integral bridges have become established as a viable structural form in many countries for
reducing maintenance liability and increasing structure robustness. The advent of new design
guidance associated with the Eurocodes provides an opportunity to review the design of these
structures. Research indicates that peak stresses due to bridge expansion continually increase
with cycles and in theory may reach fully passive. However, this may not happen in practice
during a bridge’s life.
A numerical model has been developed and calibrated against test data, enabling predictions
of the development of lateral stresses acting on a full-height frame integral abutment during
its life, both in terms of magnitude and distribution down the wall. Design guidance is shown
to be appropriate for bridges up to 60 m in length, but to be unconservative for longer
bridges. The effect of applying daily cycles of movement rather than just annual cycles has
also been investigated.
2
d Cyclic wall top displacement in BA 42 (maximum bridge expansion to maximum bridge contraction)
dk Characteristic cyclic wall top displacement in PD 6694-1
DR Relative density of soil
DR(trans) Transition relative density of soil
e Void ratio
E’h Secant horizontal Young’s modulus at the start of cycling
E’h(N) Secant horizontal Young’s modulus (in Nth cycle)
E’h0 Secant horizontal Young’s modulus at soil surface
g Acceleration due to gravity
H Abutment retained height K Earth pressure coefficient
Kp/Kp;t Passive earth pressure coefficient in BA 42/PD 6694-1
K0 At-rest earth pressure coefficient
K*/𝐾𝑑∗ Lateral earth pressure coefficient defined in BA 42/00 (Highways Agency,
2000) or PD 6694-1 (BSI, 2011)
m Increment in over one cycle
M Gradient of failure line in q-p space
N Cycle number
p Average stress acting on a triaxial element
q Deviatoric stress acting on a triaxial element
z Depth below retained soil surface
α Coefficient of thermal expansion of bridge deck
a Increment in axial strain in triaxial element over one cycle
3
a Increment in axial stress in triaxial element over one cycle
r Increment in radial stress in triaxial element over one cycle
Hardening parameter in soil model
’ Angle of shearing resistance of soil
’f Final angle of shearing resistance of soil measured after cycling
’peak Peak angle of shearing resistance of soil
Poisson’s ratio
a Axial stress in triaxial element
r Radial stress in triaxial element
EBT Effective Bridge Temperature
RP Return Period
Introduction
Traditionally in road bridges, engineers have used expansion joints and bearings at either end
of the bridge superstructure to accommodate longitudinal expansion and contraction which
may cause tens of millimetres of movement. However, there is a problem of durability
relating to bearings and expansion joints, due to the ingress of de-icing salts or trapped debris
in the joints. Maintaining or replacing joints and bearings is complex and expensive,
especially when the bridge is kept open to traffic (Baimas and McClean, 1998).
To avoid these problems, integral bridges have been developed to eliminate joints and
bearings such that the superstructure is structurally integrated with the abutments (Fig. 1).
4
As well as cost and durability advantages, integral bridges have better resistance to
earthquake forces (Tandon, 2005), faster construction and in some cases saving on foundation
size due to the propping action of the deck (Card and Carder, 1993). However, thermal
expansion and contraction of the superstructure still occurs, causing the abutment to move
into and away from the retained fill on a daily and seasonal basis. Although movements are
relatively small, the lateral stresses which develop are of concern to designers, particularly
because it is widely believed that over time the stresses progressively increase to an
unpredictable level.
Different forms of integral bridge have been constructed in the UK (Highways Agency, 2000;
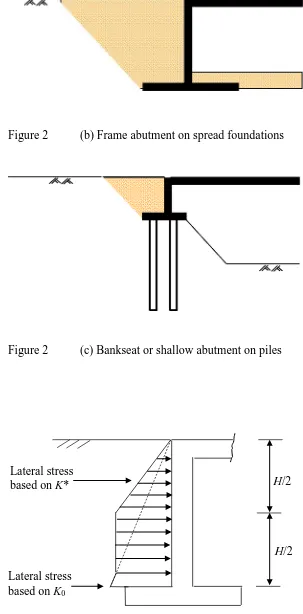
BSI, 2011). An embedded abutment bridge is normally constructed top down, with piled
abutments, commonly founded in and/or retaining clay (Fig. 2(a)). Full-height frame
abutment bridges are constructed following excavation and a wedge is backfilled behind the
abutment (Fig. 2(b)). Bank pad or shallow abutment bridges are often founded on piles (Fig.
2(c)), and can be designed satisfactorily to resist full passive pressure (Kim and Laman,
2012). The main focus of this project will be full-height frame abutments, where there is
benefit in examining the lateral stress profile on the abutment as it causes significant bending
to develop.
International trends
Internationally, the structural form has grown in popularity and with a variety of forms. In the
USA, 13000 integral and jointless bridges were in service by 2005 (Maruri and Petro, 2005).
States tend to have their own guidance and standard details. Often these have been based on
the work undertaken by Tenndot (Wasserman and Walker, 1996) and utilise AASHTO
5
Administration (1980) recommends maximum cumulative span lengths of 91 m, 152 m and
183 m for steel, reinforced concrete and prestressed concrete respectively, all well in excess
of BA 42. However, bridges up to 240 m long have been constructed (Lehane et al., 1999)
based on progressive increases in length influenced by experience, and even a bridge up to
800 m long with monolithic piers and movement joints at the ends has been observed
(Nicholson et al., 1997). It should be noted bridges have been designed in the US in the past
for a service life of 50 years (with the current regulation being for 75 years), compared to a
120-year design life in the UK, which thus has a much longer period for lateral stresses to
increase. Also, US bridges tend to have shallow abutments on a single row of H-piles, with a
much smaller retained height over which lateral stresses act (Nicholson et al., 1997).
In mainland Europe, Scandinavia has led the way in integral bridge development. In Finland,
bridge lengths are limited to 70 m for normal trafficked bridges, and full passive pressure is
assumed in design (Kerkowski, 2006). Sweden has integral bridges in service over 60 years,
both shallow and full height abutments (Mattsson and Sundquist, 2007), with length limits 60
m to 90 m for concrete bridges and 40 m to 60 m for steel depending on location (Flener,
2004). In Norway by contrast, semi integral bridges are the norm (Kerkowski, 2006). In
Spain, integral bridges have been introduced on the high-speed rail network (Javier et al.,
2011). Germany lacks formal guidance and only a few bridges up to 50 m in length have been
built. In Ireland, integral bridges are designed using BA 42 as a basis (Place et al., 2006).
Switzerland has similar guidance to the UK in that it encourages integral design for bridges
up to 60 m in length (Kaufmann, 2009).
In Asia, integral bridges are gaining popularity. In Japan, reinforced earth abutments are
6
(2015) reports on a number of integral bridges recently constructed in India, up to 520 m in
length.
UK practice
Wallbank’s (1989) condition survey of bridges in England and Wales found maintenance
issues with expansion joints and bearings and was a catalyst for clause 2.3 in BD 57/95
‘Design for Durability’ (Highways Agency, 1995) within the Design Manual for Roads and
Bridges (DMRB, Highways Agency, 1992). This specified that all bridges with length not
exceeding 60 m and skew not exceeding 30° should be designed as integral. Guidance on
integral structure design followed with BA 42/96 (Highways Agency, 1996), updated in 2000
with minor changes (Highways Agency, 2000). New guidance became available in 2011
under the framework of the Eurocodes in PD 6694-1 (BSI, 2011).
The guidelines aim to present a design profile for lateral stresses on the abutment catering for
increase over the 120-year design life thought to occur due to soil ratcheting (England et al., 2000). In BA 42 this comprised, for frame abutments, a linear increase in pressure down to
mid retained height with soil stress coefficient K* obtained from equation [1] (where d is the thermal displacement, H is the retained heightand Kp is the passive pressure coefficient of
the backfill), followed by a region of uniform stress until at-rest K0 soil stresses are reached
(Fig. 3(a)).
𝐾
∗= (
𝑑0.05𝐻
)
0.4𝐾
𝑝[1]
When calculating Kp, the peak effective friction angle (’peak) of the backfill is used to
7
The cyclic displacement d is defined as the displacement at each abutment between bridge maximum expansion and maximum contraction. It is normally assumed that the total deck
expansion is divided equally between the abutments, with the backfill providing little
restraint to movement (Biddle et al., 1997).
Total bridge deck expansion ΔL is calculated as follows:
ΔL = L0 × α × ΔT [2]
Where L0 is the original unrestrained length, α the coefficient of thermal expansion of the
deck and ΔT the change in Effective Bridge Temperature (EBT) (Emerson, 1973; Highways Agency, 2001b).
BA 42 takes only limited account of abutment or backfill type, and the design lateral stress
profiles are independent of wall stiffness; true soil-structure interaction is not catered for. In
PD 6694-1, the methodology involving K* is still applied to frame abutments, but cohesive or over-consolidated backfill are now excluded. For embedded abutments, a soil-structure
interaction analysis is now required, and an example approach is given in Annex A of PD
6694-1.
The expression in PD 6694-1 for K* (denoted
𝐾
𝑑∗) for a frame abutment (equation [3])includes dependency on K0, the flexibility of the abutment wall (represented in the term 𝑑𝑑′)
and the stiffness of the soil beneath the foundation (C). The stress profile is linear in accordance with 𝐾𝑑∗ down to mid retained height as in BA 42, but then pressures decrease
8
pressure specified around the mid height of the wall, which perhaps emulates better
observations made in the field of pressures on integral abutments (Barker and Carder, 2006)
than the BA 42 profile.
𝐾
𝑑∗= 𝐾
0+ (
𝐶𝑑𝑑′𝐻
)
0.6𝐾
𝑝;𝑡 [3]The limits in both BA 42 and PD 6694-1 of skew of 30° and abutment displacement of
± 20 mm may be considered as arbitrary; although skew is less well understood, bridges
longer than 60 m have been built in other countries, with attention paid to detailing, such as
the use of shallow abutments founded on a single row of H-piles in minor axis bending as the
bridge expands and contracts (Nicholson et al., 1997).
Issues that remain where further clarification of UK design practice is desirable, which
become the focus for this review of research and numerical study, are as follows:
(i) Where there are differences in the design profiles of BA 42 and PD 6694-1,
particularly the concentration of pressure around mid-height of the wall which is
critical for design bending moments, can further evidence be obtained in support
of either approach.
(ii) Whether the magnitudes of the pressure profiles specified in BA 42 and PD
6694-1 are excessively conservative over any part of the range of bridge expanding
lengths covered by the standards.
(iii) Whether it is plausible that the design formulae for pressures given in the
standards could be extrapolated to bridge lengths beyond the current upper limit of
9 Review on field and laboratory testing
Monitoring has been carried out on a number of integral bridges in the UK (Barker and
Carder, 2000, 2001; Darley et al., 1996, 1998), initially for the first 2½ to 4 years after construction, later extended up to seven years (Barker and Carder, 2006) although still well
short of the design life. Generally, stresses were approximately at-rest after backfilling and
then responded with temperature, increasing slightly in summer then decreasing significantly
in winter, approaching the active state. Stress profiles did not change significantly over time.
Other researchers (e.g. Huntley and Valsangkar, 2013) have also found it difficult to monitor
for long enough to observe the occurrence of stress increases.
To overcome the problem of time scale in the field, small scale 1g testing was carried out by England et al. (2000) and Cosgrove and Lehane (2003). Both tested a stiff abutment rotating about its base against a container of sand. England et al investigated cyclic rotation
magnitudes d/H of 0.26%, 0.50% and 0.70% with sand with relative density DR = 94%, whilst Cosgrove and Lehane used a much looser material (DR = 21%) and applied d/H = 0.12% and 0.32%. England et al found significant lateral stress increases in the first 10 or so cycles after which the rate of increase slowed, tending towards a steady state condition. Cosgrove and
Lehane however observed stresses continually increasing towards passive.
In the centrifuge, Springman et al (1996) investigated both embedded and spread base abutments retaining Leighton Buzzard sand, in research for the original BA 42 (Highways
Agency, 1996). A range of cyclic movements representing daily, annual and 120-year return
periods were applied. Increases in peak lateral stress were insignificant under small cycles,
but became considerable under large cycles. However, the rate of increase was much less
10
Tapper and Lehane (2004) investigated a pinned base abutment retaining sand in the
centrifuge under cyclic amplitudes d/H of 0.10%, 0.40% and 1.26%. By applying far more cycles, 1000 compared to the 100 of Springman et al., they were able to show that lateral stresses did indeed increase until the passive limit was reached.
To understand the fundamental behaviour of an element of soil behind an integral bridge, Xu
et al. (2007) carried out radial strain-controlled cyclic triaxial tests on Leighton Buzzard sand at a range of densities (DR = 18%, 70%, 92%), applying a stress path for an element at mid-height immediately behind an 8 m integral abutment. As the sample was laterally compressed
horizontal stresses increased, and upon radial extension they returned quickly to the active
state. With cycles the peak horizontal stress progressively increased without stabilising,
regardless of density and even for the very dense sand after dilation commenced.
An estimate of ’ prior to cycling was obtained using Jaky (1948), then subsequently ’ was determined assuming the active phase was attained in each cycle on triaxial extension.
Although ’ increased for all specimens, this did not correlate only with increasing DR. For example, the dense specimen with DR = 70% had initial ’ = 35°, whereas for the loose sample ’ increased from 30° to 40° under cycling, whereas DR increased from 18% to only 48% (Xu et al., 2007). This showed that density was not the only factor influencing the lateral soil stress increases observed.
It was observed that continual increase in lateral stresses occurred only if the active state was
11
was contributing along with densification to the increase in soil stiffness seen. This was
confirmed by subjecting spherical glass ballotini to the same stress path, when no build-up of
horizontal stress occurred.
Numerical modelling and verification
A numerical model has been developed based upon the test results of Xu et al. (2007) to predict the lateral stresses acting on a full height integral frame abutment with granular
backfill after any number of cycles (Banks, 2009). The model was implemented in finite
difference program FLAC (Itasca Corporation, 2005) and involved creation of a soil model to
reproduce the relationship between lateral stress and strain and vertical strain and its
development with cycles that was observed in the laboratory. The model is designed for and
verified for the particular pre-failure loading configuration encountered in integral abutment
backfill, and should not be regarded as a generalised soil constitutive model. The failure
criterion adopted is Mohr-Coulomb, for reasons explained later.
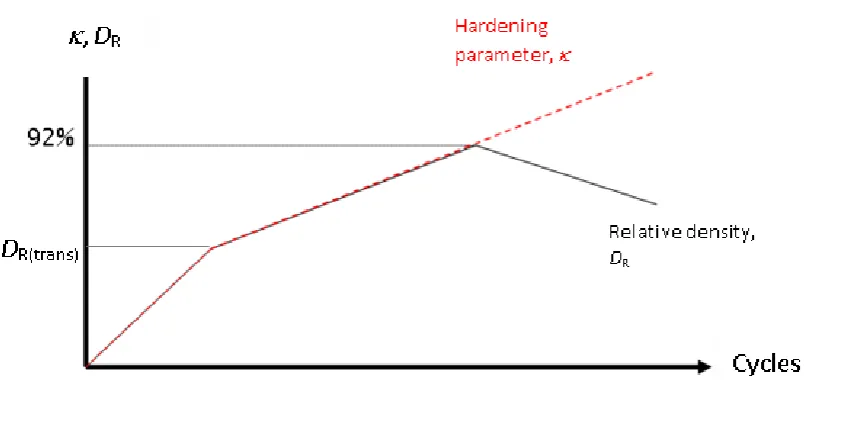
Hardening parameter
The basis of the soil model is a ‘hardening parameter’ (representing the soil state at the
end of each cycle. captures the effects of both densification and progressive grain
interlocking observed by Xu et al. (2007), and is taken as numerically equal to the relative density of the soil up to onset of dilation, after which it continues to increase while relative
density decreases.
Stress-strain relationships
12
r r a N h r r aE
1
1
1
'
1
) ( [4]
Where E’h(N) is the (isotropic) secant horizontal Young’s modulus at the Nth cycle as derived
by Xu (2005), and is Poisson’s ratio. Compression is denoted as negative.
E’h(N), Δεa and is related to by empirical equations derived from ‘best fit’ curves through
the laboratory data of Xu (2005), utilizing the least squares method (Jardine et al., 1986; 1991). The equations capture the rapid degradation of secant stiffness under radial strain
observed in both triaxial extension and compression by Clayton et al. (2006) by means of logarithmic relationships between E’h(N) and Δεr.
The general form of the equation for secant horizontal Young’s modulus in the triaxial
extension phase is:
B AE'h(N) ln
r [5]
where the two coefficients, A and B, are both functions of the hardening parameter, . Similarly, in the compression phase:
D
C
E
'
h(N)
ln
r
[6]
where C and D again depend on .
A similar derivation is made to determine the change in axial strain due to the change in
13
r
r
a
Q
R
2[7]
And in the compression phase:
r
r
a X
Y
2
[8]
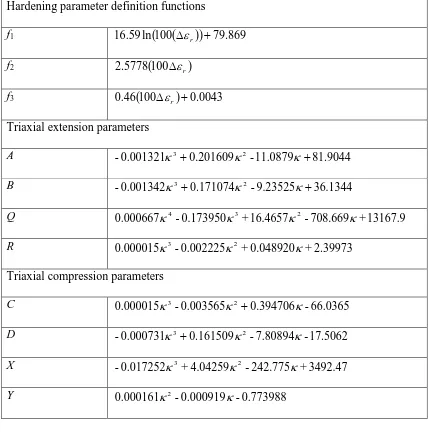
where Q, R, X and Y also depend on the hardening parameter. These parameters along with A and B are given in Table 1.
The changes in axial and radial strain, a and r, are used to determine Poisson’s ratio:
r a a
2 [9] Soil stiffeningThe hardening parameter is incremented in each cycle by an amount m depending on the magnitude of horizontal strain experienced by the soil element.
) 1 ( )
(N
m
N
[10]
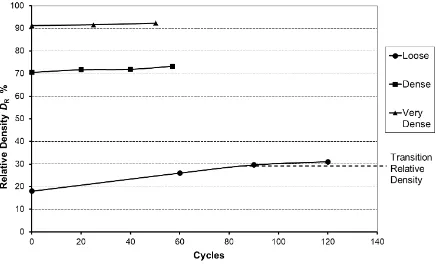
The data of Xu (2005) showed that for a given cyclic radial strain r, a transition relative
density DR(trans) exists, at which the rate of densification per cycle reduces, as illustrated in
Figure 4 for r = 0.05%. DR(trans) depends only on r for the current cycle, and is
independent of initial DR prior to cycling. In the Figure, DR(trans) is passed after approximately
85 cycles of the loose sample. DR(trans) can be expressed as a function of r:
r transR f
14
The increment m in hardening parameter per cycle is related to the cyclic change in radial strain by means of two possible functions, depending on whether the density is below DR(trans)
or above:
DR < DR(trans):
m
f
2
r [12]DR >= DR(trans):
m
f
3
r [13]The functions f1, f2 and f3 are also reported in Table 1.
The very dense Leighton Buzzard sand tested by Xu (2005) started to dilate at DR = 92%,
reaching its transitional state at DR(trans) = 90%. To account for the observation that horizontal
stresses continued to increase after dilation, also continues to increase as an extrapolation
of the pre-dilation trend, as shown schematically in Figure 5.
Failure envelope
The soil model required a representation of failure as well as the pre-failure stiffness
behaviour described above. If the stress path for the very dense sand is plotted in q-p space where q is the deviatoric stress (= a - r) and p is the average stress (= (a + 2r)/3), a
15
Where ± depends on whether passive or active failure is being considered, and ’f is the angle
of shearing resistance obtained by monotonic shearing after all cycling was completed. In
every cycle, the active surface is reached. The passive surface is progressively approached
until finally passive failure is reached. This indicated it was appropriate to adopt the
Mohr-Coulomb failure criterion as an envelope to the soil behaviour. As an aside, Figure 6
illustrates the difficulty of predicting the maximum lateral stress on the integral abutment as it
moves into the soil mobilising passive pressure, as not only is ’f (and therefore M)
continuously changing as the soil fabric is stiffening due to a combination of rolling/sliding
effects and densification, but also the passive failure line is being approached at a very
shallow angle.
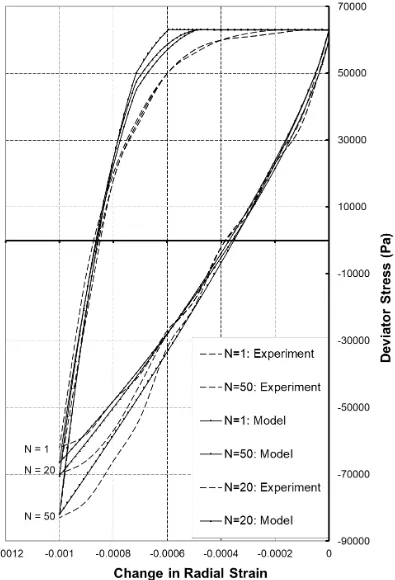
Model verification
The soil model was implemented within FLAC (full details in Banks, 2009) and tested
against the triaxial test data of Xu (2005) using a single axisymmetric element. Figure 7
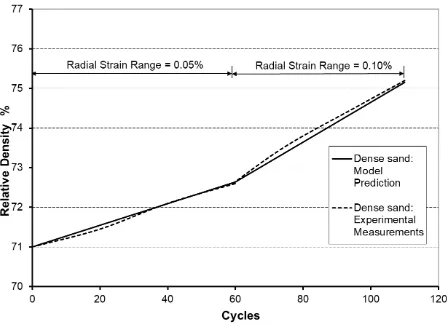
indicates reasonable agreement that improves with cycles. Figure 8 shows the prediction
of the increase in DR observed in the tests on dense sand.
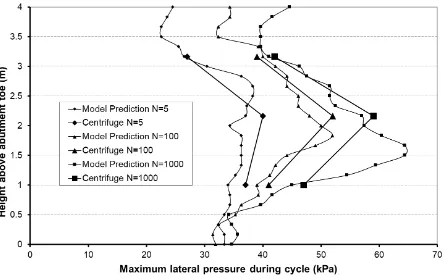
The soil model was then further tested against the centrifuge data of Tapper and Lehane
(2004) as described in Bloodworth et al (2011). Figure 9 shows the prototype-scale model, consisting of a rigid abutment wall hinged at the base retaining sand, together with the FLAC
element grid.
Using the model to represent a realistic bridge abutment and backfill requires a relationship
between E’h and depth z. To obtain an appropriate relation, use was made of the database of
16
Buzzard sand) presented by Lehane et al. (1999). This contains data on shear stiffness (Gs) as
a function of vertical and horizontal stresses, void ratio and mean particle size, at shear
strains of 0.01% and 0.1% (the appropriate range for integral bridges).
With a normalising function F(e) dependant only on the void ratio of the material, a plot of
Gs/F(e) against p’0/patm(where p’0 is the initial average stress and patm atmospheric pressure)
on a logarithmic scale shows a linear relationship, with the gradient dependant on the value of
shear strain. Assuming a Poisson’s ratio of 0.25, a relationship involving E’h/F(e) can be
obtained. The normalising function was one considered by Tatsuoka and Shibuya (1991) as
appropriate to clean siliceous sand such as Leighton Buzzard.
e e e F 1 ) 17 . 2 ( ) ( 2 [15]
A linear relationship between secant modulus and initial average stress can thus be proposed:
) ( ) ' ' ( ) (
' z ap E F e
Eh o h0 [16]
Where E’h0 is the value of E’h at the surface and a is a constant. The two values of shear strain in the database (0.01% and 0.1%) yield similar values of a of 311 and 345 respectively, so taking the average:
328 ' '
( ) )(
' z p E F e
17
Finally, E’h0is adjusted so that at an overburden pressure of 80 kPa, E’h matches the value
observed in the triaxial tests of Xu (2005).
Figure 10 shows the peak lateral stresses (wall moved into the soil) from the soil model and
centrifuge tests, after 5, 100 and 1000 cycles of d/H = 0.4%. Good agreements are seen in terms of both shapes and magnitudes of stress profiles. The numerical results show a peak of
stress propagating downwards with cycles, a greater peak than was evident from the
centrifuge data only available at discrete locations. Agreement was similarly good for the
other cyclic magnitudes, no doubt helped by the triaxial tests on which the soil model was
based, and the centrifuge tests, being conducted with similar materials at similar confining
pressures.
Design case study
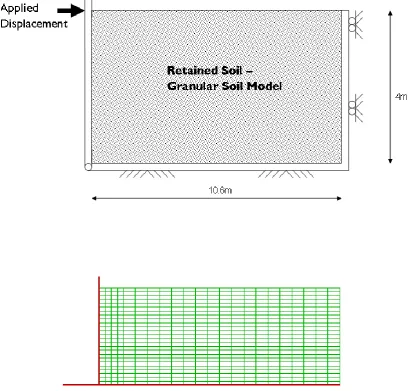
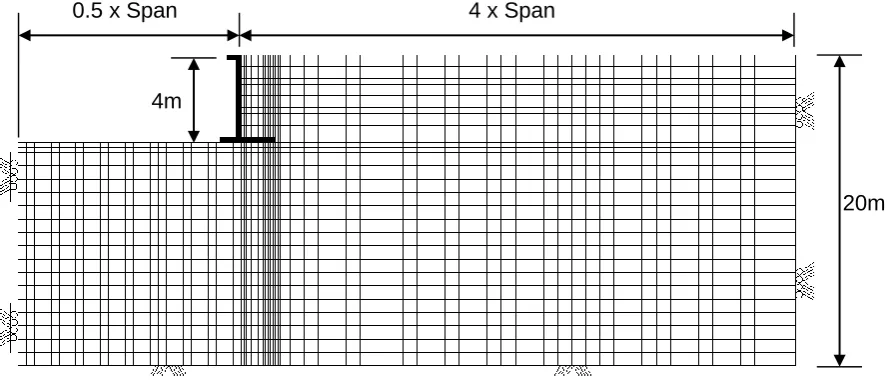
Following the modelling approach verified above, a model was set up to represent a practical
situation of a spread base frame abutment of retained height 4 m (Fig. 11(a) and (b)). The
abutment comprised a 1200 mm diameter concrete secant pile wall, on which a short
infinitely stiff deck stub was attached, where cyclic displacements were applied. DR was set at
70%, shown in Appendix C of Banks (2009) to correspond approximately to 95% of the
maximum dry density of Leighton Buzzard sand. 95% of maximum dry density is the target
density to be used for integral bridge backfill according to BA 42 (Highways Agency, 1996,
2000)
interfaces between the structure and the soil were assigned friction ’/2 and shear and normal
stiffnesses that were a function of the bulk and shear stiffness of the soil and the smallest
18
The same basic relationship between initial secant horizontal modulus and depth was used as
in the centrifuge prototype model (but with adjustment for different initial DR), and ’ was
taken as 35°.
Comparison with lateral pressures from design guidance
Initial conditions were set by bringing the intact soil into equilibrium under its own
self-weight, then installing the structure and excavating in front whilst propping at the top to
represent a deck slab. Cyclic deck displacements were then applied to model expansion and
contraction of concrete bridge decks of 15 m, 40 m, 60 m and 100 m in length, to obtain
lateral stress predictions for comparison with BA 42 and PD 6694-1. Bridges below 15 m in
length are designed using BD 31/01 (Highways Agency, 2001a) or PD 6694-1 as buried
structures.
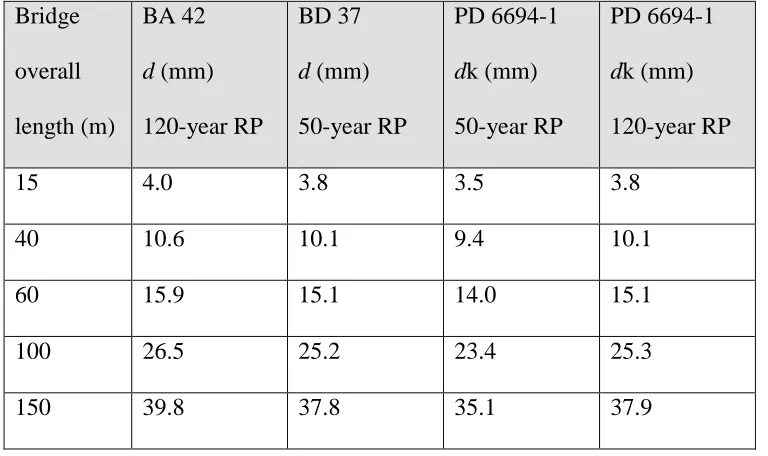
Cyclic deck displacements are calculated slightly differently in the DMRB and PD 6694-1.
For a concrete beam/slab bridge deck with 100 mm of surfacing located in London, 120-year
return period maximum and minimum effective bridge temperatures (EBTs) calculated by
BD 37 (Highways Agency, 2001b) are 37°C and -7°C. Taking the coefficient of thermal
expansion α for concrete as 12x10-6/°C, and assuming equal displacements each end of the
bridge, 120-year return period design abutment displacements for a range of bridge overall
lengths are shown in Table 2, together with 50-year return period values calculated by clause
5.4.2.1 of BD 37.
PD 6694-1 refers to the UK National Annex to BS EN 1991-1-5 (BSI, 2007) for the
calculation of 50-year return period maximum and minimum uniform bridge temperature
19
these equal 37°C and -2°C respectively. Although is specified as 10x10-6/°C in Annex C of
BS EN 1991-1-5 (BSI, 2003), this Annex is only Informative in the UK. Hence = 12x10
-6/°C will be used here for consistency in calculation of bridge expansion, giving the values of
dk shown in Table 2 for 50-year return period. Corresponding 120-year return period values
are also given (Annex A of BS EN 1995-1-5). Table 2 shows that the unfactored abutment
displacements from BA 42 and PD 6694-1 are similar to within 5%.
Figures 12, 13, 14 and 15 present lateral stress profiles for bridges of 15 m, 40 m, 60 m and
100 m respectively predicted by the numerical model compared with BA 42 and PD 6694-1
(and for the 15 m bridge also BD 31). Design ’ has been taken as 35°, wall friction as ’/2, K0 equal to 1-sin ’, soil unit weight 18 kN/m3and 120-year return period displacements from
Table 2 have been used in the standards. In the expression for 𝐾𝑑∗ in PD 6694-1 clause 9.4.3,
the constant C has been taken as 20 for a typical abutment founded on relatively flexible soil.
The profiles from standards are presented unfactored. In BA 42, the load factor of 1.5 for
design to passive earth pressure forces has not been applied. With regard to PD 6694-1, the
partial factor for thermal actions has not been applied to dk (clause 9.4.2), and the partial
factor for the weight of soil has not been applied to 𝐾𝑑∗ (clause 9.4.7).
Two different profiles obtained from the numerical model are shown on the figures. The first
is from an analysis in which 120 cycles of the 120-year return period displacement from BA
42 have been applied, which is the normal assumption for design, and the second is for 120
cycles of 1-year return period displacements. These 1-year displacements have been obtained
utilizing adjustment factors on maximum and minimum air shade temperature in BD 37
20
value is 14.5 mm. Comparison of these results with each other and with those from the
standards enables an assessment to be made of the conservatism of repeatedly applying
120-year return period displacements in the design of an integral abutment.
Figures 12 to 14 indicate that for 15 m, 40 m and 60 m bridges, BA 42 is rather conservative
over the majority of the depth. The exception is for the top quarter, where the model has
predicted finite stress due to its pre-failure horizontal stiffness formulation, whereas both
standards (which are based on passive pressure formulation) have stresses trending to zero at
the surface. However, stresses on the top quarter will have less significance in causing
bending moments in the wall. 1-year return period displacements give approximately 20%
lower pressures than 120-year, confirming the degree of conservatism of BA 42. Under
1-year displacements, stresses on the 15 m bridge are very similar to those stipulated by BD 31.
Even under 120-year displacements, the stresses are still substantially less than in BA 42.
The pressures are predicted by PD 6694-1 are seen to be lower than those from BA 42 across
the range of bridge lengths. The triangular distribution, with the stresses returning to K0
values at the base of the wall, agrees better with the profile obtained from the numerical
model (see also Fig. 10). At short bridge lengths, up to 40 m, PD 6694-1 has a good level of
safety over most of the wall height compared to the numerical values. At 60 m the situation is
more finely balanced, although PD 6694-1 is still conservative over the important mid-part of
the wall compared to either numerical profile.
For the 100 m bridge length (Fig. 15), the results are in contrast to those at shorter lengths.
The numerical model predicts significantly higher lateral stresses than either standard. This
21
the expressions for K* in BA 42 and PD 6694-1 should not be applied to bridges much longer
than this.
Effect of wall stiffness
The results presented in this paper are from a model with a 1200 mm diameter concrete
secant pile wall of flexural rigidity 1.6×10⁶ kNm2 per metre length, in which the concrete
Young’s modulus was taken as 15.7 GPa, appropriate for Grade 32/40 concrete to BS 5400
Part 4 (BSI, 1990) under long-term loading. An investigation was carried out varying this
abutment flexural stiffness from effectively rigid to a 900 mm secant pile wall in Grade 32/40
concrete. Lateral pressures at mid-height of the wall were approximately 10% lower for the
most flexible wall compared to the rigid wall (Bloodworth et al., 2011). Since the results for the 1200 mm wall presented in this paper are intermediate between these extremes, the effect
of varying wall stiffness on lateral pressures is thus not particularly great over the practical
range.
Daily thermal cycles
The standards specify the application of 120-year annual summer-winter abutment
displacements. However, in reality a bridge is subjected to daily cycles of temperature
(Pugasap et al., 2009; Khodair, 2009). Although the early research by Springman et al (1996) did apply daily displacements and concluded they were not more critical to design than
annual cycles, there was a limit on the number of daily cycles that could practically be
applied. Also, it should be recognised that daily cycles are not an alternative to but are
actually superimposed upon the annual movement range (Kim and Laman, 2012). The
numerical model gives the opportunity to explore this issue by applying more daily cycles, in
22
To obtain a realistic combination of daily and annual cycles, data from a real structure was
used, the Adur Bridge Slip Road in West Sussex, UK, a concrete slab bridge monitored
throughout 1969 (Emerson, 1976). Shade air and effective bridge temperatures were
measured daily. Monthly average EBT and average maximum and minimum daily EBT can
thus be calculated (Fig. 16). Within this profile, daily cycles of EBT can be generated, as
indicated schematically in the Figure. The overall annual range of EBT was 16°C and the
typical daily range 4°C.
To model a 10-year period, 3650 daily cycles generated as described above, and 10 annual
cycles, were separately applied to a 40 m bridge with spread base abutment (Fig. 11). Figure
17 shows the lateral stresses obtained at mid-height behind the wall. Although only one
twelfth of the design life could be modelled (due to computational resourcing), the indication
is that including daily cycles increases the stresses. Under annual cycles, the rate of increase
of lateral stress with time reduces faster than under daily cycles, so that although after 10
years there is only about a 10% difference in lateral stress, the trend of the lines is diverging
at this point. However, the soil model is based on the premise of active stress being reached
during each cycle, and for daily cycles at the Adur Bridge, this would not be the case.
Whether the active limit is reached or not is dependent on both the cumulative and daily
displacement and thus this analysis should be seen as conservative.
Conclusions
Integral bridges have become established as a viable structural form for reducing
maintenance liability and increasing structure robustness. However, there has been a need for
23
abutments. Also with the advent of the Eurocodes, better standardisation of design guidelines
across CEN member countries is desirable, and the BSI Published Document PD 6694-1 is a
significant step towards this.
The body of evidence from previous research in the field and laboratory implies that for
granular backfill materials in the practical range of relative density, there is a continual
increase in peak stress with cycles, such that after a large number of cycles (greater than 100,
approaching 1000, depending on the cyclic magnitude), full passive pressure can be reached.
A physical explanation of this soil stiffening has been put forward involving small rotations
of non-spherical particles taking place at the active state on bridge contraction. However, it is
conservative to assume full passive pressure in design, so design guidance specifies lower
stresses intended for a 120-year design life.
A numerical model of the soil-abutment system has been developed, utilising an empirical
soil model that reproduces the lateral stress/strain relationship seen in the laboratory for a soil
element behind the wall, applied to Leighton Buzzard sand. The model has been verified
against centrifuge test data for a pinned-base abutment and applied to a spread base abutment
system, where it successfully demonstrated the increase in lateral stresses with cycles. For
bridges up to 60 m in length, peak lateral stresses around mid-height of the abutment are
predicted as up to 60% lower than prescribed by BA 42. The recent guideline PD 6694-1
gives a more appropriate stress profile and less conservative stress values up to 60 m length.
BD 31 appears satisfactory for short length bridges, and 60 m seems an appropriate length
24
More detailed analysis shows that the peak in lateral stress propagates downwards with
cycles as load is shed down the wall, with the stresses close to the surface stabilising. This
gives further reassurance that full passive pressure will not be reached down the full depth of
the wall in a realistic bridge design life. Modelling daily cycles superimposed on seasonal
behaviour rather than just annual summer/winter variation appears to increase stresses by
about 10%, but this was for a limited study on one site and further research on this subject is
recommended.
Acknowledgements
The support to this research by the Engineering and Physical Sciences Research Council
(Grant Ref: GR/T18882/01 Collaborative Training Account: University of Southampton) and
25 References
AASHTO (2017). LRFD BridgeDesign Specifications, 8th Ed., American Association of State Highway and Transportation Officials, Atlanta, USA.
Baimas, N and McClean, J. (1998). Mancunian Way bearing replacements, Proceedings of the Institution of Civil Engineers, Municipal Engineer, 127, No. 3, 124-131.
Banks, J.R. (2009). Numerical modelling of lateral stress on integral abutments due to cyclic loading, EngD thesis, University of Southampton, UK (available online at:
https://eprints.soton.ac.uk/210943).
Barker, K.J. and Carder, D.R. (2000). Performance of the two integral bridges forming the A62 Manchester road overbridge, TRL Report 436, Transport Research Laboratory, Crowthorne, Berks, UK.
Barker, K.J. and Carder, D.R. (2001). Performance of an integral bridge over the M1-A1 Link Road at Bramham Crossroads, TRL Report 521, Transport Research Laboratory, Crowthorne, Berks, UK.
26
Biddle, A.R., Iles, D.C. and Yandzio, E.D. (1997). Integral steel bridges: Design guidance, Steel Construction Institute, Ascot, Berks, UK, Publication number: P163.
Bloodworth, A.G., Xu, M., Banks, J.R. and Clayton, C.R.I. (2012). Predicting the earth
pressure on integral bridge abutments, Journal of Bridge Engineering, ASCE, 17, No. 2, 371-381.
BSI (1990). BS 5400 Steel, concrete and composite bridges. Part 4 – Code of practice for design of composite bridges, British Standards Institution, London, UK.
BSI (2003). Eurocode 1: Actions on structures – Part 1-5: General actions – thermal actions, British Standards Institution, London, UK (incorporating corrigenda Dec. 2004 and March
2009).
BSI (2007). UK National Annex to Eurocode 1: Actions on structures – Part 1-5: General actions – thermal actions, British Standards Institution, London, UK.
BSI (2011). Recommendations for the design of structures subject to traffic loading to BS EN 1997-1:2004, Published Document PD 6694-1, British Standards Institution, London, UK.
27
Clayton, C.R.I, Xu, M. and Bloodworth, A. (2006). A laboratory study of the development of
earth pressure behind integral bridge abutments. Géotechnique, 56, No. 8, 561-571.
Cosgrove, E.F. and Lehane, B.H. (2003). Cyclic loading of loose backfill placed adjacent to
integral bridge abutments, International Journal of Physical Modelling in Geotechnics, 3, 9-16.
Darley, P., Carder, D.R. and Alderman, G.H. (1996). Seasonal thermal effects on the shallow abutment of an integral bridge in Glasgow, TRL Report 178, Transport Research Laboratory, Crowthorne, Berks, UK.
Darley, P., Carder, D.R. and Barker, K.J. (1998). Seasonal thermal effects over three years on the shallow abutment of an integral bridge in Glasgow, TRL Report 344, Transport Research Laboratory, Crowthorne, Berks, UK.
Emerson, M. (1976). Bridge temperatures estimated from the shade temperature, TRRL Report LR696, Transport Research Laboratory, Crowthorne, Berks, UK.
England, G.L., Tsang, N.C.M. and Bush, D. (2000). Integral Bridges - A Fundamental Approach to the Time Temperature Loading Problem, Thomas Telford, London.
28
Flener, E.B. (2004). Soil-Structure Interaction for Integral Bridges and Culverts, Licentiate Thesis, Royal Institute of Technology, Stockholm.
Highways Agency (1992). Design Manual for Roads and Bridges, HMSO, London.
Highways Agency (1995). BD 57/95 Design for durability, DMRB 1.3, HMSO, London.
Highways Agency (1996). BA 42/96 The design of integral bridges, DMRB 1.3, HMSO, London.
Highways Agency (2000). BA 42/96 The design of integral bridges – incorporating amendment 1, DMRB 1.3, HMSO, London.
Highways Agency (2001a). BD 31/01 Buried Concrete Box Type Structures, DMRB 2.2.12, HMSO, London.
Highways Agency (2001b). BD 37/01 Loads for highway bridges, DMRB 1.3.14, HMSO, London.
29
Huntley, S.A. and Valsangkar, A.J. (2013). Field monitoring of earth pressures on integral
bridge abutments. Canadian Geotechnical Journal, 50(8), 841-857.
Itasca Corporation (2005). FLAC Command and FISH Reference Summary, 3rd Edition (FLAC Version 5.0), April 2005. Minneapolis: Itasca.
Iqbal, N., Gervasio, H., Eriksen, J. and Veljkovic, M. (2010). Inflation adjusted LCCA of a
comparative study of an Integral abutment bridge and a Concrete bridge with expansion
joints, Sustainable construction - a life cycle approach in engineering: Proceedings, International Symposium, Malta, 151-161.
Jaky J. (1948). Pressure in Soils, 2nd International Conference on Soil Mechanics and Foundation Engineering, London, 1, 103-107.
Jardine, R.J., Potts, D.M., Fourie, A.B. and Burland J.B., (1986). Studies of the
influence of non-linear stress-strain characteristics in soil-structure interaction,
Geotechnique, 36, No. 3, 377-396.
Jardine, R.J., Potts, D.M., St. John, H.D. and Hight, D.W. (1991). Some practical
applications of a non-linear ground model, 10th European Conference in Soil Mechanics and Foundation Engineering, Florence, 223-228. Rotterdam: Balkema.
Javier, R.-W., Carlos, G.-A. and Estrada, I. (2011). A Spanish perspective on integral
30
Jin, X. and Shao, X. (2004). New technologies in China's first jointless integral-abutment bridge, IABSE Reports, 88, 172-173.
Kaufmann, W. (2009). Integral bridges: State of practice in Switzerland. fib Symposium, Concrete: 21st century superhero: Building a sustainable future, June 2009. Zagreb: Structural Engineering Conferences.
Kerokoski, O (2006). Soil-Structure Interaction of Long Jointless Bridges with Integral Abutments, PhD thesis, Tampere University of Technology, Finland.
Khodair, Y.A. (2009). Lateral earth pressure behind an integral abutment. Structure and Infrastructure Engineering, 5(2), 123-136.
Kim, W. and Laman, J.A. (2012). Seven-year monitoring of four integral abutment bridges.
Journal of Performance of Constructed Facilities, 26(1), 54-64.
Lehane, B.M., Keogh, D.L. and O’Brien, E.J. (1999). Simplified elastic model for
restraining effects of backfill soil on integral bridges, Computers and Structures, 73, 301-313.
Maruri and Petro (2005). Full-Scale Testing of an Integral Abutment Bridge. Proceedings, FHWA Integral Abutment and Jointless Bridges IAJB 2005, Baltimore, 12-29.
31
Nicholson, B.A., Barr, J.M., Cooke, R.S., Hickman, R.P., Jones C.J.F.P. and Taylor, H.P.J.
(1997). Integral Bridges – Report of a study tour to North America, Concrete Bridge Development Group, Camberley, UK.
Panday, A. (2015). Recent trend to enhance bridge features. fib Symposium, Concrete – Innovation and Design, May 2015. Technical University of Denmark.
Place, D., Farooq, I., and Tang, V. (2006). Integral Bridges with Frame Abutments,
Proceedings of the 1st International Conference on Advances in Bridge Engineering. London, June 26-28.
Pugasap, K., Kim, W and Laman, J.A. (2009). Long-term response prediction of integral
bridge abutments. Journal of Bridge Engineering, ASCE, 14(2), 129-139.
Skinner, A. (1969). A note on the influence of interparticle friction on the shearing
strength of a random assembly of spherical particles, Géotechnique, 19, No. 1, 150- 157.
Springman, S. M., Norrish, A. and Ng, C.W.W. (1996). Cyclic loading of sand behind integral bridge abutments, TRL Project Report 146, Transport Research Laboratory, Crowthorne, Berks, UK.
32
Tapper L. and Lehane B.M. (2004). Lateral stress development on integral bridge
abutments, Proceedings of the Eighteenth Australasian Conference on Mechanics of Structures and Materials, Perth.
Tatsuoka, F. and Shibuya, S. (1991). Deformation characteristics of soils and rocks
from field and laboratory tests, Proceedings of the 9th Asian Regional Conference on
Soil Mechanics Foundation Engineering, Bangkok, Thailand, 53-114.
Wallbank, J., (1989). The performance of concrete in bridges: a survey of 200 highway bridges, HMSO, London.
Wasserman E.P. and Walker, J.H. (1996). Integral Abutments for jointless steel bridges, Proceedings of the National Steel Bridge Symposium, The National Steel Bridge Alliance,
Chicago.
Xu, M. (2005). The Behaviour of Soil behind Full-height Integral Abutments, PhD thesis, University of Southampton, UK.
Xu, M., Clayton, C.R.I. and Bloodworth, A.G. (2007). The earth pressure behind full height frame integral abutments supporting granular fill, Canadian Geotechnical
33
Table 1 Empirical relationships forming the basis of the soil numerical model
Hardening parameter definition functions
f1 16.59ln
100
r
79.869f2 2.5778
100r
f3 0.46
100r
0.0043Triaxial extension parameters
A -0.0013213 0.2016092 -11.087981.9044
B -0.00134230.1710742 -9.2352536.1344
Q 0.0006674 -0.1739503 +16.46572 -708.669 +13167.9
R 0.0000153 -0.0022252 +0.048920+2.39973
Triaxial compression parameters
C 0.0000153 -0.0035652 0.394706-66.0365
D -0.0007313 0.1615092-7.80894-17.5062
X -0.0172523 +4.042592-242.775 +3492.47
34
Table 2 Abutment cyclic top displacements calculated by BA 42, BD 37 and PD 6694-1 for a
concrete bridge deck structure with 100 mm surfacing in the London area
(RP = Return Period)
Bridge
overall
length (m)
BA 42
d (mm) 120-year RP
BD 37
d (mm) 50-year RP
PD 6694-1
dk (mm) 50-year RP
PD 6694-1
dk (mm) 120-year RP
15 4.0 3.8 3.5 3.8
40 10.6 10.1 9.4 10.1
60 15.9 15.1 14.0 15.1
100 26.5 25.2 23.4 25.3
35 Figures
Figure 1 Schematic of an integral bridge showing main components
36
Figure 2 (b) Frame abutment on spread foundations
Figure 2 (c) Bankseat or shallow abutment on piles
Figure 3 Design profiles for lateral earth pressure on integral abutments (a) BA 42
H/2
H/2 Lateral stress
based on K0
37
Figure 3 Design profiles for lateral earth pressure on integral abutments (b) PD 6694-1
Figure 4 Relative density against cycle number for loose, dense and very dense sand
under cyclic radial strain ranges of 0.05% showing transition relative density
H/2
H/2 Lateral stress
based on K0
[image:38.595.78.514.410.677.2]38
Figure 5 Schematic showing development of relative density and hardening parameter
under an increasing number of cycles for a given cyclic strain range
[image:39.595.76.530.386.661.2]39
Figure 7 Typical curves of predicted change in lateral stress for 0.1% cyclic radial
40
Figure 8 Comparison between model prediction and measured data for change in
density with cycles for dense sand under cyclic radial strain ranges 0.05% and
41
Figure 9 Schematic of Tapper and Lehane centrifuge prototype implemented in FLAC
42
Figure 10 Comparison of peak lateral stresses from numerical model and measured in
centrifuge prototype after 5, 100 and 1000 cycles of rotational magnitude d/H
43
NOT TO SCALE
(a)
[image:44.595.77.521.77.267.2](b)
Figure 11 Numerical model for investigation of spread base abutment bridge (a) FLAC
grid, (b) Abutment geometry
4m
20m
44
Figure 12 Comparison of peak lateral stress for a 4m high spread base abutment for
1-year and 120-1-year return periods with profiles from design guidelines for a 15
45
Figure 13 Comparison of peak lateral stress for a 4m high spread base abutment for
1-year and 120-1-year return periods with profiles from design guidelines for a 40
46
Figure 14 Comparison of peak lateral stress for a 4m high spread base abutment for
1-year and 120-1-year return periods with profiles from design guidelines for a 60
47
Figure 15 Comparison of peak lateral stress for a 4 m high spread base abutment for
1-year and 120-1-year return periods with profiles from design guidelines for a
48
Figure 16 Maximum, minimum and average monthly EBT monitored for Adur Bridge
49
Figure 17 Development of peak lateral stress with cycles at mid height for a 4 m high
spread base abutment and 40 m bridge after 10 years of service, applying daily