Automatic Detection of Computer Network Traffic
Anomalies based on Eccentricity Analysis
Rodrigo Siqueira Martins
Campus ParnamirimFederal Institute of Rio Grande do Norte Parnamirim, Brazil
Email: [email protected]
Bruno Sielly Jales Costa,
Senior Member
, IEEE
Campus Natal - Zona NorteFederal Institute of Rio Grande do Norte Natal, Brazil
Email: [email protected] and
Research & Innovation Center Ford Motor Company
Palo Alto, USA Email: [email protected]
Plamen Angelov,
Fellow
, IEEE
School of Computing and CommunicationsLancaster University Lancaster, UK
Email: [email protected]
Abstract—In this paper, we propose an approach to automatic detection of attacks on computer networks using data that com-bine the traffic generated with ’live’ intra-cloud virtual-machine (VM) migration. The method used in this work is the recently introduced typicality and eccentricity data analytics (TEDA) framework. We compare the results of applying TEDA with the traditionally used methods such as statistical analysis, such as k-means clustering. One of the biggest challenges in computer network analysis using statistical or numerical methods is the fact that the protocol information is composed of integer/string values and, thus, not easy to handle by traditional pattern recognition methods that deal with real values. In this study we consider as features the tuple {IP source, IP destination, Port source and Port destination} extracted from the network flow data in addition to the traditionally used real values that represent the number of packets per time or quantity of bytes per time. Using entropy of the IP data helps to convert the integer raw data into real valued signatures. The proposed solution permit to build a real-time anomaly detection system and reduce the number of information that is necessary for evaluation. In general, the systems based on traffic are fast and are used in real time but they do not produce good results in attacks that produce a flow hidden within the background traffic or within a high traffic that is produced by other application. We validate our approach an a dataset which includes attacks on the network port scan (NPS) and network scan (NS) that permit hidden flow within the normal traffic and see this attacks together with live migration which produces a higher traffic flow.
Index Terms—typicality, eccentricity, TEDA, anomaly detec-tion, real time, computer networks, live migration
I. INTRODUCTION
e.g. the state of the connection, protocols, time to live (TTL), fragmentation, and so on. There are number of challenges that have to be addressed, including the amount of data that a possible attack may affect - how to store such an amount of data, how to process it fast enough (ideally, in real-time), how to figure out the problem (to detect and identify the anomaly). One practical complication is that the data is often encrypted and the only available data are the packets, their rate, amount and IP addresses.
In this paper we propose a new approach to detection of attacks which is grounded on the recently introduced typicality and eccentricity based data analytics (TEDA) [4]. Eccentricity (and, respectively, typicality) are newly introduced concepts and quantities which are closely related to data density, similarity, mutual position and distances in the data space [5]. They were introduced in a series of papers since 2014 by Angelov and his associates [4] [5] [6] [7] [8] [9] [10]. They offer an alternative approach to the traditional statistical data analysis and allow a number of restrictive assumptions about the nature, amount and mutual (in)dependence of the data to be lifted. They do not require the nature of the data (random or deterministic) to be pre-defined or assumed, the data distribution/generation model to be assumed and simplify the well-known results such as Chebyshev inequality [11]. They make possible the entire analysis and decision to be based on data and their pattern alone and not on our assump-tions. They do not require theoretically infinite (practically, large) amount of data and can work with as little as three data samples [4]. Indeed, computer traffic data (similarly to weather, financial and other data streams) is not random even if it looks complex and noisy. It is clearly not deterministic, but is not random, either. Therefore, TEDA is very suitable for real data streams like the one mentioned above, because it does not require them to be artificially assumed to be random, the data distributions and data generation model to be assumed to be of certain (convenient to work with) type (in practice they usually assume normal/Gaussian or a mixture of Gaussians models). Another important characteristic of TEDA is that it allows a fully autonomous and self-evolving algorithms, because it is non-parametric and it does not require any user or problem-specific thresholds to be pre-defined or selected. It can also be applied in real time and can dynamically self-evolve adjusting to possible drifts [6]. The eccentricity (as well as the typicality) works with discrete data directly which is very convenient for data packets and network flow analysis which in our digital age is naturally discrete.
Various tools and solutions for IDS (intrusion detection systems), anomaly detection tools have been developed and proposed [3]. The main difficulty in using Intrusion Detection Systems is the low accuracy of the behaviour profiles. One reason for this is that the networks work constantly and user behaviour (especially of the attackers) is not constant - it is changing, dynamically evolving. Currently existing methods [12] require rebuilding the profiles models to update to these changes. Since the computer network does not stop working, these methods either ignore these changes or are offline.
A very important and difficult challenge is to extract good/representative/descriptive signatures/features that make possible to distinguish between the high volume, but normal otherwise (attacks free) network flow from the anomalies (caused by attacks) that provoke a high volume of the network flow due to DoS (Denial of Service), Network scan, Botnet, and so on.
Table I describes features that can be observed from the computer network traffic [1].
TABLE I
ATTRIBUTES WITHLINGUISTICSLABELS
Attribute Linguistic Labels Duration Short-lived, Long-lived Average packet size Small, Medium, Large, Jumbo
Bytes Mice, Bulk, Elephants Throughput Low, Medium, High
Packets Packet-Mouse, Packet-Bulk, Packet-elephant Time (start, end) Day, Night
Direct usage of these observable features cannot provide a solid guarantee against anomalies caused by malicious attacks. For example, the reason for the Durationto be Long or The average packet sizeto be Largecan be that there is a Botnet or an attack using vulnerabilities related to the memory leak. Similarly, if the amount ofBytescan be characterized asBulk this may be due to the so called ”ping of death” attack. The Throughputdepends on the architecture, but if it is Low, that may be probably due to sudden high traffic backup operation or download of unauthorized content from P2P connections, for example. On the other hand, if the Throughput is High it is difficult to differentiate an attack of DNS flood from a common background traffic caused by many users. For that reason, if the analysis is based on Packets only because very often the backups strategy is generally running at night, it is possible to coordinate an attack using IP address spoofing such the Packet mouse obtained during the day and hidden behind the high traffic generated by backup at night.
Due to these difficulties, in this paper the concept of entropy is used in order to convert the data to a quantitative form, enabling statistical analysis [13]. We are motivated by the need to detect anomaly in real time on network computers without the necessity of creating a database of signatures to train using a specific dataset that may change many times during a year, a month or even a day. We propose an approach that is generic and is capable to distinguish between normal traffic and anomalous signals together with live migration using the data published in [14]. We compare the proposed new approach based on the eccentricity from TEDA with the statistical alternatives based on kernel density estimation (KDE) [14] and principal component analysis (PCA) [14].
II. ECCENTRICITYBASEDANOMALYDETECTION AND
ANALYSIS
temporal and dynamically evolving in nature [4]. Anomalies in computer network attacks permit to study and develop different new techniques that can prevent them or reduce their malicious effect on the network infrastructure and users. In some cases it may be possible to give a response to complicated tasks on industrial computer networks, which is very important nowadays when society and industry move to a more connected and open mode of operation and functioning [3].
The approach we propose is based on the eccentricity which is defined in more details in [4] [5] [7]. Eccentricity is defined within the new statistical framework called TEDA [5]. Let us consider a real feature space Rm , wheremis the
data dimensionality (this can be an Euclidian space with the Euclidean distance, but it can also be Hilbert spaces, and one can extend it to Reproducing Kernel Hilbert spaces, RKHS) [5].
Let us now consider a data set or stream which rep-resents features of the computer network functioning and denote it by {x}N = {x1, x2, ..., xN} ∈ Rm;xi = [xi,1, xi,2, ..., xi,n]
T
;i = 1,2, ..., N where subscripts denote data samples (set) or when they arrive (stream). We can then consider the eccentricity, ξ defined within the TEDA framework based on the cumulative proximity, π as follows [5]:
a) For every pointxi∈ {x}N ;i=1,2,...,None may quantify
how far or dissimilar this point is to all other data points from {x}N
πN(xi) =
N
X
j=1
d2(xi, xj);LN >1 (1)
whered(xi, xj) is the distance between data samplesxi and
xj.
Its importance comes from the fact that it provides density information about each data sample in a scalar or vector form (its value is inversely proportional to the data density [5]). Cumulative proximity is a very important association measure derived empirically from the observed data without making any priorassumptions about their generation model [5].
b) The eccentricity,ξN, can then be defined as a normalized
cumulative proximity [5]:
ξ(xk) = 1
k +
(µk−xk)T(µk−xk) kσ2
k
(2)
where µk is the mean and σ2
k is the variance of the data
set after k samples. It is another very important association measure derived empirically from the observed data without making any prior assumptions about their generation model. It quantifies data samples away from the mode, which is very useful to represent specifically the distribution tails and anomalies [5]. This quantity which is very useful and conve-nient to detect and analyse anomalies is always between 0 and 1, i.e:
0≤ξ(xk)≤1 (3)
For anomaly detection under any type of distribution, one can successfully use the well known Chebyshev inequality,
[n], which states that no more than 1/n2 are more than nσ away from the mean, whereσis the standard deviation of the data. In [5] if was shown show that the condition that provides exactly the same result (but without making any assumptions on the amount of data, their independence and so on) as the Chebyshev inequality and can be used as threshold for outlier detection is
ξ(xk)> n2+ 1
2N (4)
III. DATASETANALYSIS
It is often very difficult to get a data stream or set from a real computer network under attack for understandable reasons. Moreover, the amount of data is not balanced between the different cases: i) normal data traffic, and ii) abnormal traffic. In practice, the amount of data concerning ii) is drastically less than the amount of data concerning i) which is also quite obvious. It is also very difficult to get labels to each data sample. Often the data samples are not directly from the network but a result of processing. This is the case for the popular KDD99 data set used as a well-known benchmark, as well as for its better and modified version called NSL-KDD. Both of these were generated a decade ago and current studies show that this does not reflect the modern low footprint attacks. The probability values from the distribution of the training data set is different from the one from the testing data set, but this is not a specific problem of our method. This is a consequence of the irregular distribution and the huge amount of data samples related to OS attacks and small amount of normal data which does not permit to see possible false negative alarms in the normal data. Although, corrections were made on this problem in NSL-KDD in regards to the previous data set KDD99, the problem of the old fingerprints still persists as indicated in [15].
A. SECCRIT group dataset
Motivated by these problems, in this paper we propose to use the data generated within the SECCRIT1 (SEcure Cloud computing for CRitical infrastructure IT) project. This project produced several papers and, more importantly for our study, a dataset that allows a deeper analysis of more contemporary style attacks (considering a modern data cloud environment). One recent technology that is growing in popularity and improves some facilities in the infrastructure of the Internet is the so calledInfrastructure-as-a-Service(IaaS). IaaS makes possible to create virtual machines (VM) and deliver these to various users. This is a useful new tool, but it also generates new vulnerabilities. This requires more studies about the security of this environment [16]. It is very challenging to distinguish between a normal traffic and an anomaly generated from an attack in the cloud environment, especially when pursuing a high performance and using the strategy of Live
Migration. Live Migration is a migration of virtual machines (VMs) between physical machines without turning of the computers (the physical machines). In other words, a "hot" migration. One of the results of the SECCRIT project was the dataset that permits to analyse anomalies or attacks on the environment with live migration and other traffic conditions in the background. The study about the anomaly detection was done using traditional tools such as k-means clustering method, (PCA) and Self-Organizing Features Maps (SOFMs) [14] [16].
IV. EXPERIMENTS ANDDISCUSSION
In this section, we present the experimental results obtained using standardized eccentricity of the data stream as a tool automatically and in real time detect anomalies on the case of SECCRIT data. The characterization of the data is shown in Table II.
TABLE II
CHARACTERIZATION OF THEDATA
Type Anomaly Intensity Migration overlap High Low Normal Anomalous NPS AH AL NM AM
The dataset that was created from a testbed Local Area Network with live migration occurrence while experiencing normal and abnormal traffic conditions. The experiment takes 10 minutes in total. The ground truth is that there is an anomalous script which always starts at the fifth minute. The methodology applied for creating the dataset includes a live migration of VM which is called normal migration (NM) period and occurs 2.5 minutes after the start of the experiment. When there is an anomaly (anomalous migration, AM period) it occurs 7.5 minutes after the start of the experiment (2.5 minutes after the anomaly). The intensity of the anomaly can be labelled as low(AL) or high(AH). In our experiment, we take raw captured packet files and create a capture bin with duration of 1 minute to analyse the data of the network flow. An important point in the analysis of the data from the network is to extract information beyond the traditionally used flow related parameters such as the flow rate (quantity of bytes per time or quantity of packets per time). The reason is that often the attacks are not visible in this data space (these parameters may not change clearly when there is an attack). Hence, we take a conversion of the qualitative information that is so important for the analysis of the data from the network such as the tuple IPSRC, IPDST, PORTSRC and PORTDST. Other quantitative information that can be used is the protocol, but this was not considered in the tests. Then we convert the qualitative to quantitative data using entropy [13]:
H(X) =−
L
X
i=1 (wi
S)log2( wi
S ) (5)
We use an empirical histogramX =wi, i= 1, ..., L, where L is the size of bin and the feature i occur wi times in the
sample andS will be the total number of observations in the histogram calculated by:
S =
L
X
i=1
wi (6)
Below we plot the experimental outcomes with this entropy applied to the tuple with the IP and the ports plus the flow expressed in bytes and packets.The red line in the graphics is placed to facilitate the visualisation of the start of the attack, while the green line indicates when the live migration starts; however it still represents a normal operation. When attacks start it is possible to see the grown of the quantity of packets, as in Figure 1(A) marked with red line. But when the live migration start the number of packets is reduced due to a greater volume of bytes takes the bandwidth as it is possible to see on Figure 1(B). When analysing the entropy of IPSRC/IPDST alone in Figure 1(C) and Figure 1(D), it is not possible to easily visualise the attacks that start at the red dashed bar, while the live migration, starting at the green dashed bar, can be clearly identified in the chart. On the other hand, entropy of PORTSRC and PORTDST are enough for the attack detection while it does not trigger any alarms during the live migration.
We first used the entropy of IPDST and PORTDST to test if it is possible to detect the anomaly. When there is no separation of input and output traffic, IPDST and IPSRC are the same. However, in the case of separate flows, the features are different. To distinguish between live migration or other conditions such as backups, or other that change the flow we add a second logical condition: if (ξ(xk) > n
2+1
2N ) and
(µH(X)L > µH(X)L−1). Where µH(X) is the mean of entropy.
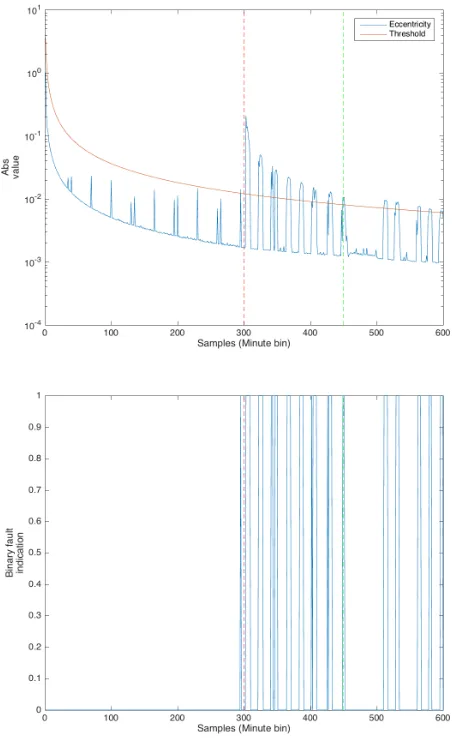
In this experiment, we chose to use the IP entropy and Port Destination as input features to TEDA. The eccentricity chart and binary indication of anomalies, which may translate into automatic system alerts, can be seen in Figures 2(A) and 2(B). The anomaly was detected before the start of the live migration and after that. However, it was supressed during the process. In this case we did not improve the signatures using entropy of port source/destination against use quantity of packets, as it can be see in the Figures 1(A),(C), and (D). However using the entropy signature together with TEDA we reduce the false positive and false negative rate alarm generated in comparison to the case when we analysed just the quantity of bytes as shown in Figure 1(B).
Fig. 1. Samples labelled with AH-AM, (A) packet flow, (B) byte flow, (C) entropy IPSRC and entropy IPDST, (D) entropy portSRC and entropy portDST
Fig. 2. Eccentricity and threshold defined In Eq. 2 and 4 (A) absolute value, (B) fault indication, label with AH-AM
outcome. The same behaviour occurs with the entropy of ports and entropy of IPs.
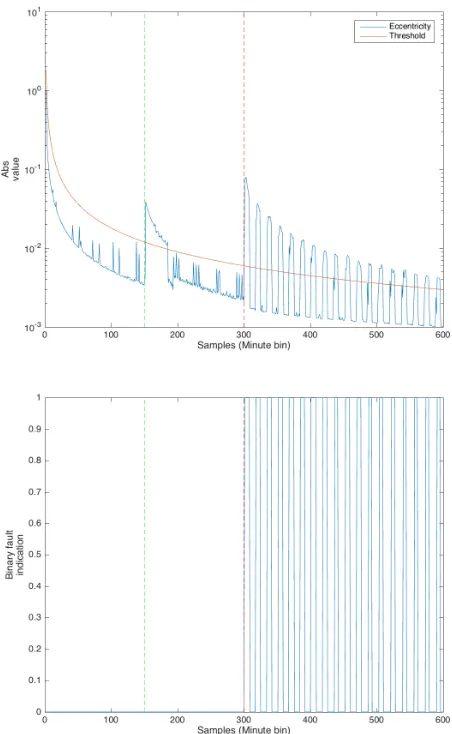
In the last case, when using the newly proposed approach (based on the eccentricity) to detect the anomaly we have a false negative (FN) alarm at the moment live migration takes place; thus, we have a false positive (FP) alarm for half of the anomalous data samples. This is not necessarily a very negative situation, but it shows that if the alarm was ignored the proposed method can learn that this is a continuous and normal environment and not an abnormal condition. We can see this test on Figure 4.
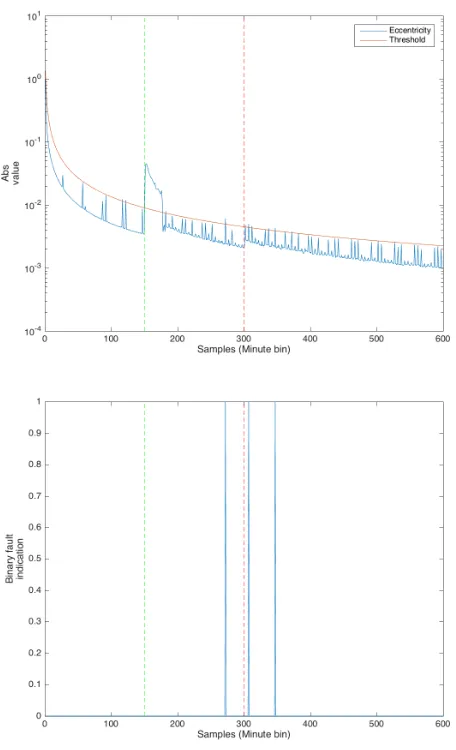
The worst case is when an attack is completely hidden in the background traffic or when is not possible to see it using entropy of other parameters. In Figure 5, we illustrate the cases with low anomaly intensity (AL) and normal period (NM) and in Figure 6 the TEDA output and fault indication.
[image:5.612.50.283.65.732.2]Fig. 3. Samples labelled with AH-NM, (A) packet flow, (B) byte flow, (C) entropy IPSRC and entropy IPDST, (D) entropy portSRC and entropy portDST
Fig. 4. Process entropy using the proposed method, (A) eccentricity, (B) fault indication, labeled with AH-NM
able to compare with other alternative methods, however, we use the well-established criteria, which do not take the time of detection into account. These include: i) accuracy (acc); ii) false alarm rate (FAR) to evaluate the efficiency and reliability. In order to obtain this, we calculate the metrics: true positive (TP), true negative (TN), false positive (FP) and false negative (FN). Then, FAR and accuracy are calculated by [17]:
acc= T P +T N
T P +T N+F P +F N (7)
In order to calculate the FAR we need the false positive rate (FPR) and false negative rate (FNR), respectively:
F P R= F P
F P+T N (8)
F N R= F N
F N+T P (9)
F AR=F P R+F N R
[image:6.612.49.283.63.735.2]Fig. 5. Samples labelled with AL-NM, (A) flow of packets, (B) flow of bytes, (C) entropy IPSRC and entropy IPDST, (D) entropy PortSRC and entropy PortDST
Fig. 6. Process entropy using the eccentricity with different threshold, (A) eccentricity, (B) anomalies detected, labeled with AL-NM
These are important in order to compare with the other methods as we can see in Table III which represents the results for the SECCRIT data using the proposed method and in Table IV the results using Kmeans.
TABLE III
EVALUATION OFTHESECCRITDATASET USINGTEDA Label TP TN FP FN Acc FAR online/offline AH-AM 89 501 1 9 0.9833 0.0469 online AH-NM 116 475 9 0 0.9850 0.0092 online AL-AM 13 306 36 247 0.5299 0.5276 online AL-NM 8 299 1 292 0.5116 0.4883 online
V. CONCLUSION
[image:7.612.48.282.63.735.2]TABLE IV
EVALUATION OFTHESECCRITDATASET USINGKMEANS
Label TP TN FP FN Acc FAR online/offline AH-AM 91 502 0 7 0.9883 0.0357 offline AH-NM 116 463 21 0 0.9650 0.0216 offline AL-AM 113 320 22 147 0.7192 0.3148 offline AL-NM 0 274 26 300 0.4566 0.5433 offline
to automatically and successfully detect anomalies in NPS and NS attacks. The IDS system based on signatures or on statistical models needs a priori knowledge and huge database with signatures. For example, if we compare the results obtained with the work of [14], which used seven data signatures, including a few that require to manually examine a number of protocols and store larges amount of data, we are still able to reliably detect networks attacks in real time with much simpler signatures/features, without the need for high computational power nor considerable a priori information.
Global normalization was done in the data for visualization but is not necessary for real-time processing because the entropy already takes care of it.
In future work, we will investigate the use of wavelet transform to amplify the low attacks signatures in regards to the flow and entropy.
REFERENCES
[1] F. M. Pouzols, D. R. Lopez and A. B. Barros, Mining and Control of Network Traffic by Computational, Berlin: Springer, 2011.
[2] G. Dewaele, K. Fukuda, P. Borgnat, P. Abry and K. Cho, Extracting Hidden Anomalies using Sketch and Non Gaussian Multiresolution Statistical Detection Procedures., in SIGCOMM 2007 Workshop on Large-Scale Attack Defense (LSAD), Kyoto, Japan, 2007.
[3] M. Ahmed, A. N. Mahmood and J. Hu, A survey of network anomaly detection techniques, Journal of Network and Computer Applications, vol. 60, pp. 19-31, January 2016.
[4] P. P. Angelov, Anomaly Detection based on Eccentricity Analysis, in IEEE Symposium on Evolving and Autonomous Learning Systems (EALS), Orlando, FL, USA, 2014.
[5] P. P. Angelov, X. Gu and J. C. Principe, A Generalized Methodology for Data Analysis, IEEE Transactions on Cybernetics, 10 2017. [6] C. G. Bezerra, B. S. J. Costa, L. A. Guedes and P. P. Angelov, A
New Evolving Clustering Algorithm for Online Data Streams, in IEEE Conference on Evolving and Adaptive Intelligent Systems, Natal, Brazil, 2016.
[7] B. S. J. Costa, C. G. Bezerra, L. A. Guedes and P. P. Angelov, Online Fault Detection Based on Typicality and Eccentricity Data Analytics, in International Joint Conference on Neural Networks (IJCNN), Killarney, Ireland, 2015.
[8] P. P. Angelov, Outside the box: an alternative data analytics frame-work, Journal of Automation, Mobile, Robotics and Intelligent Systems, vol. 8, no. 2, pp. 29-35, 2014.
[9] B. S. J. Costa, P. P. Angelov and L. A. Guedes, A new Unsupervised Approach to Fault Detection and Identification, in International Joint Conference on Neural Networks (IJCNN), Beijing, China, 2014. [10] B. S. J. Costa, P. P. Angelov and L. A. Guedes, Fully unsupervised
fault detection and identification based on recursive density estimation and self-evolving cloud-based classifier, Neurocomputing, vol. 150, pp. 289-303, 2015.
[11] J. Saw and a. T. M. M. Yang, Chebyshev inequality with estimated mean and variance, The American Statistician, vol. 38, no. 2, pp. 130-132, 1984.
[12] H.-J. Liao, C.-H. R. Lin, Y.-C. Lin and K.-Y. Tung, Intrusion detection system: A comprehensive review, Journal of Network and Computer Applications, vol. 36, no. 1, pp. 16-24, January 2013.
[13] A. Lakhina, M. Crovella and C. Diot, Mining anomalies using traf-fic feature distributions, in Proceedings of the 2005 Conference on Applications, Technologies, Architectures, and Protocols for Computer Communications, New York, NY, USA, 2005.
[14] N.-u.-h. Shirazi, S. Simpson, A. K. Marnerides, M. Watson, A. Mauthe and D. Hutchison, Assessing the Impact of Intra-Cloud Live Migration on Anomaly Detection, in IEEE 3rd International Conference on Cloud Networking (CloudNet), Luxembourg, Luxembourg, 2014.
[15] N. Moustafa and J. Slay, UNSW-NB15: a comprehensive data set for network intrusion detection systems (UNSW-NB15 network data set), in Military Communications and Information Systems Conference (MilCIS), Canberra, ACT, Australia, 2015.
[16] I. M. Stephanakis, I. P. Chochliouros, E. Sfakianakis and N. Shirazi, Anomaly Detection In Secure Cloud Environments Using a Self-Organizing Feature Map (SOFM) Model For Clustering Sets of R-Ordered Vector-Structured Features, in Proceedings of the 16th Inter-national Conference on Engineering Applications of Neural Networks (INNS), Rhodes, Island, Greece, 2015.
[17] N. Moustafa and J. Slay, The significant features of the UNSW-NB15 and the KDD99 data sets for Network Intrusion Detection Systems, in 4th International Workshop on Building Analysis Datasets and Gathering Experience Returns for Security, Kyoto, Japan, 2015.