John Paulin Hansen
DTU Management Engineering, Technical University of Denmark,
Diplomvej, Building 371, DK-2800 Kgs. Lyngby, Denmark
Email: jpha@dtu.dk Phone:+45 45 25 48 52
Diako Mardanbegi
School of Computing and Communications, Lancaster University, LA1 4WA, United Kingdom
Florian Biermann
Computer Science Department, IT University of Copenhagen,
DK-2300 Copenhagen, Denmark
Per Bækgaard
DTU Compute, Technical University of Denmark, DK-2800 Kgs. Lyngby, Denmark
This paper presents a study of a gaze interactive digital assembly instruction that provides concurrent logging of pupil data in a realistic task setting. The instruction allows hands-free gaze dwells as a substitute for finger clicks, and support image rotation as well as image zoom-ing by head movements. A user study in two LEGO toy stores with 72 children showed it to be immediately usable by 64 of them. Data logging of view-times and pupil dilations was possible for 59 participants. On average, the children spent half of the time attending to the instruction (S.D. 10.9%). The recorded pupil size showed a decrease throughout the building process, except when the child had to back-step: a regression was found to be followed by a pupil dilation. The main contribution of this study is to demonstrate gaze tracking technology capable of supporting both robust interaction and concurrent, non-intrusive recording of gaze-and pupil data in-the-wild. Previous research has found pupil dilation to be associated with changes in task effort. However, other factors like fatigue, head motion, or ambient light may also have an impact. The final section summarize our approach to this complexity of real-task pupil data collection and makes suggestions for how future applications may utilize pupil information.
Keywords:Gaze interaction; instructions; usage log; pupil dilation; pupillometry; effort; engagement; task analysis; user experience; user interfaces.
Introduction
Gaze-tracking sensors are emerging in consumer grade PC’s and head mounted displays. Gaze interaction is con-venient, particularly when the hands are occupied with a pri-mary task, for instance assembling or cooking (Mardanbegi, Hansen, & Pederson, 2012); gaze may then be used for input while handling objects and without contaminating the dis-play itself.
In addition to the advantages of being hands-free, gaze interaction provides new opportunities to collect real-time user data. How frequently is each element on a display at-tended to, and which elements are ignored? Central to this paper, previous research on pupil dilation has revealed a re-lationship between pupil dilation and cognitive effort. Under laboratory conditions with restrictions on head motion and under well-controlled light conditions, several studies have shown that when mental load increases, the pupils dilate pro-portional to the increase (e.g. (Kahneman & Beatty, 1966;
Beatty & Lucero-Wagoner, 2000)) until the task demands become limited by available resources (Granholm, Asarnow, Sarkin, & Dykes, 1996). This provides a unique possibility to identify e.g. particularly demanding parts of a task and to quantify changes throughout task engagement - for both individuals and for groups of users. However, it is an open question if pupil data of relevance may be recorded in real-life situations without control of ambient light and with free head movements.
Fi-Figure 1. The gaze interactive assembly instruction. (Left:) Stepping forward by dwelling at the arrow head. A circle is drawn clockwise around the arrow head to indicate how long time it should be fixated. (Right:) The image gets blurred
when the gaze tracker looses contact with the eyes which provides immediate feedback to change the head position in front of the tracker.
nally, instant engagement should not be prevented by lengthy calibrations.
We designed a digital LEGO construction manual to ad-dress some of these challenges and tested it in two toy stores. Forward- and backward steps are made by gazing at arrow icons. The views of the LEGO model are controlled by head movements: leaning forward or backward makes the model zoom in or out; an interaction principle originally proposed by (Harrison & Dey, 2008). Moving the head sideways makes the model rotate left or right, c.f. Fig. 2 (Bottom).
Both eye- and head- movements are tracked by the very same gaze sensor (Mardanbegi et al., 2012).
The designers at LEGO were particularly interested in knowing more about the users’ engagement during a building task. This information is very difficult for them to get without asking questions which would disturb the child. Measuring EEG, heart-rate or galvanic skin response requires wiring the children, which does not scale well to user studies with a high number of participants outside a lab. They would also like to know if some steps took an exceptionally long time since this might suggest to split them. Basic logging of user input provides the designers some insights, but won’t tell if the time was spent on interpreting the pictorial instructions or working with the bricks. So, subsequently we analyzed the view times and pupil data recorded in the store to explore if changes would indicate also changes in performance during the building task.
Our paper has three contributions: We present an applica-tion where gaze provides a hands-free substituapplica-tion for click, pitch and swiping, and although not an entirely new ap-proach, we suggest that it works well for assembly tasks like the one studied here and allows for easy behavioural data col-lection. We conduct a study to test if the instructions can be used immediately in a realistic task context. Finally, we ana-lyze if the gaze data recorded may provide insights that could possibly be linked to how much attention sub-parts of the task received or to individual task events. Although focus-ing on a LEGO assembly task, we consider the application generic for a broad range of step-wise pictorial instructions
Figure 2. (Top:) Flowchart of the gaze interactive system
showing how the information obtained from the eye tracker is mapped to different functions; IPD=Inter-Pupillary Dis-tance. The "head pos estimater" estimates the horizontal off -set of the head vs. the center of the bounding box. (Bottom:)
Interaction with the LEGO construction manual on a tablet using gaze and head movements. The user looks at the right arrow button to go to the next step (a), the button gets ac-tivated after dwelling (b), once dwell-time is completed, a moving circle guides the user’s gaze back towards the digital model where new bricks are highlighted in yellow (c). Users can rotate the digital model by moving their head to the sides (d). Zooming can be done by leaning forward and backwards (e and f).
typically found at workplaces, educational institutions and in public domains. In laboratory work, for instance, a chemist is often required to follow specific procedures for handling sub-stances. Gaze interaction with a workbench monitor would allow the chemist to navigate procedure descriptions without contaminating the display. At the same time, gaze tracking would be able to confirm that each instruction had been care-fully studied. Similarly, students may engage with digital ed-ucational resources in a step-wise order, keeping both hands free for note taking. In this case, pupil data could indicate which parts of the learning material required most mental effort from students.
A Gaze Interactive Pictorial Instruction
Current digital versions of LEGO instructions for tablets1present each next building step when pressing an arrow-button in the right corner; going back is done by an-other button in the left corner. Zooming in on the model may be done by finger pitching while rotations may be done by swiping. We converted these basic functions to a gaze- and head- activated interface by having the
[image:2.612.323.543.75.239.2] [image:2.612.57.294.78.146.2]forward/backward command done by dwelling on two arrow buttons shown on the right and the left sides of the screen, and the zooming and rotation done via head movement, s.c.f. Fig. 2 (Bottom).
The gaze tracker model used for the experiment had a lim-ited tracking box of approximately x=30 cm, y=20 cm and z=10 cm at 40 cm distance. Whenever gaze tracking was lost, which happened every time the child looked away from the screen, the image of the model would become slightly blurred. Only by looking at the screen and keeping the head within the tracking box would the child be able to regain a clear image. Preliminary tests with an early prototype had found this feedback to be effective; we observed that the children quickly learned how to reposition their head within the invisible boundaries of the sensors view angle whenever their head had been outside the box. In addition, the intro screen of the manual showed nothing but a LEGO head sym-bol and a small rectangle in the center. The head followed the movements of the child’s head. The child was asked to place it within the small rectangle which would then launch the instruction application, initially teaching the child where to position the head in front of the monitor.
The active areas of the dwell buttons are located on either side of the screen, covering the entire screen height and 20% of the screen width, each. However, the visible size of the buttons does not cover the same area; the users see only an arrow in the middle of each activation areas (Fig. 1). By this design users experience a good tracking precision without requiring high precision tracking equipment and without a need to calibrate the gaze tracker for each user. Based on observations in a pilot study we decided to set dwell-time to 600ms. Previous work on dwell-time gaze interaction tech-nique has shown that dynamic feedback during the dwell-time activation can significantly improve the users’ perfor-mance and reduce subjective workload (Majaranta, MacKen-zie, Aula, & Räihä, 2006). Thus, we provided two different kinds of feedback. During the the dwell-time, a visual feed-back is given by shrinking the arrow and making it smaller while an animated circle is drawn around the arrow indicat-ing the dwell time progression (Fig. 1; LEFT). If the user looks away from the arrow before the dwell-time is finished, the dwell-time timer and all the animated feedback will re-verse. This gives the system more robustness against poten-tial noise or inaccuracy in the gaze tracking. Upon dwell-time completion, there will be a short click sound and then a small animated circle will move from the dwell button to-wards the center of the screen, guiding the user’s gaze back towards the model again. New bricks added in each step gets highlighted in yellow.
The user can zoom in and out the view of the digital model by leaning forward and backwards towards the screen. Sim-ilar ideas has been tested before using a camera and face tracking, e.g. by (Harrison & Dey, 2008). However, we just
use data from the gaze sensor to estimate the relative distance between the viewer and the screen; no extra cameras are im-plied (for more details on how to do this, see the Apparatus section ).
Related Work
Video-based analysis of manual activities and logging of input to digital devices are standard methods in usability studies. Recently, gaze tracking has become more com-mon because it provides additional information on how much time each area is looked at, which elements that tends to get overlooked, and which parts are frequently revisited (Bojko, 2013). Measures and visualisations of gaze movements are widespread within experimental psychology (Holmqvist et al., 2011) and eye movement recordings have been used in numerous research projects on naturalistic tasks (Land & Tatler, 2009).
Gaze interaction is now common practice within assistive technology (Majaranta et al., 2011), and substantial amount of HCI-research has explored the potentials of this modality, e.g. (Sibert & Jacob, 2000), (Zhai, 2003). Standard input methods are dwell-time activation, (i.e. looking at a target for a set time, for instance 500 ms, e.g. (Ware & Mikaelian, 1987)); stroke activation (i.e. looking in one or several di-rections, in a consecutive order, with a saccade in between, e.g. (Drewes & Schmidt, 2007)); and pursuit activation (i.e. following a smoothly moving target area, e.g. (Vidal, Bulling, & Gellersen, 2013)). Current gaze interaction re-search focus on challenges and potentials in smart-phone in-teraction (e.g. (Rozado, Moreno, Agustin, Rodriguez, & Varona, 2015)), smart-watches (e.g. (Hansen et al., 2016)), ubiquitous displays (e.g. (Velloso, Wirth, Weichel, Esteves, & Gellersen, 2016)) and head mounted displays (e.g. (Itoh & Klinker, 2014)).
et al., 2017) reports load-induced pupil dilations of approxi-mately 10%.
Furthermore, it has been shown by Bradley, Miccoli, Es-crig, and Lang that the pupil size is modulated by activation of the (sympathetic) nervous system when viewing affective pictures (Bradley et al., 2008). There is a growing body of evidence that the pupil size is related to neural activity in the Locus Coeruleus (Gilzenrat, Nieuwenhuis, Jepma, & Cohen, 2010; Joshi, Li, Kalwani, & Gold, 2016; Murphy, O’Connell, O’Sullivan, Robertson, & Balsters, 2014; Eckstein, Guerra-Carrillo, Singley, & Bunge, 2017), which is linked to arousal and attentional processes (Aston-Jones, Rajkowski, & Co-hen, 1999) and utility optimization and the dichotomy be-tween exploration and exploitation (Aston-Jones & Cohen, 2005). Thus, the pupil size is influenced by complex emo-tional and cognitive processes, not all of which we can con-trol in the present experimental setup.
Finally, in visual tasks the pupils are constantly moving with the eyes and the eye region moves with the head. So it is still an open question if tracking of pupil dilations is feasible outside a lab where changes in ambient light are un-known and where users are free to move their head as the task requires. To our knowledge, the present work is the first to combine gaze interaction with pupil data logging in a nat-uralistic task setting involving inexperienced users.
User Study
Shops and shopping malls are attractive locations for user studies aiming at a high number of observations because they offer participants who can be recruited easily. In-store test-ing has a number of challenges, though: available space may be limited, lighting conditions may not be controlled, and participants may be distracted by noise and other shoppers coming by. We addressed these challenges by designing a simple interface, for an experiment that would last less than 20 minutes, and by having adult assistants guarding each par-ticipants at all time.
Participants
A total of 72 participants were recruited among children accompanied by an adult in two LEGO stores, located in Germany and Denmark. All of the children were between 6 to 12 years, regular users of mobile phones and/or tablets, and all of them were familiar with LEGO model construc-tion. None of them were wearing glasses or contact lenses. Consent was obtained from the accompanying adult to record data and video.
Apparatus
We used two Microsoft Surface Pro tablets with Windows 8, which executed the instruction application, conducted gaze tracking, and logged use data. A 30 HZ low-cost (100
US$) binocular gaze tracker from The Eye Tribe was used for the experiment. It recorded binocular gaze data, when the participants were looking at the tablet, through a USB 3.0 with a claimed accuracy of 0.5 to 1.0 degree of visual angle for the gaze point. Additionally, a linear pupil size estimate is returned by the tracker in arbitrary units, with no specified accuracy. The algorithm behind this estimate is proprietary, but publicly proposed (Lin, Pan, Wei, & Yu, 2010) methods involves fitting an elliptical shape to the outline of the pupil, correcting for the angle of view and returning the estimated radius or diameter of the pupil, which would allow the esti-mate to obtain subpixel resolution. This is also the method suggested by Klingner et al. (Klingner et al., 2008). We have no reason to believe the Eye Tribe tracker will do worse than publicly available algorithms. At viewing distances between 10 and 40 cm, a typical pupil size that varies between 2 and 5 mm will have a viewing angle between 0.29 and 2.9 de-gree seen from the tracker. Assuming a native resolution of 1 minute of viewing angle2, this corresponds to a range be-tween 18 and 175 pixels, with a typical 3.5 mm pupil at 35 cm distance recording at approximately 34 pixels.
The Eye Tribe tracker has been compared against other trackers with respect to gaze points (Dalmaijer, 2014; Ooms, Dupont, Lapon, & Popelka, 2015) and pupil size esti-mates (Dalmaijer, 2014), and has previously been used to assess load ( ˇCegovnik, Stojmenova, Jakus, & Sodnik, 2018).. For the later, no quantifiable accuracy was derived, but it was qualitatively demonstrated to produce similar results to an EyeLink 1000 in controlled conditions, concluding that "the spatial precision and accuracy are good enough for fixation checking, point-of-regard analyses, and pupilome-try" (Dalmaijer, 2014) for the Eye Tribe tracker.
The assembly model was a LEGO Mini VW T1 Camper Van (Model # 40079), featuring 76 pieces and targeted at children 6 years and above. The original paper manual for this model had divided the instruction into 18 pictures. We could reproduce them digitally by use of a 3D model and in addition the model would allow users to zoom and rotate every image. The original paper manual consist of 18 steps with 3 of the steps broken further down into sub-steps. Our digital version showed all of the steps one-by-one, ending up with a total of 27 views. For zooming, we useinter-pupillary
distance(IPD) as a heuristic to approximate the distance
be-tween a user’s head and the screen. The IPD is calculated as
2In an experiment performed by the authors, the IR camera used
the euclidean distance between the estimated center positions of the pupil, which are returned by the eye tracking as coor-dinate sets (x,y)∈[0..1]2inside an imagined bounding box. We only zoom if the absolute difference of the current to the
last stableIPD is equal to or larger than =0.01 and some
zoom factorD=11. The function fzoom(d)=(d·D)2gives the distance from the 3D model to the camera for a stable
IPDd. The last IPD for which zooming occurred is now
re-garded as the last stable IPD. Using a last stable IPD prevents jitter. We linearly interpolate between camera distances over 200ms. Zooming is absolute.
We use the relative position of the user’s head vs the cen-ter of the screen to initiate a continuous relative rotation of the 3D model3. Head coordinates are computed as the cen-ter point between both pupil cencen-ters. If the user’s head is more than 1/3 left or right of the the center of the tracking bounding box, a continuous rotation of the 3D model in the opposite direction starts. We use the distance of the head to the closest point on the bounding box to determine rotation speed, where a larger distance results in a faster rotation. The rotation speed is given in degrees by fδ(x)=sgn(x)·x2·S, wherexis the distance between thex-value of the head coor-dinates and thex-value of the closest point on the bounding box;sgnis the sign function; andS some configurable rota-tion speed factor, in our setupS =10−5. The value of f
δis added to the current camera angle at screen-refresh rate. The bounding box was positioned at tracking image center with a width of 300 pixels.
Procedure
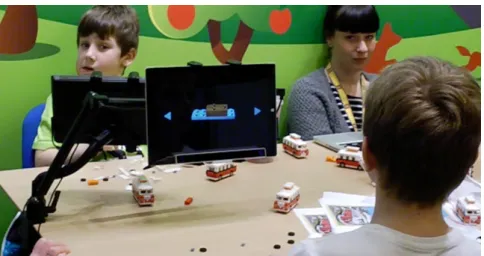
The child was seated comfortably at a table in front of one of two tablets, which was positioned approximately 40 cm away and 20 cm above the table by use of a bendable tablet holder; see Fig. 3. The session started by asking the child to position a LEGO figure head on the screen inside a box by moving his or her own head. This would start a short 1-minute interactive training session where the child would forward and reverse a 3-step instruction and try out zooming and rotation. After this introduction, the study was started by launching the full instruction and pulling the 76 LEGO pieces out on the table. The children conducted the building process by themselves and only got adult assistance if they were unable to continue on their own. After the experiment all participants were given a small LEGO box as appreciation for their participation. In total, the session lasted between 15 and 20 minutes.
Design and analysis
The study was performed as a observational study with all of the participants having one single exposure to the same condition.
[image:5.612.313.555.77.205.2]During each session, all data from the eye tracker as well as all user-initiated navigation and zooming actions were
Figure 3. Two children using the gaze interactive building instruction in a toy store with an adult assistant next to them.
recorded for subsequent analysis. From this recorded data, we derived the following measures for our study: task time for each building step (i.e. the cummulative time displaying instructions belonging to each step); view time per step (i.e. the cummulative time where gaze positions are recorded, in-dicating eyes on the tablet, within that step), play time per step (i.e. task time subtracted view time), number of regres-sions (i.e. how many times did the child go back to a pre-viously visited step) and what fraction of the view time was spent during regressions vs the total view time, for each step. Zoom and rotations were also counted.
Eight participants were removed from the analysis be-cause they did not complete the building process. This was due to problems with gaze tracking; mostly because the chil-dren did not understand to re-position their head correctly in front of the tracker. Of the remaining 64, five had an uneven distribution of recorded pupil data with more than 75% in either the first or second half of the session, and were also removed from the analysis.
The pupil size estimate from the eye tracker varies be-tween the values 17.0 and 67.1 (the lowest 5% percentile and the highest 95% percentile across all participants) with an overall median value of 32.5. With an assumed pixel-resolution of 1 arcminute, the median value corresponds to a pupil diameter of 3.3 mm at a distance of 35 cm. At the same distance, the lowest value corresponds to 1.7 mm and the the highest to 6.8 mm (although at a distance of 10 cm the highest value would correspond to only 2.0 mm).
Before use, the pupil size estimates from the participants were filtered as follows: First, samples where data is only available for one eye are discarded. Then in an effort to re-move outliers a Hampel filter (with a radius of 13 samples at 30 Hz, and nsigma of 3) was applied, and in the pro-cess any outliers that have up to 13 neighbours within the window are replaced; this also interpolate blink periods up to 400 ms with the median value of a rolling window over
3Rotating or tilting the head itself is not meant to initiate any
the surrounding pupil size estimates. The linear pupil size estimate is hereafter compensated for changes in the calcu-lated IPD, and any samples where the IPD is less than 50% of the median value over the session are further removed. The average Pearson Correlation Coefficient R between left and right eye is hereafter 0.83; this indicates that the vari-ations of the (independently estimated) left/right eye pupil sizes are strongly correlated, and rather than being artifacts of the measurement may point towards a common causal fac-tor. Finally, the pupil size estimates are converted to a rel-ative baseline, the median value across the experiment for each participant4. In the absence of an absolute, linear (met-ric) pupil size estimate, this is done in order to calculate ag-gregate values in a comparable way across participants, re-sulting in a metric similar to the “percent in change pupil size” originally proposed by (Hess, 1972). Further, when comparing pupil size estimates between (sets of) tasks, we use an average PCPS (APCPS) across the periods where the participant is engaged in the selected tasks, similar to (Iqbal, Zheng, & Bailey, 2004; Iqbal, Adamczyk, Zheng, & Bailey, 2005; Bailey & Iqbal, 2008).
Results
A large majority, namely 64 of the 72 participants (i.e. 88%), managed to complete the model, and we were able to get a full gaze data set from 59 participants. In average, the 59 children spent 14 minutes and 20 seconds (S.D. 6 minutes and 33 seconds) on the task. They made 5.6 regressions (S.D
=5.6) and conducted 176 zoom- and 67 rotation- actions in average (S.D. 161 and 44 respectively), all indicative of the differences between individual children. It is, however, not possible to tell if the zoom and rotations was done on purpose or just happened as an effect of the child moving.Hence, we do not investigate any correlation between zoom and rota-tions and other factors.
View Times
The width of each column in Fig. 4 shows the mean du-ration of each individual step. The step division corresponds to the one used in the paper manual; in our digital version there were two views for step seven, three for step 10, and four for step 17. The bars shows the distribution of time within each step: The light blue bar shows the proportion of time spent manipulating LEGO bricks (“play time”), the the gray bars show the time spent looking at the instructions in the first visit and the coloured bars show the time spent in a regression: a subsequent visit to the step once a later step had commenced. The total time spent looking at instructions, the “view time”, was on average 49.4% (S.D: 10.9%), i.e. roughy half of the time was spent studying the instruction manual. However, some of the children spent a lot of time looking at the tablet while assembling the model; the most extreme case would look at it 78% of the time. Others looked
0 100 200 300 400 500 600 700 800
Time (s) 0
20 40 60 80 100
Prop
ortion
of
Time
(%)
1 2 3 4 5 6 7 8 9 10 11 12 13 14 15 16 17
[image:6.612.320.552.83.204.2]Manipulating LEGO bricks Instruction First-Visit Instruction Regression
Figure 4. Average time spent within each building step (x-axis) with the stacked bars showing the proportion of the time spent either manipulating bricks (light blue) or when the gaze point was at the tablet showing the Instruction Manual (y-axis); the later measure is divided into First-Visits (gray) and Regressions (yellow). In most steps, between 40% and 60% of the time is spent studying the instruction manaual, with an average of 49.4%.
at the tablet more rarely; one of the participants only viewed it 27% of the time.
0 2 4 6 8 10 12 14 16
Step 0.0
0.2 0.4 0.6 0.8 1.0
Relative
Time
(%)
[image:6.612.321.552.384.503.2]Relative View Time Relative Play Time
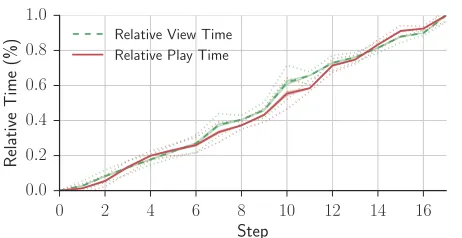
Figure 5. Progress (in relative time) to completion of each step, shown as the view time (green dashed) and playing time (red solid). The shaded area behind each line indicate the Standard Error of the Mean, and the dotted lines indicate the sample standard deviation.
Fig. 5 shows the progress of the building process rela-tive to the accumulated time: instruction view time (green dashed) and brick play time (red solid). Note that the progress is remarkably linear, for both, indicating a steady pace through the construction. The Pearson correlation be-tween view- and play- time wasR=−0.837,p<0.001. Our analysis does not, however, intend to address the correlation
4Note that we avoid using a z-score normalization, as we cannot,
between the design and the time spent executing the building process any further.
Pupil Dilations
2 4 6 8 10 12 14 16
Step
−8 −6 −4 −2 0 2 4 6 8
Rel
Pupil
Size
(%)
Uncorrected Pupil Size
[image:7.612.60.292.147.273.2]Luminance Compensated Pupil Size
Figure 6. Mean pupil size across all participants relative to their individual baseline, at each building step (uncorrected (yellow dashed) and after luminance correction (blue)). The shaded area behind each line indicate the Standard Error of the Mean, and the dotted lines indicate the sample standard deviation.
Fig. 6, shows the average percent change in pupil size (APCPS) relative to the baseline, at each step, across all par-ticipants. The baseline for each participant is the overall me-dian value of the pupil size estimate. The yellow graph de-picts the uncorrected pupil size with the Standard Error of the Mean shaded. The blue graph shows the same data after attempting to compensate for luminance: This was done by calculating the average screen luminance for each step from the image being shown (in relative units) as an approximation of the displayed luminance, and then regressing the pupil size against this approximated luminance, using a conventional linear regression model. The residual variance can then be taken as a representation of the luminance compensated pupil size, building on the premise that the pupil size can be mod-elled as the addition of two components, one caused by lumi-nance and the other by other (subjective) factors, as demon-strated by Pfleging, Fekety, Schmidt, and Kun (Pfleging et al., 2016). This does not account for the response time of the pupillary light reflex (Beatty & Lucero-Wagoner, 2000), and is thus only a coarse approximation. Both graphs show an initial increased pupil size and an overall declining trend. The effect of the luminance is mainly visible towards the end where an increasing number of white bricks in the model made the screen brighter; however both graphs have similar declining trends. Note that as the eye tracker is only able to record data when the participant is looking directly at the screen and with the head inside the bounding box, no data is available when the participant looks at the bricks on the table; in our terminology we only have pupil data for the view time
and not for the play time.
Following the analysis method by (Hyönä, Tommola, & Alaja, 1995), we divided the tasks into 3 phases: begin-ning (steps 1 to 6), middle (steps 7 to 12) and end (steps 13 to 17), in order to compare the task-internal variation in pupil size. The mean APCPS values were 1.74, 0.02 and -1.43 % with a Standard Error of the Mean of 0.27, 0.20 and 0.18, respectively. There was a significant effect, as ev-idenced by a non-parametric Kruskal-Wallis testH = 77.7 and p < 0.000001, and a subsequent Post-hoc analysis yielded pairwise Wilcoxon comparisons at the p <0.00001 values between any of the 3 divisions.
2 4 6 8 10 12 14 16
Step
−2 0 2 4 6 8
Pupil
Size
Diff
(%-p
oint) Pupil Size: Regression vs Firstp[H
0]<0.05
p[H0]<0.01
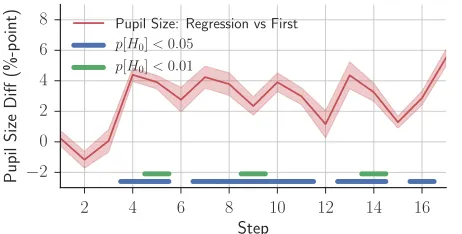
Figure 7. Pupil Size difference between first visit and
re-gressions at each step (red), with Standard Error of the Mean indicated as a shade. Confidence levels that the values are different (at 5% and 1%) also indicated (blue and green, re-spectively).
Inspired by the work of Bailey and Iqbal (Bailey & Iqbal, 2008), we looked further into the changes in pupil size when people advanced and regressed between steps. Fig. 7 shows the difference in APCPS calculated as the average value over the time spent in first visit vs the average value over the time spent in any subsequent regressions to the same step. On average pr. step, the participants spent 25.0 seconds viewing the instructions, and all valid gaze data, grouped accordingly into first and subsequent visits for each step, has been in-cluded in the APCPS metrics. Apart from the initial phase comprised of steps 1 to 3, there is a difference of APCPS when comparing first visit to regressions (subsequent visits), at the confidence levels indicated in Fig. 7 (p<0.05 in blue and p < 0.01 in green). With the exception of steps 6, 12, 15 and 17, the difference is statistically significant and is ap-proximately 3%.
Discussion
[image:7.612.321.552.243.360.2]main questions raised by LEGO designers, namely if there are indications of changes in engagement and if some steps stands out as more difficult, can be answered partially.
Measures of average time pr. task step and time spent looking at instructions (view time) were easy to collect and are not confounded by luminance variations or head move-ments. In our case, these metrics showed signs of a well de-signed instruction manual with no individual steps standing out. The gains of collecting view time in addition to a stan-dard log of button activations were, however, not obvious for this model, since view time and step time correlated well.
By tracking pupil size and compensating for head move-ments, we were able to document A) an overall decreasing trend throughout the building task, indicated by a significant drop in the APCPS, and B) a significant difference of most regressions compared to first visit to each step. With the generally accepted link between changes in pupil size and changes in effort, our results may suggest that 1) a higher ef-fort is required initially (what Hyona refers to as the familiar-ity effect(Hyönä et al., 1995)), and 2) regressions, indicative of task problems, require additional effort, implied by signif-icant increases in pupil size for regressions made at 11 out of 17 steps. Note that we have not used the trend observed in A) to de-trend (Strauch, Georgi, Huckauf, & Ehlers, 2015) the APCPS before performing step B), but have chosen to report the two results independently of each other; if we had done so the differences would have been (slightly) larger, since regressions by definition appear later than first visits.
However, it cannot, on the basis of this study alone, be concluded that the changes are caused solely by differences in effort; factors like increasing fatigue, changes in motiva-tion or engagement, frustramotiva-tion or other emomotiva-tional factors could also possibly impact the results. From this perspective, the pupil size differences between regressions and first visits to a building step are more intriguing, and may more strongly suggest that cognitive or emotional factors as the underlying cause. It is, however, not possible to say whether the regres-sions made the pupil dilate because they made the children frustrated or the children exerted themselves - maybe even both. With a broad analogy, pupil changes may be like a gauge showing how fast a vehicle is running, but we do not know whether it’s because the vehicle is going downhill or because the accelerator is activated. In any case, knowing that a specific type of event (i.e. a regression) consistently correlate with changes in the observable pupil size suggest it is relevant to keep track of that particular type of event. Fur-ther research could potentially identify oFur-ther types of events, such as prearranged surprises or rewards, that may have sim-ilar effects on pupil dilation. Eventually, applications could dynamically monitor the flow of such events that have shown a correlation to pupil size changes, avoiding, for instance, giving rewards just after a surprise, or suggesting to take a break after a period with unusually high pupil dilations. It
is an open research question if this micro-management of events on the basis of pupil size measures would create a better overall user experience or improve efficiency.
A decrease in arousal caused by fatigue, or getting used to the task and the environment leading to habituation, may also play a role behind the observed decrease in pupil size throughout the building session, even though the children did not show other signs of being tired out, and were eager to finish the session - even those who could had difficulties using the application. Although we cannot at present point to the key causal factors, our analysis nevertheless showed a significant difference between the start, the middle and the final part, while (Hyönä et al., 1995) only found a sig-nificant decrease between the first and the middle division, not the last two. This suggest future studies to investigate if changes in dilation are different for different tasks across the full task and between task divisions, and additional ex-perimental methods to identify and isolate the independent factors affecting the pupil size estimates.
Measuring pupil dilations in-the-wild is especially warned against because the impact of luminance changes are consid-ered larger than the effects of task related changes. In the current study, we made the recordings in shop areas with ho-mogeneous ambient light. Our observations suggest that in some situations similar to ours, where the luminance of the objects being viewed (here: the tablet display) can easily be determined, they could also to some degree be compensated for by standard regression methods.
We were not able to estimate or correct for all types of head pose changes based on the inter-pupillary distance alone, which could therefore be an additional confounding factor5. Hence, it is advisable to use eye trackers for future studies that have robust head-movement/pose estimation(Al-Rahayfeh & Faezipour, 2013) for applications such as the one suggested here.
Future research should investigate if view time, regres-sions and pupil measures would correlate with other biomet-ric measures, such as blink rate, heart rate variability, EEG or galvanic skin response. If so, this would be a strong ar-gument for including pupil dilation metrics as first choice because they are non-invasive, continuous and have low la-tency (Bailey & Iqbal, 2008).
Pupil metrics are particular prospective if on-line gaze in-teractive building instructions are provided for augmented reality glasses, since the metrics could then be collected in continuous large-scale studies, and changes in illumination compensated for by analyzing the image data from the build-in image sensor of the augmented reality glasses. In the
fu-5For instance, rotating the head would also show as a reduced
ture, pupil metrics may even be used to ensure every builder being rightly challenging by offering an instruction dynami-cally adapting to the level of effort shown by the individual builder.
We used a well designed instruction manual on a small scale model that has been on the market for many years. However, the results seem to suggest that the concept could be used also for e.g. early testing of new models, for A/B testing different versions, or verifying against specific seg-ments (age, gender, nationality, previous building experi-ence, etc.). It may also be of some use comparing metrics be-tween different models. Finally, by introducing steps that are deliberately designed to be difficult, for instance with many bricks added at once, the impact on effort, view time and regressions could be further examined.
Conclusion
Using a low-cost 30 Hz gaze tracker in an unconstrained, real-task setting we have provided successful gaze- and head-interaction for a large majority of the participants trying it. Concurrently, view time and pupil dilation metrics can be recorded, and we suggest this could potentially provide pupil data reflecting changes in cognitive or emotional states and effort, both across the task and evoked by regressions be-tween tasks steps, when confounding factors to some degree can be accounted for or averaged out over many participants.
Acknowledgement
The work was in part supported by Innovation Fund Den-mark through the project Eye Tracking for Mobile Devices. Thomas Hoger, 3spin GmbH, conducted part of the user study. Lego A/S provided building material and feedback. The Eye Tribe helped developing the application.
References
Ahern, S., & Beatty, J. (1979). Pupillary responses during infor-mation processing vary with scholastic aptitude test scores. Sci-ence,205(4412), 1289–1292. doi: 10.1126/science.472746 Al-Rahayfeh, A., & Faezipour, M. (2013). Eye tracking and head
movement detection: A state-of-art survey. IEEE Journal of Translational Engineering in Health and Medicine,1, 2100212-2100212. doi: 10.1109/JTEHM.2013.2289879
Aston-Jones, G., & Cohen, J. D. (2005). An integrative theory of locus coeruleus-norepinephrine function: adaptive gain and optimal performance.Annual Review of Neuroscience,28, 403– 450. doi: 10.1146/annurev.neuro.28.061604.135709
Aston-Jones, G., Rajkowski, J., & Cohen, J. (1999). Role of locus coeruleus in attention and behavioral flexibility. Bio-logical Psychiatry,46(9), 1309 - 1320. doi: 10.1016/ S0006-3223(99)00140-7
Bailey, B. P., & Iqbal, S. T. (2008). Understanding changes in mental workload during execution of goal-directed tasks and its application for interruption management. ACM Transactions
on Computuper-Human Interaction, 14(4), 21:1–21:28. doi: 10.1145/1314683.1314689
Beatty, J., & Lucero-Wagoner, B. (2000). The pupillary system. In
Handbook of psychophysiology(Vol. 2, pp. 142–162).
Bojko, A. (2013). Eye tracking the user experience. Rosenfeld Media.
Bradley, M. M., Miccoli, L., Escrig, M. A., & Lang, P. J. (2008). The pupil as a measure of emotional arousal and autonomic acti-vation.Psychophysiology,45(4), 602-607. doi: 10.1111/ j.1469-8986.2008.00654.x
ˇ
Cegovnik, T., Stojmenova, K., Jakus, G., & Sodnik, J. (2018). An analysis of the suitability of a low-cost eye tracker for assessing the cognitive load of drivers. Applied Ergonomics,68, 1 - 11. doi: 10.1016/j.apergo.2017.10.011
Dalmaijer, E. (2014). Is the low-cost eyetribe eye tracker any good for research? (Tech. Rep.). PeerJ PrePrints. doi: 10.7287/peerj.preprints.585v1
Drewes, H., & Schmidt, A. (2007). Interacting with the computer using gaze gestures. InProceedings of the 11th ifip tc 13 interna-tional conference on human-computer interaction - volume part ii(pp. 475–488). Berlin, Heidelberg: Springer-Verlag.
Eckstein, M. K., Guerra-Carrillo, B., Singley, A. T. M., & Bunge, S. A. (2017). Beyond eye gaze: What else can eye-tracking reveal about cognition and cognitive development?
Developmental Cognitive Neuroscience, 25, 69 - 91. doi: 10.1016/j.dcn.2016.11.001
Gilzenrat, M. S., Nieuwenhuis, S., Jepma, M., & Cohen, J. D. (2010, 01). Pupil diameter tracks changes in control state pre-dicted by the adaptive gain theory of locus coeruleus function.
Cognitive, Affective,&Behavioral Neuroscience, 10(2), 252– 269. doi: 10.3758/CABN.10.2.252
Granholm, E., Asarnow, R. F., Sarkin, A. J., & Dykes, K. L. (1996). Pupillary responses index cognitive resource limita-tions. Psychophysiology,33(4), 457-461. doi: 10.1111/ j.1469-8986.1996.tb01071.x
Hansen, J. P., Lund, H., Biermann, F., Møllenbach, E., Sztuk, S., & Agustin, J. S. (2016). Wrist-worn pervasive gaze interaction. In
Proceedings of the ninth biennial acm symposium on eye track-ing research&applications(pp. 57–64). New York, NY, USA: ACM. doi: 10.1145/2857491.2857514
Harrison, C., & Dey, A. K. (2008). Lean and zoom: Proximity-aware user interface and content magnification. In Proceed-ings of the sigchi conference on human factors in computing systems (pp. 507–510). New York, NY, USA: ACM. doi: 10.1145/1357054.1357135
Hess, E. H. (1972). Pupillometrics: A method of studying men-tal, emotional and sensory processes. In N. S. Greenfield & R. A. Sternbach (Eds.), Handbook of psychophysiology (pp. 491–531). Holt, Rinehart & Winston, New York.
Holmqvist, K., Nyström, M., Andersson, R., Dewhurst, R., Jaro-dzka, H., & Van de Weijer, J. (2011). Eye Tracking: a com-prehensive guide to methods and measures. Oxford University Press.
Hume, T. (2016). WIP Open source IR eye tracker for the Eye Tribe tracker hardware [trishume/SmartGaze].GitHub repository. Re-trieved fromhttps://github.com/trishume/SmartGaze Hyönä, J., Tommola, J., & Alaja, A.-M. (1995). Pupil
in-terpretation and other language tasks. The Quarterly Jour-nal of Experimental Psychology, 48(3), 598–612. doi: 10.1080/14640749508401407
Iqbal, S. T., Adamczyk, P. D., Zheng, X. S., & Bailey, B. P. (2005). Towards an index of opportunity: Understanding changes in mental workload during task execution. In Pro-ceedings of the sigchi conference on human factors in comput-ing systems(pp. 311–320). New York, NY, USA: ACM. doi: 10.1145/1054972.1055016
Iqbal, S. T., Zheng, X. S., & Bailey, B. P. (2004). Task-evoked pupillary response to mental workload in human-computer inter-action. InChi ’04 extended abstracts on human factors in com-puting systems(pp. 1477–1480). New York, NY, USA: ACM. doi: 10.1145/985921.986094
Itoh, Y., & Klinker, G. (2014). Interaction-free calibration for op-tical see-through head-mounted displays based on 3d eye local-ization. In2014 ieee symposium on 3d user interfaces (3dui)
(pp. 75–82).
Joshi, S., Li, Y., Kalwani, R., & Gold, J. (2016). Relation-ships between pupil diameter and neuronal activity in the locus coeruleus, colliculi, and cingulate cortex. Neuron,89(1), 221 -234. doi: 10.1016/j.neuron.2015.11.028
Kahneman, D., & Beatty, J. (1966). Pupil diameter and load on memory. Science, 154(3756), 1583–1585. doi: 10.1126/ sci-ence.154.3756.1583
Klingner, J., Kumar, R., & Hanrahan, P. (2008). Measuring the task-evoked pupillary response with a remote eye tracker. In
Proceedings of the 2008 symposium on eye tracking research& applications(pp. 69–72). New York, NY, USA: ACM. doi: 10.1145/1344471.1344489
Land, M., & Tatler, B. (2009).Looking and acting: vision and eye movements in natural behaviour. Oxford University Press. Lin, L., Pan, L., Wei, L., & Yu, L. (2010). A robust and accurate
detection of pupil images. In2010 3rd international conference on biomedical engineering and informatics(Vol. 1, p. 70-74). doi: 10.1109/BMEI.2010.5639646
Majaranta, P., Aoki, H., Donegan, M., Hansen, D. W., Hansen, J. P., Hyrskykari, A., & Räihä, K.-J. (2011). Gaze interaction and applications of eye tracking: Advances in assistive technologies. Hershey, PA: Information Science Reference - Imprint of: IGI Publishing.
Majaranta, P., MacKenzie, I. S., Aula, A., & Räihä, K.-J. (2006). Effects of feedback and dwell time on eye typing speed and ac-curacy.Universal Access in the Information Society,5(2), 199– 208. doi: 10.1007/s10209-006-0034-z
Mardanbegi, D., Hansen, D. W., & Pederson, T. (2012). Eye-based head gestures. InProceedings of the symposium on eye tracking research and applications(pp. 139–146). New York, NY, USA:
ACM. doi: 10.1145/2168556.2168578
Murphy, P. R., O’Connell, R. G., O’Sullivan, M., Robertson, I. H., & Balsters, J. H. (2014). Pupil diameter covaries with bold ac-tivity in human locus coeruleus.Human Brain Mapping,35(8), 4140-4154. doi: 10.1002/hbm.22466
Ooms, K., Dupont, L., Lapon, L., & Popelka, S. (2015). Accuracy and precision of fixation locations recorded with the low-cost eye tribe tracker in different experimental setups.Journal of eye movement research,8(1). doi: 10.16910/jemr.8.1.5
Orlosky, J., Itoh, Y., Ranchet, M., Kiyokawa, K., Morgan, J., & Devos, H. (2017). Emulation of physician tasks in eye-tracked virtual reality for remote diagnosis of neurodegenerative disease.
IEEE Transactions on Visualization and Computer Graphics,
23(4), 1302-1311. doi: 10.1109/TVCG.2017.2657018
Pfleging, B., Fekety, D. K., Schmidt, A., & Kun, A. L. (2016). A model relating pupil diameter to mental workload and lighting conditions. InProceedings of the 2016 chi conference on human factors in computing systems(pp. 5776–5788). New York, NY, USA: ACM. doi: 10.1145/2858036.2858117
Rozado, D., Moreno, T., Agustin, J. S., Rodriguez, F. B., & Varona, P. (2015). Controlling a smartphone using gaze gestures as the input mechanism. Humanâ ˘A¸SComputer Interaction,30(1), 34-63. doi: 10.1080/07370024.2013.870385
Sibert, L. E., & Jacob, R. J. K. (2000). Evaluation of eye gaze interaction. InProceedings of the sigchi conference on human factors in computing systems(pp. 281–288). New York, NY, USA: ACM. doi: 10.1145/332040.332445
Strauch, C., Georgi, J., Huckauf, A., & Ehlers, J. (2015). Slow trends. InProceedings of the 2nd international conference on physiological computing systems(pp. 61–66).
Velloso, E., Wirth, M., Weichel, C., Esteves, A., & Gellersen, H. (2016). Ambigaze: Direct control of ambient devices by gaze. InProceedings of the 2016 acm conference on designing inter-active systems(pp. 812–817). New York, NY, USA: ACM. doi: 10.1145/2901790.2901867
Vidal, M., Bulling, A., & Gellersen, H. (2013). Pursuits: Spon-taneous interaction with displays based on smooth pursuit eye movement and moving targets. In Proceedings of the 2013 acm international joint conference on pervasive and ubiquitous computing(pp. 439–448). New York, NY, USA: ACM. doi: 10.1145/2493432.2493477
Ware, C., & Mikaelian, H. H. (1987). An evaluation of an eye tracker as a device for computer input2. InProceedings of the sigchi/gi conference on human factors in computing systems and graphics interface(pp. 183–188). New York, NY, USA: ACM. doi: 10.1145/29933.275627