Imported Inputs and Invoicing Currency Choice:
Theory and Evidence from UK Transaction Data
Wanyu Chungy University of Nottingham
October 15, 2015
(Forthcoming in Journal of International Economics)
Abstract
A signi…cant proportion of international trade is in intermediate goods. This paper considers theoretically and empirically how exporters’ dependence on im-ported inputs a¤ects their choice of invoicing currency. The model predicts that exporters that depend more on foreign currency-denominated inputs are less likely to price in their home currency. I test this and other theoretical results using a novel dataset that covers UK trade transactions with non-EU countries. I …nd con-siderable support for the model’s predictions. A 10 percentage point higher share of foreign currency-denominated inputs is associated with a 20 percentage point higher probability of pricing in the same foreign currency relative to the producer’s currency.
JEL Classi…cation: F1, F31, F41.
Keywords: Currency of Invoicing; Imported Inputs; UK Trade.
Disclaimer: This study contains statistical data from HM Revenue and Customs (HMRC) which is Crown Copyright. The research datasets used may not exactly reproduce HMRC aggregates. The use of HMRC statistical data in this study does not imply the endorsement of HMRC in relation to the interpretation or analysis of the information. For VAT implications of the paper that serve HMRC’s functions please refer to the author’s personal webpage.
ySchool of Economics, University of Nottingham, Nottingham NG7 2RD, UK. Email:
1
Introduction
The currency denomination of international trade has real e¤ects on the macroeconomy. When prices are sticky, the currency in which goods are priced determines how trade balances and domestic prices respond to changes in exchange rates. Whether prices are set in the exporter’s currency (producer currency pricing, PCP) or the importer’s currency (local currency pricing, LCP) has been a long-debated issue for modelling in the open economy macroeconomics literature. Early work has also documented the far-ranging policy implications of the choice of invoicing currency for the international transmission of macroeconomic shocks, the e¤ectiveness of monetary policy, and the choice of exchange rate regimes.1
However, it is only recently that …rms’invoicing currency choice has been considered endogenous in theory and linked to endogenous exchange rate pass-through (e.g., Dev-ereux et al., 2004; Engel, 2006; Gopinath et al., 2010). A fundamental question, then, is what determines the invoicing currency choice. This paper addresses the question and, in particular, theoretically and empirically examines whether exporters’dependence on imported inputs determines their invoicing currency choice.
To guide the empirical strategy, I develop a theoretical framework that features …rm heterogeneity in the degree of dependence on imported inputs together with endogenous invoicing currency choice. In a two-country setting with exchange rate uncertainty, the pro…t-maximizing exporter is assumed to optimally preset prices in a chosen invoicing currency, taking foreign input prices (denominated in the foreign currency) as given. The theoretical results formulate two testable hypotheses that relate imported inputs to …rms’choice of invoicing currency. First, exporters that depend more on imported inputs are less likely to use their home currency. This result is consistent with the intuition that exporters using foreign currency-denominated inputs have a hedging incentive to set prices in the same foreign currency to minimize exchange rate risks. However, note that …rms are assumed to be risk-neutral in the model.2 The second prediction is that …rms that do not depend on imported inputs are more likely to use their home currency, everything else being equal.
Further, I test the theory’s predictions using a novel and rich dataset of the UK’s non-EU trade statistics, recorded by Her Majesty’s Revenue and Customs (HMRC). The dataset contains 2.54 million export transactions and 7.31 million import transactions
1
Betts and Devereux (1996) are the …rst to introduce LCP, as opposed to the assumption of PCP in the Redux model (Obstfeld and Rogo¤, 1995) in the new open economy macroeconomics (NOEM) literature. Devereux and Engel (2003) allow prices to be exogenously set in both. See, among others, Corsetti and Pesenti (2005) and Devereux and Engel (2002) for the implications for monetary and exchange rate policies.
2
in 2011. A distinctive feature of the data is that for each transaction, both invoicing currency and …rm identity are recorded, along with the country of dispatch or destina-tion, product and industry codes, statistical values, and other custom variables. Thus, I can match import and export data to identify each exporter’s dependence on imported inputs together with the currency denomination of these inputs.3
I start the empirical analysis by documenting a large variation in invoicing currency choice across destinations and industries. For example, the share of exports priced in British pounds is approximately 55 percent for the manufacturing industry, whereas the share is close to 70 percent for the food industry. Additionally, exports to the US have the highest share of LCP (47 percent in dollars) among all destinations. Next, I review the stylized facts about the di¤erent patterns of invoicing currency choice between importing exporters and non-importing exporters. In particular, three quarters of non-importing exporters (26,618 …rms in total) use only the pound as an invoicing currency, whereas the fraction declines to only half for importing exporters (32,289 …rms in total). These …ndings point to …rm characteristics as the main explanation for such discrepancies in invoicing currency choice because these two groups do not di¤er systematically in industry presence, export destination, and the type of goods.
As suggested by the theory, the main empirical speci…cation relates invoicing cur-rency choice to …rms’import behavior and the curcur-rency denomination of their inputs. The results provide strong support for the theory that importing exporters are less likely to use PCP compared with non-importing exporters after controlling for …rm size, des-tination, and industry e¤ects. Speci…cally, a 10 percentage point higher share of foreign currency-denominated inputs is associated with a 20 percentage point higher probabil-ity of LCP relative to PCP. Furthermore, among importing exporters, a …rm with a share of pound-denominated inputs at the 75th percentile is approximately 40 percent less likely to use LCP relative to PCP compared with a …rm whose imported inputs are all priced in foreign currencies. The …ndings also relate currency choice to other …rm characteristics. For instance, larger exporters are less inclined to use PCP, a …nding that supports the argument that larger …rms are more likely to hedge using …nancial instruments.4
In practice, goods may be priced in a third currency other than the exporter’s and the importer’s currency. This option— namely, vehicle currency pricing (VCP)— is indeed present in the UK trade data and it accounts for 56 percent of imports and 28 percent
3
The categorization of goods is based on the Broad Economic Categories (BEC) which decomposes goods into three end-use categories: consumption (…nal), intermediate, and capital goods. I treat both intermediate and capital goods as industrial inputs. Trade in intermediate goods is also related to the following terms: vertical specialization, outsourcing, and fragmentation. See, e.g., Hummels et al. (2001) for de…nitions.
4This argument states that hedging incurs a …xed cost that large …rms are more able to a¤ord. See,
of exports (primarily in dollars). In a separate section of extensions, I …rst extend the two-country model to allow for the option of VCP and the use of VCP inputs. As in the two-country framework, the model identi…es a similar channel through which input currency denomination a¤ects invoicing currency choice. It predicts that VCP is more likely for exporters with a higher share of VCP inputs, a result strongly supported by the UK trade data.5
To complement the main analysis, I review the 2011 currency denomination of UK imports and examine whether the use of imported inputs determines currency denomi-nation at the country level. I use a systematic measure of value added to gross exports (VAX ratios)— computed by Johnson and Noguera (2012)— as a proxy for a country’s dependence on imported inputs. If a country heavily relies on imported inputs, the value added to gross exports should be lower by de…nition. Hence, VAX ratios are inversely related to the dependence on imported inputs. I …nd that countries that depend more on foreign inputs systematically use less of their home currencies for exports.6
This paper is complementary to existing theoretical studies on the determinants of invoicing currency. My theoretical framework is closely related to Engel (2006), who provides the insight that a higher share of costs incurred in the foreign currency is asso-ciated with more LCP and a lower exchange rate pass-through via an equivalence result. This result also o¤ers an alternative intuition other than …rms’ hedging incentives for explaining the deviation from PCP. When a …rm would prefer a low pass-through were it to adjust prices freely, it is more likely to use LCP. The main departure I make from this literature is to introduce a speci…c two-tier production structure that features …rm heterogeneity in the degree of dependence on imported inputs.7 In the robustness check section, I control for a number of other factors discussed in the vast literature on invoic-ing currency choice: (i) macroeconomic considerations, such as exchange rate volatility (Devereux et al., 2004) and the transaction costs of exchange (Devereux and Shi, 2013); (ii) strategic characteristics, such as bargaining between exporters and importers (Gold-berg and Tille, 2008); and (iii) goods characteristics (Bacchetta and van Wincoop, 2003, 2005).
Furthermore, this paper contributes to the empirical literature on the currency de-nomination of international trade, which is relatively scarce. The lack of empirical
evi-5
However, other theoretical predictions that relate VCP to exchange rate movements are not sup-ported by the data. These …ndings may suggest that VCP is due to …rms’other considerations such as the transaction costs of exchange (Devereux and Shi, 2013) and an industry coalescing e¤ect (Goldberg and Tille, 2008), rather than …rms’pro…t-maximizing behavior. It may also be the case that the theory introduced is lacking in some way and hence cannot reconcile all pricing strategies.
6
I also use a further disaggregated VAX ratio at the country-industry level and the results still hold. These ratios are computed by Johnson and Noguera on the basis of the GTAP database and are not published in their paper.
7Engel (2006) provides an example of the decision rule that encompasses many other models with
dence is in large part due to a lack of disaggregated datasets. For a long time, little was known beyond several stylized facts based primarily on aggregated data.8 For instance, trade in primary products is mostly denominated in US dollars, whereas trade between developing and industrialized countries is predominantly invoiced in the industrialized country’s currency. Also, the fact that in‡ationary currencies are less likely to be used is documented.9 Some studies turn to a survey approach, such as Friberg and Wilander (2008) for Swedish exporters and Ito et al. (2010) for Japanese exporters. More recent literature has also seen new evidence from disaggregated data, for instance, Goldberg and Tille (2009) with Canadian import transactions. This paper adds new …rm-level evidence to the empirical literature, with a particular focus on imported inputs as a key determinant for invoicing currency choice.
This paper also relates to the growing body of literature on endogenous exchange rate pass-through that examines the role of either imported inputs or invoicing currency choice, or the interaction of both. For example, Amiti et al. (2014) document the direct link between imported inputs and pass-through. In contrast to my focus on currency choice, they highlight the interaction between variable markups and market shares as the underlying channel contributing to the variation in pass-through across …rms. Concerning invoicing currency, Gopinath et al. (2010) show a large di¤erence in the pass-through of the average good priced in dollars versus non-dollars.10 They further consider the cost sensitivity of …rms to exchange rate shocks (which directly relates to imported inputs) for determining incomplete pass-through in a calibration exercise, as an empirical implementation of the theoretical result of Engel (2006). Consistent with these implications, my …ndings provide direct …rm-level evidence showing that exporters that depend more on imported inputs are more likely to use LCP.
The paper is structured as follows. The next section presents a simple model to demonstrate how …rms’ choice of invoicing currency is a¤ected by the presence of im-ported inputs. Section 3 describes the dataset and documents new stylized patterns of invoicing currency choice in the data. Section 4 presents the main empirical …ndings. Section 5 …rst extends the analysis to VCP and then provides country-level evidence of the e¤ect of imported inputs on invoicing currency choice. Section 6 concludes.
8
One example is Donnenfeld and Haug (2003) who consider country size and exchange rate uncer-tainty as key determinants for the invoicing currency choice of Canadian imports. Additionally, Wilander (2005) analyzes currency use for Swedish exports using country aggregates such as GDP, distance, and in‡ation rates as explanatory variables.
9
See, for example, Grassman (1973), McKinnon (1979) and Tavlas (1997) for the early studies.
1 0See, also, Floden and Wilander (2006) for the theoretical link between …rms’price adjustments and
2
Theoretical Framework
In this section, I develop a framework that relates invoicing currency choice to …rms’ dependence on imported inputs, both of which are endogenously determined. The two main ingredients of the framework are the Halpern et al. (in press) model of the …rm’s choice to import foreign inputs and the Engel (2006) model of endogenous invoicing cur-rency choice under exchange rate uncertainty.11 Detailed model derivations are shown in Appendix A.
To focus the analysis on the link between imported inputs and invoicing currency choice, I make a number of simplifying assumptions. First, I assume that exporters take the prices and the currency denomination of foreign inputs as given. In fact, some exporters could negotiate with their trading partners for a desirable currency— a practice documented by Friberg and Wilander (2008) and Goldberg and Tille (2009). If exporters are allowed to decide on the currency in which their imported inputs are denominated, how would they choose, taking the currency denomination of exports as given? An intuitive guess is that the currency used for exports is more likely to be selected for imports. However, given any price quotes for the foreign inputs (for example, a payment of USD 100 or GBP 65), cost minimization ensures that the …rm always selects the cheaper deal based on its own (known) expected value of the exchange rate, regardless of its quantity demanded and import intensity. Thus, exchange rate uncertainty plays no role in the input currency choice for price takers. From a modelling perspective, this could be easily incorporated into the model.12
Second, I assume that all imported inputs are denominated in the foreign currency. The model could be extended to allow for a fraction of the imported inputs to be denominated in the home currency. This extension reduces the degree of input price uncertainty but does not qualitatively change the model’s predictions. In the empirical analysis, I take into account each …rm’s share of imported inputs denominated in the home currency.
Lastly, the two-country framework excludes the possibility of VCP. The framework can also be extended to allow for imported inputs from a third country and the option of VCP. In this case, the …rm’s decision rule also depends on the covariance between the two exchange rates vis-à-vis the vehicle currency. This model extension and the empirical evidence of VCP are discussed in Section 5.1.
1 1
Halpern et al. (in press) focus on the relationship between …rms’ choice of import varieties and productivity.
1 2Note that under monopolistic competition exporters choose their own invoicing currency for exports.
2.1 Demand
Consider a risk-neutral …rm i that sells a di¤erentiated good to a foreign country and faces a CES demand function:
D(pi) =
pi
Phf
!
Phf
P D ; (1)
where D is the quantity demanded,pi is the …rm’s price, Phf is the price index for all
domestic goods sold in the foreign country, and P is the foreign consumer price index (all denominated in the foreign currency). D is the foreign demand shifter that is independent of prices. The parameter is the elasticity of substitution across varieties with >1. The parameter is the foreign elasticity of demand for domestic goods.
2.2 Production and Import Intensity
The …rm uses laborLiand intermediate goodsXi to produce, following a Cobb-Douglas
production function with constant returns to scale given by
Yi=AiXiL1i ; (2)
where Ai is the …rm’s productivity and 2 [0;1] measures the expenditure share on
intermediate inputs. The cost of labor is the wage rate W.
Intermediate goods comprise two varieties— domestic and foreign— that are imper-fect substitutes:
Xi = Zi1+ + (aiMi)1+
1+
; (3)
whereZi and Mi are the quantities of domestic and imported inputs, respectively. The
elasticity of substitution between domestic and foreign varieties is (1 + ) > 1.13 I assume that the price of the domestic inputZi isQ, denominated in the home currency.
The price of the foreign input Mi is SQ , S being the exchange rate (de…ned as the
domestic price of foreign currency), andQ being the price denominated in the foreign currency.
The parameterai captures the productivity of …rm iin using foreign inputs, which
in this model varies across …rms and directly determines the degree of dependence on imported inputs. A high ai represents a high productivity advantage for …rm iin using
foreign inputs, and vice versa.14
1 3
As domestic and foreign inputs are imperfect substitutes, production is possible without the use of imported inputs. Note that the model also accommodates the cases of perfect substitutes (when ! 1) and perfect complements (when !0). In the Appendix, I discuss …rms’ use of imported inputs and their decision rules in these cases.
1 4When a
The …rm pays a sunk costfi in terms of labor for importing foreign inputs.15 Given
any output level, the …rm …rst chooses the amount of inputs to minimize its total cost subject to the production technology. The total cost of the …rm is given byW Li+QZi+
SQ Mi+W fi;which can be written as the sum of a variable cost plus a …xed cost:
T Ci = iY +W fi:
The marginal cost i can be derived as
i=
C Aibi
; (4)
where C = (Q= ) [W=(1 )]1 is a cost index and bi 1 + SQ =Qai
1=
is the
productivity-enhancing e¤ect from using imported inputs. The productivity-enhancing e¤ect is increasing in the productivity parameterai.
Using this cost structure, I de…ne i as the share of costs spent on imported inputs in the total costs of intermediate goods:
i
SQ Mi
SQ Mi+QZi
:
The parameter i directly captures the …rm’s degree of dependence on foreign inputs. The home share of inputs (1 i) can be shown as
1 i =
"
1 + ai
SQ =Q
# 1
=bi : (5)
The home share of inputs depends on the productivity parameter ai: A …rm with a
higher productivity gain from using imported inputs (higherai and, accordingly, higher
bi) has a stronger dependence on imported inputs and a lower home share of inputs.
2.3 PCP versus LCP
After deciding on the amount of inputs, the …rm is then assumed to preset the prices and invoicing currency one period ahead by maximizing its expected pro…ts with a discount
productivity disadvantages. The price-adjusted productivity,ai=(SQ =Q), captures the advantage of a unit of home currency spent on the foreign variety relative to the home variety. This term also relates to the de…nition of quality by Grossman and Helpman (1993) as the advantage in services provided by a good relative to its cost.
1 5Fixed costs can explain the fact that some …rms do not import foreign inputs. The model can be
factor .16 If the …rm sets its price in the home currency (i.e., PCP), then the expected discounted pro…ts are
E P CPi (pi) =E
2
4 (pi i)
pi
SPhf
!
Phf
P D
3
5: (6)
If the …rm sets its price in the foreign currency (i.e., LCP), then the expected discounted pro…ts are
E LCPi (pi) =E
2
4 (Spi i) pi
Phf
!
Phf
P D
3
5: (7)
The pro…t-maximizing prices under PCP and LCP, respectively, are
pi =
1
E i S
E(S ) ; (8)
pi =
1
E( i )
E(S ) ; (9)
where = Phf( )P D :By substituting these optimal prices into the two expected pro…t functions and taking a second-order approximation, I obtain the …rm’s decision rule for invoicing currency choice. A domestic …rm using foreign inputs sets its price for the foreign market in PCP if
1
2var(lnS)> cov[ln (1 i);lnS]; (10)
and in LCP if vice versa. This decision rule states that all else being equal, exchange rate volatility makes the …rm prefer PCP. In contrast, the covariance between exchange rates and the home share of inputs (1 i) makes the …rm prefer LCP. The former e¤ect captures the …rm’s consideration of expected revenues, whereas the latter captures the consideration of expected costs. I discuss the two e¤ects in turn.
Exchange rate volatility on the left-hand side of (10) enters the decision rule through the …rm’s consideration of expected revenues. When the …rm chooses PCP, the price is certain, and the quantity (foreign demand) is subject to exchange rate uncertainty. In contrast, when the …rm chooses LCP, the quantity is certain, and the price is subject to exchange rate uncertainty. Hence, the …rm faces a trade-o¤ between stabilizing price and stabilizing quantity. In this case, the curvature of the revenue functions matters for the optimal currency choice. Technically, the expected revenue function under PCP
1 6Note that the expectation occurs in periodt 1when the …rm sets its price for periodt. The time
is convex in the exchange rate and linear under LCP.17 Therefore, the model predicts that an increase in the exchange rate variance increases the expected revenues under PCP relative to LCP, a …nding that is consistent with Devereux et al. (2004) and Engel (2006).
The covariance between exchange rates and the home share of inputs on the right-hand side of (10) enters the decision rule through the …rm’s consideration of expected costs. For example, if the home currency depreciates (higherS), foreign inputs become more expensive, leading to a higher marginal cost. In this case, the …rm incurs a cost from switching from imported inputs to domestic inputs (higher1 i). The covariance term is positive and captures the …rm’s responsiveness to input price uncertainty. All else being equal, a more responsive …rm has a stronger incentive to choose LCP. Additionally, this e¤ect is stronger if the domestic and foreign inputs are less substitutable (with a lower elasticity of substitution ).
To determine the link between the degree of dependence on imported inputs and in-voicing currency choice, I rewrite the right-hand side of (10) in terms of the productivity-enhancing e¤ect bi using equation (5): R:H:S = cov(lnbi;lnS):Next, I prove that
this term is positive and increasing in the degree of dependence on imported inputs i because @lnbi=@lnS = i < 0: These results suggest that a …rm with a higher i
is more responsive to exchange rate uncertainty and, hence, more likely to use LCP. Intuitively, when costs are incurred in the foreign currency, choosing LCP provides a natural hedge for the …rm. However, note that the result holds for risk-neutral …rms in the model.
Through these discussions, I summarize the theoretical results in Proposition 1 and formulate its corollary as follows.
Proposition 1 A domestic …rm that depends more on foreign currency-denominated inputs is more likely to use LCP (relative to PCP) for exports.
Corollary (to Proposition 1) A domestic …rm with a higher share of imported inputs denominated in the home currency is less likely to use LCP (relative to PCP) for exports.
Note that in the model, exchange rates only a¤ect the …rm’s total costs through using imported inputs denominated in the foreign currency. Therefore, for …rms that do not use imported inputs ( i= 0), the decision rule for PCP in equation (10) now reads
var(lnS)>0:This result implies a dominant PCP for …rms that do not use imported inputs, a pattern that I document in the descriptive statistics in Section 3. This model prediction is summarized as Proposition 2.
1 7The expected revenue functions are Ehp
i pi=SPhf Phf=P D
i
under PCP and
EhSpi pi=Phf Phf=P D
i
Proposition 2 Given any exchange rate volatility, …rms that do not use imported inputs are more likely to use PCP for exports, everything else being equal.
3
Data and Stylized Facts
In this section, I start by describing the dataset used for the empirical analysis. Next, I provide a broad assessment of the currency denomination of UK trade, followed by the stylized facts about importing exporters (i.e., …rms that use imported inputs) and non-importing exporters.
The main data source is a highly disaggregated dataset of UK trade from HMRC, which is only available to approved projects. The sample used in this paper includes all UK trade transactions outside the euro zone in 2011.18 For each trade transaction, I observe a unique trader identi…er, the country of dispatch (for imports) or destination (for exports), product code, industry code, statistical value, and the invoicing currency of the transaction. After dropping observations with no information on invoicing cur-rency, the remaining sample accounts for 95.1 percent of total imports (7.31 million observations) and 86.3 percent of total exports (2.54 million observations).
Arguably, one advantage of the UK trade data is the diversity in trading partners. In 2011, the total number of trading partners was approximately 190 for both imports and exports. The main partners are the US— which represents 16 percent of imports and 29 percent of exports— and China— which accounts for 15 percent of imports and 6 percent of exports.19 This dataset ensures that the analysis in this paper fairly represents a small open economy in international trade rather than a special case with only a few trading partners.
3.1 A Broad Assessment of the Currency Denomination of UK Trade
Interestingly, the number of currencies used in UK trade is quite high, with 76 currencies used for exports and 103 for imports. However, when considering trade value, major currencies such as the pound sterling and the US dollar still dominate as an invoicing currency. Table 1 displays these trade shares and the shares in terms of pricing strategies (PCP, LCP, and VCP). I …rst observe an asymmetry in the currency denomination of exports and imports: the dominant currency for imports is the US dollar (64.7 percent),
1 8The full HMRC dataset covers complete UK trade transactions between 1996 and 2013. Declaring
the invoicing currency became a requirement after 2010 for non-EU imports and after 2011 for exports (for transaction value greater than £100;000). In 2011, non-EU imports accounted for 49.5 percent of the total UK imports and non-EU exports accounted for 46.5 percent of the total UK exports.
1 9These 190 trading partners include countries and autonomous areas, such as Hong Kong. Other
Table 1: Currency of Invoicing in UK Trade with non-EU Countries
Imports Exports
Shares of Currency Choice (percent)
Pound Sterling (£) 24.5 57.4
US dollar ($) 64.7 37.1
Euro (€) 5.3 2.8
Others 5.5 2.7
Sum 100.0 100.0
Shares of Pricing Strategy (percent)
Producer Currency Pricing (PCP) 18.8 57.4(£)
Local Currency Pricing (LCP) 24.5(£) 14.0
Vehicle Currency Pricing (VCP) 56.7 28.6
Sum 100.0 100.0
whereas exports are primarily priced in pounds (57.4 percent).20 The euro accounts for a small share because the data do not include trade with EU countries. I also report that VCP is the main strategy for imports, whereas the dominant one for exports is PCP. As previously discussed, the US represents only a small share of UK trade; hence, the US dollar is clearly used extensively as a vehicle currency.
As reported in Table 2, the data further reveal that the asymmetry in the currency denomination of exports and imports holds for all industries, trading partners, and the categories of goods.21 For both exports and imports, I also observe a signi…cant variation in invoicing currency across industries, trading partners, and the categories of goods. For example, in Panel A of Table 2, it can be seen that the share of exports priced in pounds is approximately 55 percent for the manufacturing industry (SITC 6), whereas the share is nearly 70 percent for the food industry (SITC 0). Panel B of Table 2 displays a comparison between trading partners, and shows that almost all imports from the US are priced in dollars (82.6 percent). Additionally, imports from East and Southeast Asia have the highest trade share priced in pounds (42.3 percent) compared with other destinations. Regarding exports, half of the exports to the US are priced in dollars (47.2 percent), whereas exports to other destinations are primarily priced in pounds.
Next, I categorize goods into …nal, intermediate, and capital goods according to the Broad Economic Categories (BEC) classi…cation.22 As shown in Panel C of Table 2, LCP
2 0This pattern is at odds with the Swedish evidence reported in Friberg and Wilander (2008) that
exporters primarily use their customers’currencies.
2 1The classi…cations used are the Standard International Trade Classi…cation (SITC) and the Broad
Economic Categories (BEC).
Table 2: Currency of Invoicing by Industry, Destination, and Category of Goods
Imports Exports
PCP LCP(£) VCP PCP(£) LCP VCP
Panel A: By 1-digit SITC Industry (percent)
0:Food & live animals 10.5 37.7 51.8 68.0 10.4 21.5 1:Beverages & tobacco 19.0 68.0 12.9 48.4 33.6 18.1 2:Crude materials 30.5 30.9 38.5 65.5 2.4 32.0 3:Mineral fuels 2.7 9.7 87.6 65.0 19.3 15.7 4:Animal & veg. oils 10.6 3.6 85.8 77.9 6.6 15.5 5:Chemicals 32.0 33.8 34.2 54.7 28.8 16.5 6:Manufactured goods 10.2 20.5 69.3 54.8 8.6 36.6 7:Machinery 24.8 29.6 45.6 58.6 14.1 27.4 8:Miscellaneous 14.8 36.5 48.7 65.5 15.5 19.0 9:Unclassified 37.3 0.7 62.0 50.7 0.5 48.8
Panel B: By Trading Partners (percent)
US 82.6 15.6 1.8 50.2 47.2 2.7
China 0.3 26.0 73.8 62.4 0.1 37.5
East/Southeast Asia 6.4 42.3 51.2 57.3 5.9 36.8 Europe exc. EU 4.6 21.8 73.6 75.5 2.8 21.6 Other Americas 10.9 24.9 64.2 53.4 7.8 38.8
All Others 3.7 21.9 74.4 63.5 1.9 34.6
Panel C: By The BEC Category (percent)
Final Goods 10.7 41.2 48.1 56.3 27.2 16.5 Intermediate Goods 18.6 20.1 61.3 56.6 15.8 27.6 Capital Goods 21.4 25.2 53.4 59.3 13.2 27.5
Notes: The classifications used are the Standard International Trade Classification (SITC) and the Broad Economic Categories (BEC).
is used more extensively for …nal goods relative to intermediate and capital goods (in value), particularly for imports. This …nding is consistent with the theoretical argument in Bacchetta and van Wincoop (2003) that …nal goods producers are more prone to use LCP given local competition compared with intermediate goods exporters.23
3.2 Stylized Facts About Importing and Non-importing Exporters
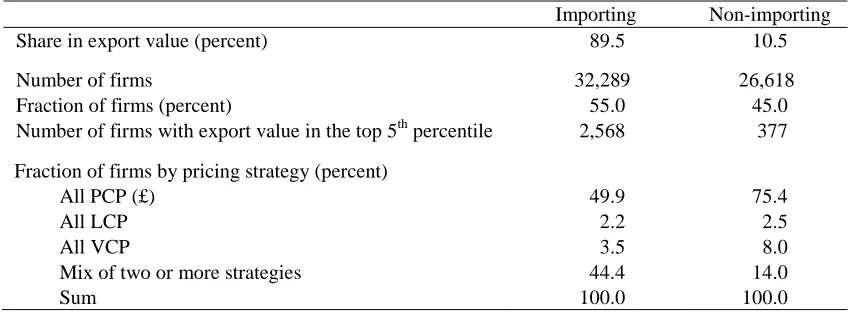
In the following discussion, I categorize UK exporters into two groups according to their import behavior: importing exporters use imported inputs and non-importing exporters do not.24 Out of all 58,907 …rms in the exports dataset, 32,289 …rms (55 percent) are importing exporters and 26,618 (45 percent) are non-importing exporters. As reported in Table 3, importing exporters account for a much larger share of export value (89.5
percent, respectively. The …gures are 18, 57, and 16 percent for exports. Some goods are not classi…ed by the BEC and account for only 3.7 percent of imports and 9 percent of exports.
2 3
In their model, all exports are intermediate goods sold to domestic …nal goods producers.
2 4
Table 3: Importing versus Non-importing Exporters
Importing Non-importing
Share in export value (percent) 89.5 10.5
Number of firms 32,289 26,618
Fraction of firms (percent) 55.0 45.0
Number of firms with export value in the top 5th percentile 2,568 377
Fraction of firms by pricing strategy (percent)
All PCP (£) 49.9 75.4
All LCP 2.2 2.5
All VCP 3.5 8.0
Mix of two or more strategies 44.4 14.0
Sum 100.0 100.0
percent) compared with non-importing exporters (10.5 percent). Although importing exporters are on average larger exporters, note that very large exporters are also found in the non-importing group. Within this group, the number of exporters with export shares in the upper5thpercentile is 377 (1.4 percent of non-importing exporters), whereas the importing group has 2,568 very large exporters (8 percent of importing exporters).
A salient and new stylized fact in the UK data is that importing exporters and non-importing exporters exhibit very di¤erent patterns of invoicing currency choice. Table 3 indicates that a large share of non-importing exporters (75.4 percent) only use PCP, whereas this …gure is only 49.9 percent for importing exporters, a pattern consistent with the theoretical prediction that non-importing …rms are more likely to use PCP (see Proposition 2). Additionally, a larger share of non-importing exporters (8 percent) uses only VCP, as opposed to 3.5 percent for importing exporters. More interestingly, only 14 percent of non-importing exporters use a combination of two or three strategies, as opposed to 44 percent for importing exporters.25
A natural question is whether the di¤erence in invoicing currency choice between the two groups is primarily driven by …rm characteristics, such as import behavior— as suggested by the theory— or by other fundamental di¤erences at more aggregated levels. Table 4 presents these two groups’export shares (in value) by industry presence, destina-tion, and the category of goods. That no substantial heterogeneity in export sectors and destinations between importing and non-importing exporters exists is somehow surpris-ing and highlights that the variation in invoicsurpris-ing currency choice is more likely to come from …rm characteristics. Furthermore, a comparison between the shares of di¤erent goods shows that importing exporters have a higher share of intermediate goods, which suggests the evidence of their engagement in vertical specialization in global production
2 5Within the mixed group, the average value shares of PCP, LCP, and VCP are 60, 16, and 24 percent
Table 4: Importing versus Non-importing Exporters by Industry, Destination, and Cat-egory of Goods
Importing Non-importing
Shares of exports by 1-digit SITC Industry (percent)
0:Food & live animals 1.2 5.7
1:Beverages & tobacco 2.8 1.9
2:Crude materials 2.9 6.2
3:Mineral fuels 7.4 1.8
4:Animal & veg. oils 0.1 0.04
5:Chemicals 17.6 21.5
6:Manufactured goods 12.2 8.6
7:Machinery 41.6 40.4
8:Miscellaneous 12.1 13.1
9:Unclassified 2.1 0.8
Sum 100.0 100.0
Shares of Exports by Destination (percent)
US 28.6 31.1
China 6.3 7.2
East/Southeast Asia 22.5 27.8
Europe exc. EU 16.4 14.1
Other Americas 9.0 5.1
All Others 17.2 14.7
Sum 100.0 100.0
Shares of Exports by the BEC Category (percent)
Final Goods 17.6 25.0
Intermediate Goods 58.6 41.7
Capital Goods 16.0 13.2
N/A 7.8 20.2
Sum 100.0 100.0
chains.
To summarize, I provide the descriptive statistics of the currency denomination of UK trade and document substantial variations in invoicing currency choice between importing and non-importing exporters. Next, guided by the theory, I formally examine the role of imported inputs in determining exporters’invoicing currency choice.
4
Empirical Evidence
4.1 Empirical Speci…cation and Construction of Variables
I take the entire sample of UK exports to non-EU countries (2.54 million transactions) and reduce it to the …rm-product-destination level (0.65 million observations). The dimension that is eliminated is the frequency of shipping for each exporter (at the product-destination level) within a year.26
The categorical dependent variables take into account all pricing strategies, includ-ing PCP (the default option), LCP, and VCP. The regressions are estimated usinclud-ing a multinomial logit (MNL) procedure that imposes the constraint that the three invoicing alternatives are mutually exclusive and exhaustive (for each …rm-product-destination observation). Thus, the MNL estimations yield two sets of results: LCP versus PCP and VCP versus PCP. Statistical signi…cance in these estimations shows the direction in which the explanatory variables shift the likelihood of LCP (VCP) away from the default option of PCP. The main estimating speci…cation is
i;j;c(P CP) =MNL InputP CPi;c; InputLCPi; Importi; ratioi;k;
c; k ;
where the superscripts i; j; c and k denote …rm, product, destination (country), and industry, respectively.
The …rst explanatory variableInputP CPi;c measures the share of …rmi0simported inputs from country c priced in country c’s currency (i.e., PCP from the perspective of the exporter). This variable can be interpreted as …rm i’s ‘e¤ective’dependence on imported inputs from country c. A higher ratio ofInputP CPi;c is expected to increase the likelihood of LCP relative to PCP, as predicted by Proposition 1.27
Furthermore, I consider a …rm-level measure InputLCPi that captures the total share of …rm i’s pound-denominated imported inputs. This variable is a systematic measure of the overall degree of input price uncertainty facing exporters. For exam-ple, suppose an exporter uses inputs from both the US (denominated in dollars) and Japan (denominated in yen) and then produces a …nal good that it sells to the US. The variable InputP CPi;c only captures the dollar-denominated inputs, whereas the variableInputLCPi takes into account all other input sources. A higherInputLCPi is
expected to decrease the likelihood of LCP relative to PCP, as predicted by the corollary of Proposition 1.
2 6On average, …rms ship four times a year. The reason for collapsing the data is to avoid assigning
more weights to …rms that ship more regularly.
2 7Note that Proposition 1 is built on equation (10) where captures imported inputs as a share of
total costs. Total costs may be measured as total wage bill plus total material cost, as used in Amiti et al. (2014). When data on costs are not available, sales may serve as a good proxy. However, the UK dataset used in this paper is limited in the available …rm characteristics and hence the variable InputP CPi;c
To distinguish between importing and non-importing exporters, I use a dummy
vari-able Importi, which takes the value of one if a …rm uses imported inputs and zero
otherwise. The use of imported inputs is expected to increase the likelihood of LCP relative to PCP, as predicted by Proposition 2.
Guided by the stylized fact documented in Section 3 that importing …rms account for a large export share, I further control for relative …rm size proxied byratioi;k, the export share of …rmiin an HS-4-digit industry.28 I start the estimations with destination …xed e¤ects c (at the area level) and industry …xed e¤ects k(at the SITC-1-digit level) and
later replace them with destination-industry e¤ects c;k.29
4.2 Main Empirical Findings
To focus on testing the theoretical predictions, I only report the estimation results for the pair of LCP versus PCP in Table 5, but note that the choice of VCP is also taken into account in the MNL regressions.30 In columns 1 to 4 of Table 5, the estimates from the MNL regressions are odd ratios rather than marginal e¤ects; therefore, I …rst interpret the estimated coe¢ cients in terms of the direction of predictions. The magnitudes of these e¤ects are then discussed, with column 5 and column 6 showing the consistent pairwise estimates.
Column 1 reports an unexplained prominence in PCP relative to LCP for UK ex-ports, as the negative coe¢ cient implies. In column 2, I include the main variables related to …rms’ use of imported inputs. The positive and signi…cant coe¢ cient of
InputP CPi;c implies that a higher share of imported inputs denominated in the trading
partner’s currency makes it more likely that …rms use the same currency for exports (i.e., LCP is more likely), which supports Proposition 1. The estimated coe¢ cient of
InputLCPiis signi…cantly negative, which suggests that …rms with a higher share of
in-puts denominated in pounds are more likely to shift from LCP to PCP (see the corollary of Proposition 1). Lastly, the e¤ect of the dummy variable Importi is also signi…cant. As documented in the descriptive statistics section (see Table 3), …rms using imported inputs are less likely to use PCP, which supports Proposition 2. Overall, these results strongly support the model’s predictions.
In column 3, I add an extra control for …rm size in terms of export share. The positive and signi…cant coe¢ cient of ratioi;k suggests that larger exporters are more likely to price in their trading partners’ currencies. One possible explanation is that
2 8
HS code stands for the Harmonized Commodity Description and Coding System. Other proxies such as export shares at the SITC-1-digit level and total export shares yield the same predictions.
2 9Destinations at the area level include the US, China, East/Southeast Asia, Europe (excluding the
EU), other American countries and all other countries. Using more disaggregated levels of industry e¤ects (at the SITC-5-digit) or destination e¤ects (at the country level) does not change the results.
3 0
Table 5: Imported Inputs and Invoicing Currency Choice for UK Exporters
Dependent Variable:
LCP vs. PCP (1) (2) (3) (4)
(5)
Binomial logit
(6)
Binomial logit (ME)
InputPCPi,c 0.25*** 0.27*** 0.88*** 0.29*** 0.02*** (0.03) (0.03) (0.00) (0.03) (0.03) InputLCPi -0.40*** -0.42*** -0.35*** -0.42*** -0.03***
(0.04) (0.05) (0.00) (0.07) (0.07) Importi 0.78*** 0.75*** 0.59*** 0.74*** 0.05***
(0.04) (0.04) (0.00) (0.04) (0.04) ratioi.k 1.33*** 1.34*** 0.09***
(0.14) (0.13) (0.13) Constant -0.93*** -1.60*** -1.64*** -1.46*** -1.72*** 0.09***
(0.15) (0.17) (0.19) (0.00) (0.17) (0.17) Fixed effects:
δc + δk Yes Yes Yes No Yes Yes
δc,k No No No Yes No No
Observations 644,704 644,704 644,704 644,704 507,723 507,723
AIC - 832,915 830,029 969,895 - -
Pseudo-R2 - 0.16 0.16 0.02 0.31 0.31
Notes: Observations are at the firm-product-destination level. Columns 1 to 4 present the results in terms of odds ratios from the main multinomial logit specification. The default option is PCP and only estimates of LCP versus PCP are reported. Column 5 shows pairwise estimates from a binomial logit regression. Column 6 reports the average of the individual marginal effects from the pairwise regression. Fixed effects: δc are destinations at the area level include the US, China, East/Southeast Asia, Europe (excluding the EU), other American countries, and all other countries; δk are industries defined at the SITC-1-digit level; δc,k are industry-destination effects at the SITC-2-digit-area level. Standard errors are clustered at the HS4 level (1,191 clusters) and are reported in parentheses. Alternative clustering at the SITC-5-digit level, at the firm level and at the country level yield the same conclusions.
*** Significant at the 1 percent level; ** Significant at the 5 percent level; * Significant at the 10 percent level.
larger …rms highly involved in international trade have more incentives and resources to hedge against exchange rate uncertainty using …nancial instruments; hence, they are more likely to deviate from PCP.31 The coe¢ cients of the key variables are almost identical to those in column 2.
Next, in column 4, I report the results of the same speci…cation as in column 2 but replace the industry- and destination-speci…c e¤ects with industry-destination …xed e¤ects (de…ned at the SITC-2-digit-area level) to explore di¤erent levels of variation. Comparing column 4 with column 2, I show that the coe¢ cient of InputP CPi;c more than triples and remains strongly signi…cant. All the other estimates do not change much in size and also remain strongly signi…cant. However, a much lower pseudo R-square in this speci…cation indicates that it does not …t the data as well as the main speci…cation.
3 1Another proxy for …rms’engagement in international trade is the number of exporting destinations.
Column 5 reports the pairwise logit estimates for the pair of LCP versus PCP, dropping the observations of VCP. If the implicit assumption of the independence of irrelevant alternatives (IIA) in the MNL procedure holds, estimating a pairwise logit model should yield the same results as estimating a multinomial logit model.32 A comparison of column 5 with column 3 indicates that the coe¢ cients are almost identical, suggesting consistent MNL estimates in the main speci…cation.
Column 6 quanti…es the main results by reporting the average marginal e¤ects of the key variables (as in column 5). Speci…cally, a 10 percentage point higherInputP CPi;c
is associated with a 20 percentage point higher probability of LCP. Furthermore, a …rm with the share of pound-denominated inputs at the75thpercentile (or the upper quartile where InputLCPi = 13:17 percent) is approximately 40 percent (= 0:03 13:17) less likely to use LCP relative to PCP, compared with a …rm whose imported inputs are all priced in foreign currencies (InputLCPi = 0). Finally, the predicted probability of LCP relative to PCP for importing exporters is 5 percent higher than non-importing exporters.33
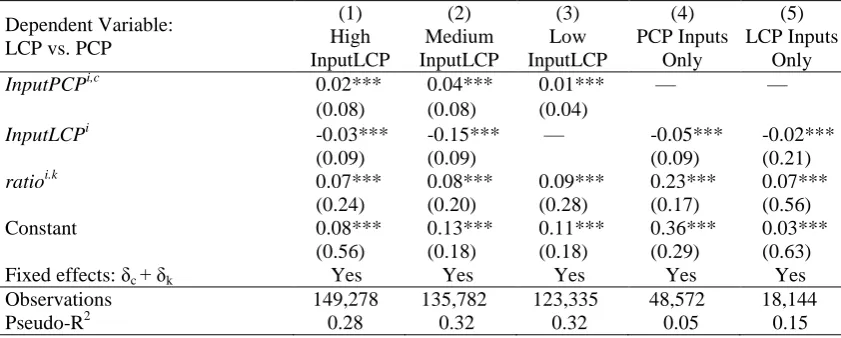
Overall, the main empirical …ndings in Table 5 provide strong support for the theo-retical predictions developed in Section 2. However, I want to ensure that these results are not driven by outliers or speci…c to …rms facing a particular range of input price uncertainty. I re-estimate the (pairwise) binomial logit speci…cation in columns 5 and 6 of Table 5 for importing exporters by splitting the ratio InputLCPi into quartiles. Speci…cally, importing exporters are further divided into three groups: high InputLCP (with the ratio in the upper quartile), medium InputLCP (below the upper quartile and above the median) and low InputLCP (at the median).34 With this split, the high group accounts for 31.4 percent of the export share of all importing …rms, the medium group accounts for 50.5 percent, and the low group accounts for only 18.1 percent. I report the average marginal e¤ects in columns 1 to 3 of Table 6. These estimated coe¢ cients con…rm that the main …ndings remain valid for all three groups.
Finally, I close this section with an extra exercise to link the empirical analysis to the theoretical assumption in Section 2 that all imported inputs are denominated in the foreign currency (i.e., PCP from the perspective of exporters). To see whether the results from the main speci…cation respond well to this assumption, in column 4 of Table 6 I consider only observations with exporters whose imported inputs are all priced in PCP.35 For instance, exports to Japan from …rm i are included if …rm i0s imported
3 2
This is a test …rst proposed by Hausman and McFadden (1984).
3 3Note that these results apply to the pairwise comparison of PCP versus LCP. For more quantitative
interpretations with di¤erent speci…cations see Section 4.3.3.
3 4Note that the lower two quartiles are grouped together because the median level is at zero. Hence,
for the low group the variableInputLCPi is dropped.
3 5This sample contains exports from 10,914 …rms that account for approximately 9.1 percent of the
Table 6: Invoicing Currency Choice by Input Currency Denomination
Dependent Variable: LCP vs. PCP
(1) High InputLCP
(2) Medium InputLCP
(3) Low InputLCP
(4) PCP Inputs
Only
(5) LCP Inputs
Only InputPCPi,c 0.02*** 0.04*** 0.01*** — —
(0.08) (0.08) (0.04)
InputLCPi -0.03*** -0.15*** — -0.05*** -0.02*** (0.09) (0.09) (0.09) (0.21) ratioi.k 0.07*** 0.08*** 0.09*** 0.23*** 0.07***
(0.24) (0.20) (0.28) (0.17) (0.56) Constant 0.08*** 0.13*** 0.11*** 0.36*** 0.03***
(0.56) (0.18) (0.18) (0.29) (0.63) Fixed effects: δc + δk Yes Yes Yes Yes Yes
Observations 149,278 135,782 123,335 48,572 18,144
Pseudo-R2 0.28 0.32 0.32 0.05 0.15
Notes: In columns 1 to 3, firms are sorted by the ratio InputLCPi into above the 75th percentile (or the upper quartile of 13.17 percent), between the upper quartile and above the median level at zero, and at the median level. Column 4 uses a subsample with exporters whose imported inputs (from the trading partner to whom they export) are all priced in PCP. Column 5 considers exporters whose imported inputs (from the trading partner to whom they export) are all priced in LCP. Other details of clustered standard errors and fixed effects are as in Table 5.
inputs from Japan are all priced in Japanese yen. The variableInputP CPi;c is dropped because it no longer captures input currency denomination but the trade share of a trading partner c. The coe¢ cient of InputLCPi reported in column 4 shows that the probability of LCP signi…cantly decreases with the share of pound-denominated inputs, thus again consistent with the theoretical prediction (see the corollary of Proposition 1). Similarly, in column 5, I consider only observations with exporters whose imported inputs are all priced in LCP, and the e¤ect of input currency denomination remains strongly signi…cant.36
To summarize, I …nd that the e¤ects of input currency denomination on invoicing currency choice are signi…cant across …rms facing di¤erent degrees of (bilateral) input price uncertainty. Even for exporters that use all PCP inputs or all LCP inputs (at the …rm-country level), the overall currency exposure in the portfolios matters for their invoicing currency choice.
4.3 Robustness
I consider three sets of robustness tests: including other theoretical determinants as additional controls, considering an alternative proxy for …rm size, and using alternative speci…cations and samples.
3 6
4.3.1 Additional Controls
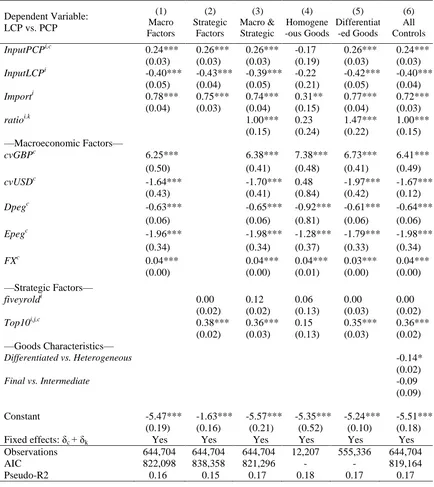
In Table 7, I check whether the main results are robust to adding a number of other theo-retical determinants for invoicing currency choice. These include a set of macroeconomic factors, a set of strategic factors, and several controls for goods characteristics.
The results reported in column 1 of Table 7 show that the estimated coe¢ cients of the main variables are virtually the same as in Table 5 after the inclusion of several
macroeconomic factors. First, exchange rate volatility is proxied by the coe¢ cients
of variation of the importer’s currency value relative to the pound and the US dollar during 2006-2009.37 As the value of the pound was highly volatile during this period, it is expected that the coe¢ cients of variation of exchange rates against the dollar better capture the volatility of a currency’s value. The negative coe¢ cient of cvU SDc
indicates that exporters are more likely to use PCP when selling to a country with a more volatile currency value against the dollar, a …nding consistent with the theory of Devereux et al. (2004) and Engel (2006). Further, I add two dummy variables to capture exchange rate pegs with respect to the dollar and the euro, denoted byDpegcandEpegc;
respectively.38 Exporters are more likely to use PCP relative to LCP when exporting to countries with exchange rate pegs. The last factor included is the transaction costs of exchange, proxied by the variableF Xc, which captures the share of a country’s currency in the daily global foreign exchange market turnover.39 A higher turnover implies lower transaction costs. The …ndings reveal that a higher share of market turnover increases the probability of LCP. This result implies that a currency that is traded extensively with lower transaction costs is more likely to be used as an invoicing currency, thus consistent with the theory of Devereux and Shi (2013).40
Column 2 veri…es that the coe¢ cients of the main variables are hardly a¤ected after controlling for …rms’strategic considerations, speci…cally, …rms’ bargaining power as emphasized by Goldberg and Tille (2008). I consider …rm experience using the variable
f iveyroldi to capture whether an exporter has more than …ve years of experience in
exporting. Although the coe¢ cient for the pair of VCP versus PCP (not reported) is signi…cant, no signi…cance exists for the pair of LCP versus PCP. On the importer’s side, Goldberg and Tille (2009) suggest transaction size as a proxy for the importer’s bargaining power, because importer characteristics are not normally observed in trade statistics. I use a dummy variable T op10i;j;c to capture whether a transaction is in the
3 7
The variables are computed with the IMF’s monthly exchange rates data from the International Financial Statistics seriesrf.
3 8
The de…nitions follow the IMF’s classi…cation in 2007. The various types of pegs include: (a) no separate legal tender; (b) pre announced peg or currency board arrangement; (c) pre announced horizontal band narrower than or equal to 2 percent; and (d) de facto peg.
3 9The data are reported in the BIS Triennial Central Bank Survey, including 35 major currencies in
2007. Currencies not listed in the survey are assigned a zero share.
4 0
Table 7: Robustness with Additional Controls
Dependent Variable: LCP vs. PCP
(1) Macro Factors (2) Strategic Factors (3) Macro & Strategic (4) Homogene -ous Goods (5) Differentiat -ed Goods (6) All Controls
InputPCPi,c 0.24*** 0.26*** 0.26*** -0.17 0.26*** 0.24*** (0.03) (0.03) (0.03) (0.19) (0.03) (0.03) InputLCPi -0.40*** -0.43*** -0.39*** -0.22 -0.42*** -0.40***
(0.05) (0.04) (0.05) (0.21) (0.05) (0.04) Importi 0.78*** 0.75*** 0.74*** 0.31** 0.77*** 0.72***
(0.04) (0.03) (0.04) (0.15) (0.04) (0.03) ratioi.k 1.00*** 0.23 1.47*** 1.00***
(0.15) (0.24) (0.22) (0.15) —Macroeconomic Factors—
cvGBPc 6.25*** 6.38*** 7.38*** 6.73*** 6.41*** (0.50) (0.41) (0.48) (0.41) (0.49) cvUSDc -1.64*** -1.70*** 0.48 -1.97*** -1.67***
(0.43) (0.41) (0.84) (0.42) (0.12) Dpegc -0.63*** -0.65*** -0.92*** -0.61*** -0.64***
(0.06) (0.06) (0.81) (0.06) (0.06) Epegc -1.96*** -1.98*** -1.28*** -1.79*** -1.98***
(0.34) (0.34) (0.37) (0.33) (0.34)
FXc 0.04*** 0.04*** 0.04*** 0.03*** 0.04***
(0.00) (0.00) (0.01) (0.00) (0.00) —Strategic Factors—
fiveyroldi 0.00 0.12 0.06 0.00 0.00 (0.02) (0.02) (0.13) (0.03) (0.02) Top10i,j,c 0.38*** 0.36*** 0.15 0.35*** 0.36***
(0.02) (0.03) (0.13) (0.03) (0.02) —Goods Characteristics—
Differentiated vs. Heterogeneous -0.14*
(0.02)
Final vs. Intermediate -0.09
(0.09)
Constant -5.47*** -1.63*** -5.57*** -5.35*** -5.24*** -5.51*** (0.19) (0.16) (0.21) (0.52) (0.10) (0.18) Fixed effects: δc + δk Yes Yes Yes Yes Yes Yes
Observations 644,704 644,704 644,704 12,207 555,336 644,704
AIC 822,098 838,358 821,296 - - 819,164
Pseudo-R2 0.16 0.15 0.17 0.18 0.17 0.17
Notes: Columns 1 to 3 add additional controls. Columns 4 and 5 use subsamples of different types of goods, as defined in the Rauch (1999) product classification. Column 6 includes all controls. Other details of clustered standard errors and fixed effects are as in Table 5.
top 10th percentile in value within an HS-4-digit industry. The …ndings support the theory of Goldberg and Tille (2008) that larger transactions are more likely to be priced in the importer’s currency.
controlled for in the main analysis. Column 3 augments the speci…cations in columns 1 and 2 together with the …rm size variable ratioi;k:Overall, all these additional controls have essentially no e¤ect on the estimated coe¢ cients of the main variables.
In columns 4 and 5, I examine the role ofgoods characteristics, particularly the sub-stitutability of goods.41 I run separate regressions for both homogeneous goods (reported in column 4) and heterogeneous goods (reported in column 5). With this split, I observe that the e¤ects of input currency denomination (the coe¢ cients of InputP CPi;c and
InputLCPi) stop having any predictive power and disappear completely for
homoge-neous goods. This …nding is somehow intuitive. As these goods are highly substitutable, …rms may simply follow what their competitors do or what their trading partners re-quest. The coe¢ cient of …rms’import status is halved but remains strongly signi…cant. The results reported in column 5 con…rm that the main empirical …ndings primarily apply to heterogeneous goods.
In column 6, all additional controls previously discussed are included, and I further add a Rauch variable (Di¤erentiated vs. Heterogeneous goods) and a variable that captures the categories of goods (Final vs. Intermediate goods) to examine the e¤ects across di¤erent types of goods. I …rst verify that the e¤ects of the imported inputs variables remain unchanged. The results also suggest that di¤erentiated goods are more likely to be priced in PCP compared with homogeneous goods. This …nding is consistent with the theory of Bacchetta and van Wincoop (2005) that LCP is more likely for homogeneous goods because exporters have a stronger incentive to stabilize prices in the currency of their customers when demand is highly elastic. Furthermore, no evidence exists that …nal goods are more likely to be priced in LCP compared with intermediate goods, as predicted by the model in Bacchetta and van Wincoop (2003). However, note that this result is at odds with the evidence shown in Section 3. A possible explanation for not …nding the same result is that …nal goods transactions are, on average, larger in value than intermediate goods transactions. Another possible explanation is that …nal goods are shipped more frequently, a dimension that is eliminated when data are collapsed.
4.3.2 Alternative Proxy for Firm Size
As highlighted in the data section, importing exporters are also large exporters, and they exhibit very di¤erent patterns of invoicing currency choice compared with non-importing exporters. The main empirical speci…cation considers …rm size in terms of trade share and the results con…rm that larger …rms are less likely to use PCP.
To ensure that the main results do hold after controlling for the …rm size e¤ect, in
4 1
this exercise I use the number of export destinations as an alternative proxy for …rm size. I sort all exporters by the number of export destinations into quartiles and re-estimate the main speci…cation for each of the four bins. With this split, exporters in Bin 1 export to more than four destinations (above the upper quartile); the number of destinations in Bin 2 is either three or four (between the upper quartile and the median); …rms in Bin 3 export to two destinations (between the median and the lower quartile), and …rms in Bin 4 only export to one destination (at the lower quartile).42 The regression results are reported in Table A3 in the online Appendix.
In all cases, the main results are essentially unchanged, except that the e¤ect of over-all currency exposure (InputLCPi) slightly loses its signi…cance in Bin 3 and disappears in Bin 4. However, note that the overall currency exposure coincides with the bilateral input denomination for exporters in Bin 4 because they have only one trading partner. A comparison across columns also shows that the within-group e¤ect of bilateral input denomination (InputP CPi;c) on exporters’ invoicing currency choice is stronger when the number of destination is lower. These …ndings further suggest that the e¤ect of import status remains relatively symmetric across bins except for the last one, which has a third of the magnitude (with the odds ratio of 0.2 as opposed to 0.6).
To summarize, I verify that the main results are not speci…c to exporters’activeness in the export markets. However, for very large …rms exporting to multiple markets, the (within-group) e¤ect of the overall currency exposure is stronger. In contrast, exporters with only a few trading partners largely consider the bilateral exchange rate uncertainty against their trading partners’currencies.
4.3.3 Alternative Samples and Speci…cations
I further check the robustness of the main results within alternative subsamples of the dataset. Overall, these results— reported in Table A4 in the online Appendix— reveal the same qualitative patterns as the main …ndings in Table 5.
As discussed in the data section, the US is a special case in which LCP (the US dollar) is used extensively compared with other destinations. To address this concern, in column 1 of Table A4, I exclude exports to the US from the sample. A comparison with the main results indicates that, for this subsample, the e¤ect of InputP CPi;c is signi…cantly stronger, whereas the e¤ect of InputLCPi is reduced by almost one-half.
In other words, the bilateral input currency denomination matters for …rms’ currency choice, particularly when trading with countries other than the US.
Next, I show in column 2 that dropping non-importing exporters has little e¤ect on the estimated coe¢ cients in the main speci…cation. Similarly, in column 3, I evaluate the
4 2
e¤ects for …rms that use only imported inputs denominated in their trading partner’s currency. Given that all observations with InputP CPi;c = 0 are dropped, I expect the estimated coe¢ cient to decline in size and this is indeed con…rmed by the results. Column 4 considers only the manufacturing sector (SITC 6-8), and the e¤ects of the main variables remain strongly signi…cant.43 Lastly, another concern is that the main results are driven by …rms with very large trade shares. In column 5, I exclude …rms with export shares in the top 5th percentile. Excluding large …rms from the sample
slightly reduces the magnitude of the coe¢ cient of InputP CPi;c, consistent with the …ndings in the previous subsection with the number of export destinations as a proxy for …rm size. However, the predictions remain robust and strongly signi…cant.
Another set of robustness checks is to consider alternative speci…cations and regres-sion models. In the main analysis, the regresregres-sion model is an MNL procedure that includes VCP as a dependent variable. However, certain policy interests may focus only on the prevalence of invoicing in the home currency. To this end, I further consider alter-native regression models and speci…cations using a dichotomous dependent variable that captures whether a transaction is priced in pounds (nP CP = 0) or not (nP CP = 1). These results are reported in Table A5 in the online Appendix.
The estimated (average) marginal e¤ects from a binomial logit regression are re-ported in column 1 of Table A5. Column 2 reports the results from the same speci…-cation, but with a linear probability model instead. Overall, the qualitative predictions are consistent with the results from the MNL speci…cation. However, note that the interpretations of these results are quite di¤erent from the main analysis because of the dichotomous dependent variable. The …ndings reported in columns 1 and 2 suggest that importing exporters are approximately 8 to 14 percent more likely to use a foreign currency (either LCP or VCP relative to PCP), compared with their non-importing counterparts. Moreover, a one percent increase in a …rm’s e¤ective dependence on for-eign currency-denominated inputs (InputP CPi;c) increases the probability of switching
to a foreign currency from PCP by 9 to 12 percent. Finally, with a one percent increase in a …rm’s total share of inputs priced in pounds (InputLCPi), the predicted probability of PCP relative to a foreign currency increases by approximately 18 percent.
Finally, column 3 uses a linear probability model with the full export dataset (2.54 million observations). The full dataset has many identical transactions at the …rm-product-destination level in di¤erent times of the year, which represent the dimension of shipment frequency. Using the full dataset, I show that except for a downsized and less signi…cant e¤ect of InputP CPi;c;all the main predictions remain unchanged.
4 3In 2011, the UK manufactured goods accounted for approximately 56 percent of the total (non-EU)
5
Extensions
In this section, I provide two extensions to the main analysis. The …rst extension theoretically and empirically considers the case of VCP. The second extension examines the currency denomination of UK imports and provides country-level evidence of the e¤ect of imported inputs on invoicing currency choice.
5.1 Imported Inputs and Vehicle Currency Pricing
5.1.1 Theory: Decision Rule for VCP
I …rst extend the model presented in Section 2 to allow for the use of VCP inputs and the choice of VCP for exports. I consider a three-country environment in which countryV’s currency is used as a vehicle currency. Firmiin countryH (Home) sells a di¤erentiated good to country F (Foreign). The CES demand curve and production functions are as in Section 2. The only di¤erence is that …rmi0simported inputs are all denominated in VCP. Thus, the parameter i captures the …rm’s dependence on VCP inputs.
The …rm presets the prices and the invoicing currency one period in advance to maximize the expected discounted pro…ts under PCP, LCP, and VCP:
E P CPi =E
2
4 pP CPi i p
P CP i
ShvPhf
!
Phf
P D
3
5; (11)
E LCPi =E
2
4 ShfpLCPi i
pLCPi Sf vPhf
!
Phf
P D
3
5; (12)
E V CPi =E
2
4 ShvpV CPi i
pV CPi
Phf
!
Phf
P D
3
5; (13)
where is the marginal cost denominated in the home currency, Shv is the exchange
rate between currencies H and V (home currency price of the vehicle currency), Sf v
is the exchange rate between currency F and V (foreign currency price of the vehicle currency), and pi is the …rm’s price set in di¤erent currencies. All price indexes are
denominated in the vehicle currency. Other variables are as in Section 2.
Following the solution technique in Section 2, the …rm sets its price in VCP if and only if
1
2var(sf v) > cov(shv; sf v); and (14)
cov(shv;ln (1 i)) >
1
where lower cases denotes the log of exchange rates. From conditions (14) and (15), I develop the following proposition.44 The detailed proof is shown in Appendix B.
Proposition 3 A domestic …rm is more likely to use VCP for exports with: (i) a higher
exchange rate volatility between the destination and vehicle currency, var(sf v) ; (ii) a
lower covariance between two exchange rates cov(shv; sf v) ;(iii) a higher share of VCP
inputs.45
5.1.2 Empirical Evidence of VCP
Now, I turn to provide the empirical evidence of VCP in the UK trade data. As in the main analysis in Section 4, the estimating speci…cation uses a multinomial logit model with a categorical dependent variable that considers PCP, LCP, and VCP (the default option). The full regression results are reported in Table 8, with each column reporting two sets of results: PCP versus VCP and LCP versus VCP. Column 1 reports the benchmark results. Columns 2 and 3 add additional controls, and the benchmark results remain robust. Therefore, the following discussion focuses on the estimates in column 1.
First, Proposition 3(i) predicts that a higher degree of exchange rate volatility be-tween the destination and the vehicle currency increases the probability of VCP. How-ever, I do not …nd evidence supporting this model prediction because the coe¢ cients of the variable cvU SDc, representing the coe¢ cients of variation of the exchange rates between the importer’s currency and the dollar, appear insigni…cant.
Proposition 3(ii) suggests that a lower covariance between the two exchange rates (pound/dollar and importer’s currency/dollar) increases the probability of VCP. How-ever, the empirical evidence reported in column 1 points to the opposite result. The negative estimated coe¢ cients of cov(e$$; ec$)c imply that a higher covariance between
the two exchange rates shifts the …rm’s choice toward VCP and away from both PCP and LCP.
Proposition 3(iii) links input currency denomination with VCP choice. Similar to the strategy used in the main analysis, I consider the variable InputV CPi;c; which
measures …rmi0sshare of inputs from countrycpriced in VCP. The negative coe¢ cients show that a higher share of VCP inputs signi…cantly increases the probability of VCP. Furthermore, I consider a …rm-level measureInputU SDi;which captures the total share
of …rm i’s dollar-denominated inputs. A higher share of dollar-denominated inputs also
4 4
Note that all domestic …rms face the same exchange rate volatility between the home currency and the third country regardless of their trading partners; therefore, the termvar(shv)does not appear in the proposition.
4 5