PROCEEDINGS OF SPIE
SPIEDigitalLibrary.org/conference-proceedings-of-spie
Context-based interpolation of coarse
deep learning prediction maps for the
segmentation of fine structures in
immunofluorescence images
Nicolas Brieu, Christos G. Gavriel, David J. Harrison,
Peter D. Caie, Günter Schmidt
Nicolas Brieu, Christos G. Gavriel, David J. Harrison, Peter D. Caie, Günter
Schmidt, "Context-based interpolation of coarse deep learning prediction
maps for the segmentation of fine structures in immunofluorescence images,"
Proc. SPIE 10581, Medical Imaging 2018: Digital Pathology, 105810P (6
March 2018); doi: 10.1117/12.2292794
Context-based Interpolation of Coarse
Deep Learning Prediction Maps for the Segmentation
of Fine Structures in Immunofluorescence Images
Nicolas Brieu
a, Christos G. Gavriel
b, David J. Harrison
b, Peter D. Caie
band G¨
unter Schmidt
aa
Definiens AG, Bernhard-Wicki-Strasse 5, 80636, Munich, Germany
bSchool of Medicine, University of St Andrews, United Kingdom
ABSTRACT
The automatic analysis of digital pathology images is becoming of increasing interest for the development of novel therapeutic drugs and of the associated companion diagnostic tests in oncology. A precise quantification of the tumor microenvironment and therefore an accurate segmentation of the tumor extent are critical in this context. In this paper, we present a new approach based on visual context random forest to generate precise segmentation maps from deep learning coarse segmentation maps. Applied to the detection of cytokeratin positive (CK) epithelium regions in immunofluorescence (IF) images, we show that this method enables an accurate and fast detection of detailled structures in terms of qualitative and quantitative evaluation against three baseline approaches. For the method to be resilient to the high variability of staining intensity, a novel normalization algorithm for IF images is moreover introduced.
Keywords: digital pathology, whole slide imaging (WSI), immunofluorescence (IF), deep learning, random forest, semantic segmentation, interpolation.
1. DESCRIPTION OF PURPOSE
Machine learning is becoming a key component for the analysis of digital pathology images by enabling accuracy levels that have been difficult to achieved otherwise, whether for detection1, 2 or for segmentation purposes.3–6
This is particularly true for convolutional neural networks (CNNs). Classification networks as well as semantic
segmentation networks such as the fully convolutional (FCNs) network7 and the deconvolution networks (DNs)8
previously described by Long et al. and Noh et al. respectively, are commonly employed for the segmentation
of whole slide images.4–6 As an example workflow, given an input image and a trained classification network,
the corresponding segmentation map is obtained by applying the net sequentially on a rectangular grid.6
Al-ternatively to this sliding window strategy, a fully convolutional network enables the direct computation of a label map. To this end, the fully connected layers in the original classification CNN are converted by their convolutional equivalent. However, in both cases, only coarse segmentation maps are obtained while there is often, as for the application which will be discussed in this paper, a medical need to obtain precise segmentation maps.
A straightforward way to obtain segmentation maps at the original image resolution is to perform deconvo-lution by using linear interpolation. This however leads to non-linear inaccuracies. Alternatively, an expansive deconvolution path can be built as a mirror of the convolutional part of the CNN to reconstruct the segmentation
map from the CNN features.8 The resulting deconvolution networks approximately contain twice the number
of parameters as the original networks, therefore making the use of larger training datasets necessary. The cost associated to manual annotation by trained pathologists in conjunction with the inherent limitations of data augmentation (e.g. applying blind random variation of the input channels can lead to their unexpected under or oversaturation) may hamper the generation of large training datasets in practice. We introduce in this paper an alternative approach with the goal of restricting the number of parameters associated to the semantic segmenta-tion model. More specifically, we propose to perform a non-linear recovery to the original image resolusegmenta-tion from
the coarse CNN maps using a weaker classifier, a random forest (RF) model associated with low vision features.9
(a) (b) (c)
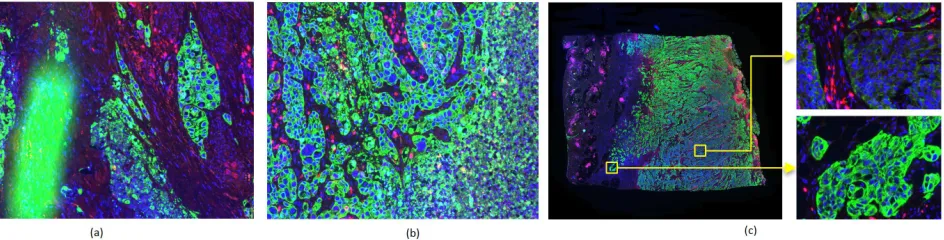
Figure 1. The detection of CK+ tumor epithelium regions in IF images (R:CD8, G:CK and B:Hoechst) is challenged by the presence of artefacts (a) by the unspecific staining of other tissue types, such as necrotic tissue (b), as well as by the variability of the fluorescence signal between and within slides (c). The first two challenges motivate the use of CNN, the last challenge the use of image normalization.
The use of RF models is motivated in this scenario by their proven ability to learn spatial patterns with a rel-atively low number of associated parameters. Also, their high speed at prediction makes them good candidates for dense prediction on Whole Slide Images (WSIs). In digital pathology, previous applications include region segmentation3and cell detection.2
Our method is applied to the segmentation of cytokeratin positive (CK+) epithelium regions in IF images. Each composite image is captured across four distinct fluorescence wavelengths: CK, CD3, CD8 and Hoechst. The high variability in textural appearance of artefacts (e.g. tears, folds and fluorescence deposits) and unspecific regions (e.g. necrotic areas), as illustrated in Fig. 1), makes the detection of true CK+ regions particularly difficult using hard-coded rules and/or features and motivates the use of a convolutional neural network (CNN). The computation of accurate segmentation maps is medically motivated by the detection and further classification of small but clinically signficant structures, such as tumor buds, as studied in10(cf. Fig. 4(a)). These structures are
in most cases of the size of very few nuclei. Typically separated by a few pixels only at the original resolution in dense areas, their separation is hardly possible at low resolution. In the first section, we will describe in detail the proposed application-generic random forest approach for precise segmentation recovery from CNN maps together with a more application-specific preprocessing step for image normalization. In a second section, we will present qualitative and quantitative results demonstrating the good performance of the proposed segmentation recovery method with respect to both accuracy and speed.
2. METHOD
At training, the proposed approach consists of the following steps: the training of a binary classification CNN, the application of the trained CNN to generate coarse CNN prediction maps, the bilinear interpolation of these maps to the original resolution and the mapping of these maps to the true segmentation at full resolution using a random forest model. At prediction, the three following steps - coarse CNN prediction, bilinear interpolation and RF prediction - are sequentially applied. A more detailed explanation of the training steps is included below.
• In a first step, we train a classification CNN on a set of patches against corresponding binary class labels (tumor epithelium vs. non-epithelium region). To this end, and given a set of annotated regions, a balanced number of training samples are randomly selected. Patches are then defined using the same resolution as the original image (0.65µm/pixel). The network consists of four convolution layers (5×5, 5×5, 3×3, 3×3) with (16, 32, 64, and 128) filters and stride of 1 respectively- each followed by a ReLu layer and a max pooling layer of stride 2, and of three fully connected layers of dimensions (512, 256, 2). The network takes
a 142×142 pixel patch with (CK, Hoechst, max(CD3,CD8)) channels as input. It outputs a two-element
vector containing the probability of the input patch to belong or not to a CK+ region. Stochastic gradient
descent with an inverse decay policy, a learning rate of 0.0005 and a momemtum of 0.90 is employed for
optimization. The Caffe11 framework and tools are used for training, while preparation and prediction
I
/
( 0
q
0
(
D
( 0
0
(
)
( 0
7
I
0
DEII i
,
-1--F
i I
[image:4.612.67.542.67.198.2]I
ob-
ili
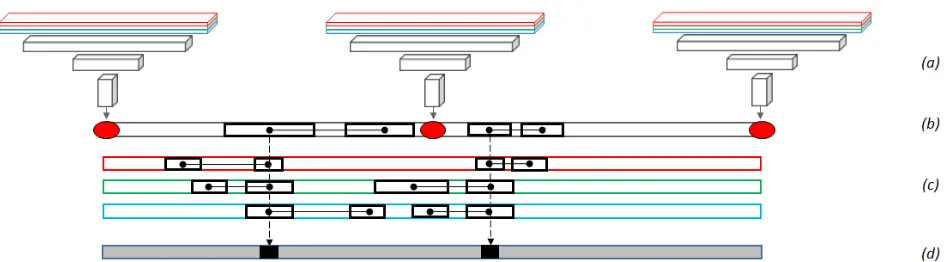
Figure 2. Proposed algorithm. (a)-(b) A coarse CNN map is predicted at a given pixel stride and is linearly interpolated to the original image size. (c) Haar-like and LBP features are computed on the resulting CNN maps and on the original input layers; (d) The final dense segmentation map is predicted using a visual context random forest model.
• In a second step, the trained CNN model is predicted using a sliding window strategy on a sparse regular
grid of stride 16 defined on the annotated regions. For comparison purposes, we also use the more computa-tionally efficient fully convolutional approach. In this case, the intrinsic downsample factor of the network is set by the number and the stride parameters of the max pooling layers that, for the network architecture detailed above, yield a downsampling factor of 16. In both cases, the resulting coarse segmentation maps are then transformed to the original image resolution using bi-linear interpolation.
• In a final step, we train a RF classifier to learn, given the visual context of each selected pixel in the
annotated regions, the non-linear mapping between the bi-linearly interpolated CNN maps and the label maps at the original image resolution. The RF model takes the bi-linearly interpolated CNN maps and the original layers (CK, Hoechst, max(CD3,CD8)) as input. It is trained on the same training samples as the ones used for the training of the CNN model. The random forest consists of 16 trees of depth 10, each tree being trained with ten percent of all the selected samples. The minimal number of samples for a node not to be considered a leaf is set to 50. For each tree and each node, the best splitting function is selected among 500 random candidates based on Haar-like and Locally Binary Pattern (LBP) features. The offsets and bounding box dimensions defining these features range from 0 and 20 and from 0 and 10 respectively.
• Because of the high intra-class variability - the non-epithelium class mainly consists of stromal tissue,
necrosis and various artefacts), we apply the following boosting strategy. At the first iteration, 100 000 samples are randomly selected and balanced for training. At each additional iteration, 25 000 false negative samples of each class are randomly selected and added to the training set, for a final training set of 300 000 samples after four iterations.
In this paper, we present a practical application to the proposed dense segmentation approach: the segmenta-tion of (CK+) regions in IF images representing viable tumor cells. IF has several benefits over brightfield (BF) imaging - e.g. a higher signal to noise ratio and the ability to multiplex a large number of different biomarkers at single cell resolution. However, some of the challenges inherent to the analysis of digital pathology images remain, such as batch variation, artefact and inherent patient heterogeneity. This is particularly true regarding the variability of stain intensities between images from different cancer patient cohorts5but also between images from different patients in the same cohort and, as shown in Fig. 1(c), between different regions of the same image. This leads us to introduce a locally adaptive normalization algorithm, whose steps are illustrated in Fig. 3 and described in more details below:
• The first operations are performed after downsampling the original image (1/10). Tissue region is detected
using a threshold selection approach12 on the pixel-wise maximum channel and split into square tiles.
• In a second step, and building on our previous work13 which relied on the detection of a unique set of
la)
(b)
(c)
(m.)
r;±
[image:5.612.70.545.70.247.2]r
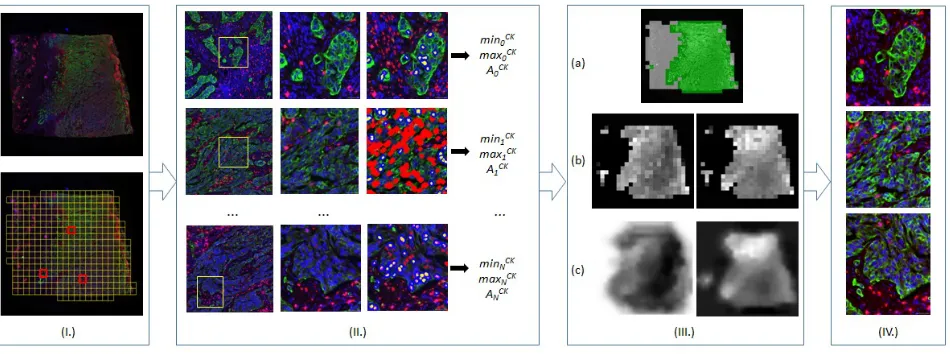
Figure 3. Locally adaptive normalization: (I.) Tiles are created; (II.) For each stain, min. and max. values are computed on detected reference objects; (III.) Valid tiles are selected (a) in order to compute (b), linearly interpolate and finally filter (c) min./max. maps (e.g. CK); (IV.) Min./max. normalization is applied in a pixel-by-pixel manner for each stain.
first for each of the tiles defined in the tissue region and second for each of the four input channels. Object candidates are first proposed and reference objects are then selected among these candidates based on geometrical features. More precisely, the detection of the reference objects associated with the CK channel consists of the following three steps. (1) We define a CD channel as the pixel-wise maximum between the
CD3 and CD8. (2) We select CK+ pixels using a Gaussian Mixture Model clustering (K = 3) on the
CieLab channels corresponding to taking the (CD, CK, Hoechst) channels as input RGB channels. CK+ pixels are then defined as the cluster with the highest CK value and within bounds defined after HSV transform on the Hue channel. (3) The empty spaces that are formed by the CK+ pixels and that fulfill a set of a-priori and simple morphological constrains (shape index Σ > 1.75, elliptic fit E > 0.65, and area 10µm2< A <500µm2) are finally selected as reference objects. A similar strategy is independently
repeated on the Hoechst, CD3 and CD8 channels. It reads as follows: first, candidates are detected
using threshold selection12 and blob detection14 approaches; second, good elliptical candidates (Σ>1.5,
E > 0.75, 10µm2 < A < 250µm2) are selected. Finally, and in order to increase the specificity of the detection, the objects associated with the three ’functional’ channels (CK, CD3 and CD8) are intersected with the objects associated with the ’anatomical’ Hoechst channel.
• In a third step, we associate each tileTi and each channelLc with the surface area Aci as well as with the
minimum and maximum values taken by their respective reference objects. For each input channel, the
minimum and maximum values are linearly interpolated from the tiles fulfillingAc
i > Acmin to the rest of
the image. The resulting minimum and maximum layers are finally employed, after Gaussian filtering, for the min/max normalization of the corresponding input IF channels.
3. RESULTS
The CNN and RF models are trained on manually annotated regions from 28 whole slide IF images. Both training and prediction are performed on channels that have been previously normalized. The slide resolution
is 0.65µm per pixel. Qualitative and quantitative results are computed on test regions which are distinct to
(a)
(b)
(c)
(d)
(e)
CNN_16 (b) CNN_4 (c) RF-Only (d) CNN_16-RF (e)
1
0.9
0.8
0.7
0.6
0.5
0.4
0.3
flscore_1 precision recall
128
64
32
16
Ñ
a, 8 E
F-4
2
1
0.5
Patch -based FCNet[5]
prediction prediction
[image:6.612.67.547.80.322.2]Figure 4. (a) CK and Hoechst channels; (b)-(c) Overlaid coarse CNN heatmaps for prediction strides of 16 and 4 pixels respectively; (d) Pixelwise heatmaps produced by the visual context RF model if only the IF channels are taken as input for the computation of the visual context features; (e) and if the linearly interpolated CNN maps are additionally taken.
Figure 5. Quantitative evaluation and prediction times associated to the baseline (b)-(d) and proposed (e) methods.
Fig. 5 plots the f1-score, recall and precision on the test dataset against manually annotated CK+ regions. To ensure a fair quantitative comparison against the results obtained with the other approaches, the coarse CNN
maps are linearly interpolated to the original image size. Our approach yields a more precise detection (0.80)
compared to the baseline approach (a) (+63%) and to a more sensitive detection (0.95) compared to the baseline
approaches (b)(+12%) and (c)(+8%), leading to an overall increase of the f1-score (0.87) by 34%, 6% and 4%
respectively. Additionally, and as shown in Fig. 5, the proposed dense approach enables a faster prediction than the least coarse CNN method (c), both if a sliding window strategy (6.5s vs. 84.6s) or a fully convolutional approach (2.8svs. 3.5s) are employed for prediction (region of 1400×1400 pixels, Tesla K80).
4. NEW OR BREAKTHROUGH WORK TO BE PRESENTED
[image:6.612.88.541.369.497.2]5. CONCLUSIONS
We propose in this work an approach for dense learning based on the prediction of CNN heatmaps at low resolu-tion followed by their non-linear interpolaresolu-tion to high resoluresolu-tion using visual context random forest. Qualitative and quantitative results on immunofluorescence histopathology images show the improved accuracy and speed of our method against three baseline approaches. Further applications on more data and other segmentation tasks in digital pathology together with the extension of the current approach to a trinary classification problem including benign epithelium structures is subject to future work.
REFERENCES
[1] Xie, Y., Kong, X., Xing, F., Liu, F., Su, H., and Yang, L., “Deep voting: A robust approach toward nucleus
localization in microscopy images,” in [Proc. International Conference on Medical Image Computing and
Computer-Assisted Intervention], 374–382 (2015).
[2] Brieu, N. and Schmidt, G., “Learning size adaptive local maxima selection for robust nuclei detection in
histopathology images,” in [Proc. IEEE International Symposium on Biomedical Imaging], 937–941, IEEE
(2017).
[3] Peter, L. e. a., “Scale-adaptive forest training via an efficient feature sampling scheme,” in [Proc.
Interna-tional Conference on Medical Image Computing and Computer-Assisted Intervention], 637–644 (2015).
[4] Litjens, G., S´anchez, C. I., Timofeeva, N., Hermsen, M., Nagtegaal, I., Kovacs, I., Hulsbergen-Van De Kaa, C., Bult, P., Van Ginneken, B., and Van Der Laak, J., “Deep learning as a tool for increased accuracy and efficiency of histopathological diagnosis,”Scientific reports6, 26286 (2016).
[5] Ciompi, F., Geessink, O., Bejnordi, B. E., de Souza, G. S., Baidoshvili, A., Litjens, G., van Ginneken, B., Nagtegaal, I., and van der Laak, J., “The importance of stain normalization in colorectal tissue classification
with convolutional networks,”arXiv preprint1702.05931(2017).
[6] Cruz-Roa, A., Gilmore, H., Basavanhally, A., Feldman, M., Ganesan, S., Shih, N. N., Tomaszewski, J.,
Gonz´alez, F. A., and Madabhushi, A., “Accurate and reproducible invasive breast cancer detection in
whole-slide images: A deep learning approach for quantifying tumor extent,” Scientific Reports 7, 46450
(2017).
[7] Long, J., Shelhamer, E., and Darrell, T., “Fully convolutional networks for semantic segmentation,” in
[Proc. IEEE Conference on Computer Vision and Pattern Recognition], 3431–3440 (2015).
[8] Noh, H., Hong, S., and Han, B., “Learning deconvolution network for semantic segmentation,” in [Proc.
IEEE International Conference on Computer Vision], 1520–1528 (2015).
[9] Criminisi, A., Shotton, J., and Bucciarelli, S., “Decision forests with long-range spatial context for organ
localization in ct volumes,” in [MICCAI Workshop on Probabilistic Models for Medical Image Analysis],1,
146–158 (2009).
[10] Caie, P. D., Zhou, Y., Turnbull, A. K., Oniscu, A., and Harrison, D. J., “Novel histopathologic feature identified through image analysis augments stage ii colorectal cancer clinical reporting,” Oncotarget7(28), 44381 (2016).
[11] Jia, Y. et al., “Caffe: Convolutional architecture for fast feature embedding,” arXiv:1408.5093(2014).
[12] Otsu, N., “A threshold selection method from gray-level histograms,” IEEE transactions on systems, man,
and cybernetics9(1), 62–66 (1979).
[13] Brieu, N., Pauly, O., Zimmermann, J., Binnig, G. K., and Schmidt, G., “Slide-specific models for
segmen-tation of differently stained digital histopathology whole slide images.,” in [Proc. SPIE Medical Imaging:
Image Processing], 978410 (2016).
[14] Forss´en, P.-E., “Maximally stable colour regions for recognition and matching,” in [Proc. IEEE Conference