Apache Point Observatory and New Mexico State University, P.O. Box 59, Sunspot, NM, 88349-0059, USA 6
Center for Cosmology and Particle Physics, Department of Physics, New York University, 4 Washington Place, New York, NY 10003, USA 7
Yale Center for Astronomy and Astrophysics, Physics Department, Yale University, P.O. Box 208120, New Haven, CT 06520-8120, USA 8Dunlap Institute for Astronomy and Astrophysics, University of Toronto, 50 St. George Street, Toronto, ON M5S 3H4, Canada
9
Department of Astronomy and Astrophysics, University of California, Santa Cruz, CA 95064, USA 10
European Southern Observatory, Karl-Schwarzschild-Strasse2, D-85748 Garching, Germany 11
Université Lyon 1, Observatoire de Lyon, Centre de Recherche Astrophysique de Lyon and Ecole Normale Supérieure de Lyon, 9 avenue Charles André, F-69230 Saint-Genis Laval, France
12
Department of Physics and Astronomy, University of Iowa, Iowa City, IA 52242, USA 13
NYU Abu Dhabi, P.O. Box 129188, Abu Dhabi, UAE 14
Institute of Astronomy and Astrophysics, Academia Sinica, Taipei 106, Taiwan 15
Department of Astronomy, Box 351580, University of Washington, Seattle, WA 98195, USA 16Institute of Cosmology and Gravitation, University of Portsmouth, Portsmouth, PO1 3FX, UK 17
School of Physics and Astronomy, University of Nottingham, University Park, Nottingham NG7 2RD, UK 18
Instituto de Astronomía,Universidad Nacional Autonóma de Mexico, A.P. 70-264, 04510, D.F. México 19
Department of Astronomy and Astrophysics, The Pennsylvania State University, University Park, PA 16802, USA 20
Institute for Gravitation and the Cosmos, The Pennsylvania State University, University Park, PA 16802, USA 21
Department of Physical Sciences, The Open University, Milton Keynes, MK7 6AA, UK 22
School of Physics and Astronomy, University of St. Andrews, North Haugh, St. Andrews KY16 9SS, UK 23
Department of Astronomy, University of Washington, Box 351580, Seattle, WA98195, USA Received 2014 August 13; accepted 2015 February 24; published 2015 May 11
ABSTRACT
We present an analysis of the data produced by the MaNGA prototype run(P-MaNGA), aiming to test how the radial gradients in recent star formation histories, as indicated by the 4000 Åbreak (Dn(4000)), Hδabsorption
(EW(HδA)), and Hαemission(EW(Hα))indices, can be useful for understanding disk growth and star formation
cessation in local galaxies. We classify 12 galaxies observed on two P-MaNGA plates as either centrally quiescent
(CQ) or centrally star-forming (CSF), according to whether Dn(4000)measured in the central spaxel of each
datacube exceeds 1.6. For each spaxel we generate both 2D maps and radial profiles of Dn(4000), EW(HδA), and
EW(Hα). We find that CSF galaxies generally show very weak or no radial variation in these diagnostics. In contrast, CQ galaxies present significant radial gradients, in the sense that Dn(4000)decreases, while both EW
(HδA)and EW(Hα)increase from the galactic center outward. The outer regions of the galaxies show greater
scatter on diagrams relating the three parameters than their central parts. In particular, the clear separation between centrally measured quiescent and star-forming galaxies in these diagnostic planes is largelyfilled in by the outer parts of galaxies whose global colors place them in the green valley, supporting the idea that the green valley represents a transition between blue-cloud and red-sequence phases, at least in our small sample. These results are consistent with a picture in which the cessation of star formation propagates from the center of a galaxy outwardas it moves to the red sequence.
Key words:galaxies: evolution –galaxies: formation–galaxies: general– galaxies: stellar content– methods: observational– surveys
1. INTRODUCTION
Our understanding of galaxies in the local universe has improved dramatically over the past decade, in significant part due to large optical spectroscopic surveys such as the Two-degree Field Galaxy Redshift Survey(Colless et al.2001)and the Sloan Digital Sky Survey(SDSS; York et al.2000). One of the major findings of the SDSS is the discovery of “galaxy
blue-cloud galaxies are usually gas-rich with blue colors, ongoing star formation, and disky morphology. The smaller number of galaxies found lying in the “green valley”between these two main populations in color space is widely believed to be caught in a transition phase from the blue cloud to the red sequence
(e.g., Bell et al. 2004; Faber et al. 2007; Martin et al. 2007; Schawinski et al. 2007; Schiminovich et al. 2007; Wyder et al. 2007; Mendez et al. 2011; Gonçalves et al. 2012), although this picture has recently been disputed by some authors (e.g., Schawinski et al. 2014). Narrow-field deep surveys reveal that this color bimodality persists out to redshift of at least 2.5 (e.g., Bell et al. 2004; Bundy et al. 2006; Cirasuolo et al. 2007; Cooper et al. 2008; Faber et al. 2007; Martin et al.2007; Cowie & Barger2008; Brammer et al.2009; Williams et al.2009; Muzzin et al.2012; Huang et al.2013a), though the prevalence of the red population has significantly increased since a redshift of unity (Bell et al. 2004; Bundy et al.2006; Faber et al.2007). The cessation of star formation is thus an important process that has been contributing to galaxy evolution over the past∼8 Gyr.
A complete picture of the way in which the star formation in galaxies gets shut down remains elusive. However, recent studies of the scaling relations of galaxy properties and their dependence on local environment have clearly established that, in addition to stellar mass, both internal structural properties and external environment are key indicators, or may even be drivers, of the star formation cessation processes in galaxies
(e.g., Kauffmann et al. 2006; Bell 2008; Franx et al. 2008; Peng et al.2010; Thomas et al.2010; Bell et al.2012; Cheung et al. 2012; Fabello et al. 2012; Li et al. 2012b; Fang et al. 2013; Mendel et al. 2013; Zhang et al. 2013). For instance, when studying the central galaxies in groups or clusters, the presence of a prominent bulge-like structure is found to be a necessary (but not sufficient) condition for stopping star formation (Bell2008; Bell et al. 2012; Cheung et al. 2012; Fang et al. 2013). In addition, studies of the relationship between galaxy morphology and color have revealed a significant population of red-sequence galaxies with disk-dominated spirals at both lowz (e.g., Wolf et al. 2005, 2009; Bamford et al. 2009; Masters et al. 2010)
andz∼1–2(e.g., Bundy et al.2010), which are preferentially found in galaxies with large bulges(Bundy et al.2010; Masters et al. 2010). These findings support the “morphological quenching” mechanism proposed by Martig et al. (2009), although studies of cold gas in massive galaxies indicate that a reduction in gas content is also required (e.g., Fabello et al.2011). For central galaxies in massive dark matter halos above a critical mass of ~1012M, “radio-mode” active
galactic nucleus (AGN) feedback and shockheating may effectively reduce the gas cooling efficiency, thus also playing an important role in preventing further star formation(Rees & Ostriker1977; Silk1977; Blumenthal et al.1984; Birnboim & Dekel 2003; Kereš et al. 2005; Dekel & Birnboim 2006; Cattaneo et al.2006). Powerful AGN feedback can also happen in the so-called quasar mode,which is predicted to be triggered by major mergers of gas-rich galaxies with comparable mass
(e.g., di Matteo et al. 2005; Hopkins et al. 2006), and is commonly adopted as one of the quenching processes in semi-analytic models.
For satellite galaxies, star formation quenching seems to be driven primarily by external processes occurring within their host group/cluster, such as gas stripping by rampressure
(Gunn & Gott1972; Abadi et al. 1999)and tidal interactions
(Toomre & Toomre1972; Moore et al. 1996). The “smoking gun” of observations showing HI gas being removed by rampressure stripping hasbeen obtained for spirals in nearby clusters of galaxies(e.g., Vogt et al.2004; Chung et al.2009; Merluzzi et al. 2013). Studies of color profiles and surface brightness profiles for satellite galaxies in SDSS group systems prefer more gentle processes such as“starvation”or “ strangu-lation” (e.g., Weinmann et al. 2009). On the other hand, a recent study of the specific SFR–stellar mass relation for galaxy groups/clusters at higher redshift(0.2 <z< 0.8, Lin et al.2014)
suggests that galaxy mergers play a primary role in quenching satellites in galaxy groups, while strangulation is a process more important in cluster-scale environments. There have also been statistical studies of the cold gas content and star formation in galaxies residing in different environments, using either direct atomic gas mass measurements from large blind surveys of HIemission such as the HIParkes All Sky Survey
(Zwaan et al. 2005) and the Arecibo Legacy Fast ALFA
(Giovanelli et al. 2005) survey, or indirect estimates of gas content from the optical photometry in surveys like SDSS(e.g., Li et al.2012b; Zhang et al.2013). These studies have revealed that gas-related quenching depends not only on the stellar mass of the satellite galaxiesbut also on their surface mass density. A full understanding of star formation cessation in galaxies thus requires spatially resolved measurements of stellar and gaseous components to be obtained for a large sample of galaxies covering wide ranges in mass and color, probing a range of environmental conditions. Previous studies for this purpose have been mainly based on multi-wavelength broad-band photometry, for both nearby galaxies(e.g., de Jong1996; Bell & de Jong 2000; Taylor et al. 2005; Muñoz-Mateos et al. 2007; Zibetti et al. 2009; Roche et al. 2010; Suh et al. 2010; Tortora et al. 2010; Gonzalez-Perez et al. 2011; Tortora et al. 2011; Kauffmann 2015) and those at high redshifts (e.g., Abraham et al. 1999; Azzollini et al. 2009; Szomoru et al. 2012,2013; Wuyts et al. 2012, 2013), while some authors also made use of long-slit spectroscopy (e.g., Moran et al.2012; Huang et al. 2013b). Significant improve-ments have been made in the past decade, thanks to many integral field unit (IFU) surveys that have obtained spatially resolved spectroscopy for samples of galaxies. However, todate, the samples have been relatively small (100 galaxies): SAURON(Bacon et al.2001), DiskMass(Bershady et al.2010), ATLAS3D(Cappellari et al. 2011).
the full optical wavelength range from 3600 to 10300 Å. MaNGA will thus provide 2D maps of stellar populations and recent star formation histories for a large number of quiescent and star-forming galaxies, thus enabling extensive exploration of the various processes by which star formation ceases in the local universe.
In this paper, to assess the potential use of the MaNGA survey in studying the cessation of star formation, and to derive some initial results in this area, we present an analysis of the MaNGA prototype (P-MaNGA)data for a set of 12 galaxies, which were observed in the pilot run in 2012 December and 2013 January. These observations were made through time granted by the Sloan Digital Sky Survey-III(SDSS-III; Eisen-stein et al. 2011). The prototype data are described in more detail in Bundy et al. (2015), which also provides a general overview of the MaNGA project.
For each of the P-MaNGA galaxies and for each spectrum in the associated data cube, we have performed full spectralfitting using the methodology developed in Li et al.(2005), in order to separate out emission-line components from the underlying absorption-line stellar spectrum. From these decomposed spectra, we have obtained full 2D maps of three key parameters—Dn(4000) (the depth of the 4000 Å break), EW
(HδA) (the equivalent width of the Hδabsorption line), and EW
(Hα) (the equivalent width of the Hα emission line)—which are known to be sensitive indicators of stellar populations of different ages(Kauffmann et al.2003a; Kauffmann2014). We then investigate any radial variations in the recent star formation histories of the galaxies by plotting the values of these parameters for different subregions of each galaxy, to see how they change with position. As we will show, the P-MaNGA sample, though small in size, reveals intriguing systematic trends in the three diagnostic parameters across these galaxies, demonstrating the potential for using MaNGA
(and similar IFU surveys) to understand disk growth and star formation cessation in local galaxies.
Throughout this paper we assume a Λ cold dark matter cosmology model withΩm=0.27,ΩΛ=0.73, andh=0.7. A
Chabrier(2003)stellar initial mass function is adopted.
2. DATA
2.1. P-MaNGA Observations
In the present work, we use data obtained using the MaNGA engineering prototype instrument (hereafter P-MaNGA) in 2013 January. P-MaNGA was designed to explore a variety of
containing six galaxies. Some of the P-MaNGA targets were drawn from early versions of the full MaNGA sample
(D. Wake et al. 2015, in preparation), but in many cases P-MaNGA targets were chosen for specific reasons. In each of the three plates, one N127 IFU was allocated for comparison
purposes to a galaxy observed by the CALIFA survey(Sánchez et al.2012b), even if the galaxy would not otherwise satisfy the MaNGA selection cuts. Additionally, the non-optimal IFU complement of the P-MaNGA instrument required some targets to be selected manually. For each plate, observations were obtained in sets of three 20-minuteexposures, which were dithered by approximately afiber radius along the vertices of an equilateral triangle to provide uniform coverage across each IFU. These three plates were observed to varying depths and in varying conditions, as required by the P-MaNGA engineering tasks. Although plate 6650 (Field 9)was observed to a depth comparable to what will be regularly achieved during MaNGA operations, plates 6651(Field 11)and 6652(Field 4)are both significantly shallower than MaNGA survey data, and plate 6651 was intentionally observed at high airmass (∼1.5), resulting in particularly poor image quality. In this paper we use data obtained with plates 6650 and 6652 (see Table 1), while excluding plate 6651.
The raw data were reduced using a prototype of the MaNGA Data Reduction Pipeline, which is described in detail by Law et al.(2015). In brief, individualfiberflux and inverse variance spectra were extracted using a row-by-row algorithm, wave-length calibration was obtained from a series of neon–mercury– cadmium arc lines, and the spectra were flat-fielded using internal quartz calibration lamps. Skysubtraction of the IFU fiber spectra was performed by constructing a cubic basis spline model of the sky backgroundflux as seen by the 41 individual fibers placed on blank regions of sky, and subtracting the resulting composite spectrum shifted to the wavelength solution of each IFUfiber.
standard star, which results in a few percent photometric uncertainty (see Yan et al.2015).
Flux-calibrated spectra from the blue and red cameras were combined across the dichroic break using an inverse-variance weighted basis spline function. Astrometric solutions were derived for each individual fiber spectrum that incorporate information about the IFU bundle metrology(i.e.,fiber location within an IFU), dithering, and atmospheric chromatic differ-ential refraction, among other effects. Fiber spectra from all exposures for a given galaxy were then combined into a single datacube (and corresponding inverse variance array) using these astrometric solutions and a nearest-neighbor sampling algorithm similar to that used by the CALIFA survey. For the
P-MaNGA datacubes, a spaxel size of 0″. 5 was chosen. The typical effective spatial resolution in the reconstructed datacubes can be described by a Gaussian with an FWHM≈ 2″. 5. When binning the datacubes, we scale the resulting error vectors to account, at least approximately, for wavelength and spatial covariance in the P-MaNGA error cubes.
2.2. SDSS-I Perspective of the P-MaNGA Galaxies
[image:4.612.41.575.74.265.2]All our galaxies have photometry in the SDSS-Ifive bands, as well as archival spectroscopy from the SDSS-I 3″. 0-diameter fiber. Figures1and2show the properties of this sample based on the SDSS data. With these twofigures we aim to show how
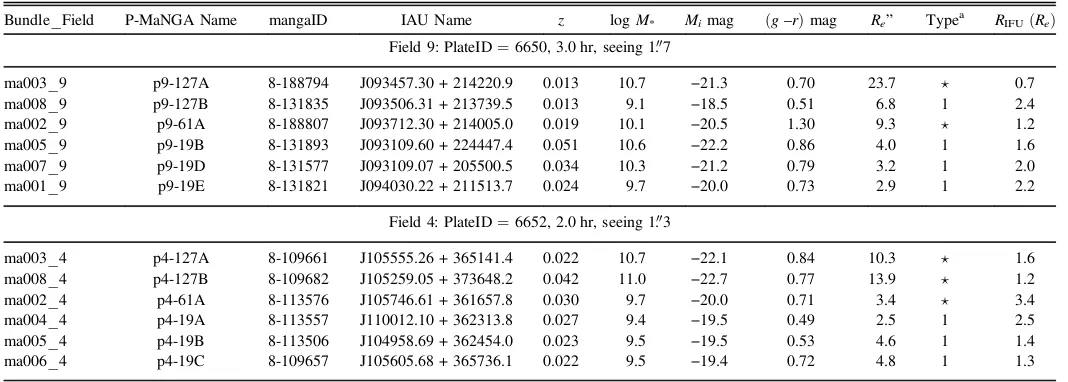
Table 1
Prototype Run Galaxies Observed
Bundle_Field P-MaNGA Name mangaID IAU Name z logM* Mimag (g–r)mag Re” Typea RIFU(Re)
Field 9: PlateID=6650, 3.0 hr, seeing 1. 7″
ma003_9 p9-127A 8-188794 J093457.30 + 214220.9 0.013 10.7 −21.3 0.70 23.7 å 0.7 ma008_9 p9-127B 8-131835 J093506.31 + 213739.5 0.013 9.1 −18.5 0.51 6.8 1 2.4 ma002_9 p9-61A 8-188807 J093712.30 + 214005.0 0.019 10.1 −20.5 1.30 9.3 å 1.2 ma005_9 p9-19B 8-131893 J093109.60 + 224447.4 0.051 10.6 −22.2 0.86 4.0 1 1.6 ma007_9 p9-19D 8-131577 J093109.07 + 205500.5 0.034 10.3 −21.2 0.79 3.2 1 2.0 ma001_9 p9-19E 8-131821 J094030.22 + 211513.7 0.024 9.7 −20.0 0.73 2.9 1 2.2
Field 4: PlateID=6652, 2.0 hr, seeing 1. 3″
ma003_4 p4-127A 8-109661 J105555.26 + 365141.4 0.022 10.7 −22.1 0.84 10.3 å 1.6 ma008_4 p4-127B 8-109682 J105259.05 + 373648.2 0.042 11.0 −22.7 0.77 13.9 å 1.2 ma002_4 p4-61A 8-113576 J105746.61 + 361657.8 0.030 9.7 −20.0 0.71 3.4 å 3.4 ma004_4 p4-19A 8-113557 J110012.10 + 362313.8 0.027 9.4 −19.5 0.49 2.5 1 2.5 ma005_4 p4-19B 8-113506 J104958.69 + 362454.0 0.023 9.5 −19.5 0.53 4.6 1 1.4 ma006_4 p4-19C 8-109657 J105605.68 + 365736.1 0.022 9.5 −19.4 0.72 4.8 1 1.3
Note.The P-MaNGA Name is composed of a“p”for“prototype”followed by thefield ID, a hyphen, and then the shorthand ID for the bundle used. This shorthand includes a number corresponding toNIFUfor that bundle. The(g–r)magnitude is extinctioncorrected.
a
Target type 1 indicates that the galaxy would be selected in the MaNGA Survey’s Primary Sample. These galaxies often have spatial coverage to larger than 1.5Redue to the different bundle size distribution used in P-MaNGA. A“å”indicates a galaxy that was chosen by hand for the prototype run and does not pass the nominal selection criteria.
Figure 1.P-MaNGA galaxies are plotted as large red or blue symbols on the stellar mass vs. NUV−rcolor plane(left panel)and the BPT(Baldwin et al.1981)
[image:4.612.118.495.337.516.2]our galaxies compare to the larger SDSS-I sample from which they are drawn.
Figure 1 presents the galaxies on the plane of stellar mass versus NUV−rcolor and the BPT diagram (Baldwin et al. 1981). We use estimates of stellar mass and NUV−rfrom the New York University Value-Added Galaxy Catalog (NYU-VAGC24; Blanton et al. 2005a) and NASA Sloan Atlas (NSA).25 NSA is a catalog of images and parameters of local galaxies based on data from SDSS (York et al. 2000), GALEX (Martin et al. 2005), and 2MASS
(Skrutskie et al. 2006); for details see Blanton et al.
(2005b, 2005a, 2011). The stellar mass for each galaxy is estimated based on its spectroscopically measured redshift and the five-band Petrosian magnitudes from SDSS photometric data, as described in detail in Blanton & Roweis (2007). The NUV−rcolor is defined by the integrated light in the NUVband from GALEX and the Petrosian magnitude in the
rband from SDSS, both corrected for Galactic extinction. Measurements of the emission-line ratios for the BPT diagram are taken from the MPA/JHU SDSS database26 (Brinchmann et al.2004).
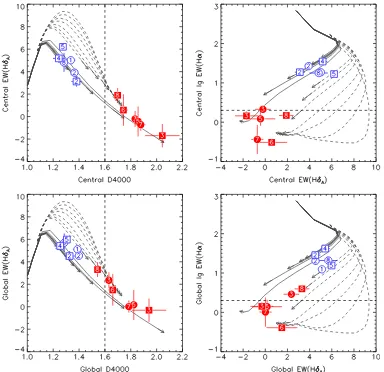
Figure 2 displays the galaxies in the Dn(4000)versus EW
(HδA)and EW(HδA)versus log10EW(Hα)planes, where
Dn(4000)is the 4000 Å break in the optical spectrum as
defined by Balogh et al.(1999), EW(HδA)the Lick/IDS index
of the Hδ absorption line defined by Worthey & Ottaviani
(1997), and log10EW(Hα)the logarithm of Hα emission line
equivalent width. We use measurements of these parameters from the MPA/JHU database, which were obtained from the SDSS 3″. 0-diameter spectra, thus probing the central 1–2 kpc for the P-MaNGA galaxies.
In both thesefigures, we use squares and circles for galaxies in Fields 4 and 9, respectively, and label each galaxy by the BundleID used in those fields. We divide these galaxies into two subsets according to the 4000 Å break in the central spaxel of their datacube (see Section2.3): centrally quiescent (CQ)
with Dn(4000) > 1.6 and centrally star-forming (CSF)with
Dn(4000)⩽1.6. The two subsets are highlighted in thefigures
with red filledand blue open symbols, respectively. We will use the same symbols and colors for subsequentfigures unless otherwise stated. For comparison, we have selected a volume-limited sample of 21,328 galaxies with stellar mass above 109
M and redshift in the range 0.01 < z < 0.03 from the NSA. Distributions of this sample are plotted in grayscale maps in Figures1 and2.
As can be seen from Figure 1, the P-MaNGA sample
(though small in size) spans a wide range in both the color– mass and BPT diagrams, similar to that of the general population. In the literature, galaxies are usually classified into three types according to their NUV−rcolor: red-sequence
(NUV−r > 5), green-valley (4⩽ NUV−r ⩽5), and blue-cloud(NUV−r < 4). Accordingly, half of the sample galaxies fall in the blue-cloud region, indicative of ongoing star formation and relatively rich cold gas content. For all the galaxies except ma002_9 and ma003_9, the color-based classification and the Dn(4000)-based classification are
con-sistent with each other, in the sense that the blue-cloud galaxies are CSF, while the objects in the green valley and red sequence combine to form the CQ galaxy class. This result indicates that green-valley and red-sequence galaxies share similar properties in their central regions, and that their different global color can be mainly attributed to the different stellar population and gas content in their outer parts.
[image:5.612.120.497.50.232.2]One of the two exceptions,ma003_9, is a strong Seyfert-type AGN according to its location in the BPT diagram, and it is an outlier in the color–mass diagram due to its relatively blue color at its stellar mass. As shown below, this galaxy presents a red core and a blue outer disk in the optical image, such that its classification would be more reasonable if the measurement of NUV−rcolor were confined to its central region. The strong contradiction between the central and global classification in this case highlights the importance of spatially resolved measurements. The other exception, ma002_9, is a dusty, inclined spiral. It is a CSF galaxy according to its small value of Dn(4000), but it is classified as a green-valley galaxy based
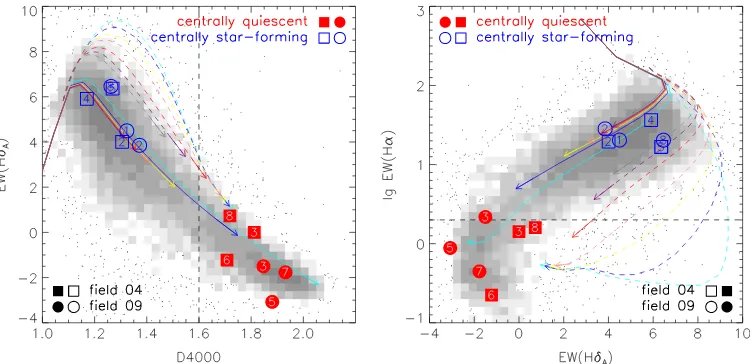
Figure 2.P-MaNGA galaxies are plotted as large red or blue symbols on planes of 4000 Åbreak vs. HδA(left panel)and HδAvs. log10EW(Hα) (right panel). Shown
by solid and dashed lines are solar-metallicity models of continuous star formation histories and star formation bursts calculated using the stellar population synthesis code of Bruzual & Charlot(2003). Distributions of a volume-limited sample selected from the SDSS are shown as gray scale for comparison. Symbols/colors are the same as in the previousfigure. The dashed vertical line in the leftpanel indicates a constant Dn(4000) =1.6, while the dashed horizontal line in the rightpanel is for EW(Hα) =2 Å; these are the typical values adopted in the literature to divide a galaxy into quiescent and star-forming populations.
24http://sdss.physics.nyu.edu/vagc/ 25
http://www.nsatlas.org
26
on the relatively red NUV−rcolor, which in this case is likely caused by dust.
The Dn(4000)and HδAindices are known to be indicators of
the recent star formation history of galaxies, with Dn(4000)being a good proxy for the luminosity-weighted
stellar age, and HδAa sensitive tracer of the star formation that
occurred 0.1–1 Gyr ago (Bruzual & Charlot 2003, hereafter BC03). As shown in Kauffmann et al.(2003a), the location of a galaxy in the plane of Dn(4000)and HδAprovides a powerful
diagnostic of whether the galaxy has experienced a continuous star formation history or bursts over the past 1–2 Gyr. This property is illustrated in the leftpanel of Figure 2, where we present the Dn(4000)and HδAindices for the BC03 models of
solar metallicity that follow exponentially declining star formation histories (SFRµexp(-t t)), either continuous star formation decline with longe-folding times(τ> 5 × 10⁸yr;solid lines), or bursts of star formation with fairly short e-folding times (τ < 5 × 10⁸yr;dashed lines). Different colors indicate the adopted values of the characteristic timescale τ. The rightpanel presents the same sets of models on the HδAindex
versus log10EW(Hα)plane. The Hαluminosity is computed
from the output of the BC03 models. We convert Lyman continuum photons to Hαphotons following Hunter & Elme-green(2004, see Equations(B2)–(B4)in their Appendix). We take the recombination coefficients and Hα/Hβratios from Hummer & Storey(1987). For the LMC, solar-metallicity, and supersolar-metallicity models we assume nebular temperatures of Te = 15,000, 10,000, and 5000 K, respectively. The
P-MaNGA galaxies occupy roughly the same region as the general population in both panels, with the CSF galaxies located in the low-Dn(4000)and high-HδAregion and the CQ
galaxies in the opposite corner. It is, however, notable that the P-MaNGA sample lacks galaxies of intermediate values in these indices, and consequently the current sample is somewhat biased to a more bimodal distribution on both planes compared to the full population of SDSS galaxies.
In the rest of this paper we will use the Dn(4000)–EW
(HδA)and EW(HδA)–log10EW(Hα)planes to investigate the
maps and radial profiles of recent star formation histories of the P-MaNGA galaxies. In this case we use relative measurements of the three indices as indicators of recent star formation history, but we do not present quantitative measurements of mean stellar age, which depends on the sensitivity of these indices to stellar metallicity, element abundance, and dust attenuation (e.g., Worthey & Ottaviani 1997; Bruzual & Charlot 2003; Thomas et al. 2004; Thomas & Davies 2006; Sánchez et al. 2012a). In a parallel paper (Wilkinson et al. 2015) we attempt to simultaneously obtain the stellar age, metallicity, and dust content for the P-MaNGA galaxies, by fitting stellar population models to the full spectrum. In addition, in the present paper we assume that Hαemission is just a signature of recent star formation. However, EW
(Hα)lower than 6 Å was found to be more compatible with light from post-AGB stars (Papaderos et al. 2013; Sarzi et al. 2013). One should keep these caveats in mind when interpreting the observational results presented in this paper.
2.3. Spectral Fitting
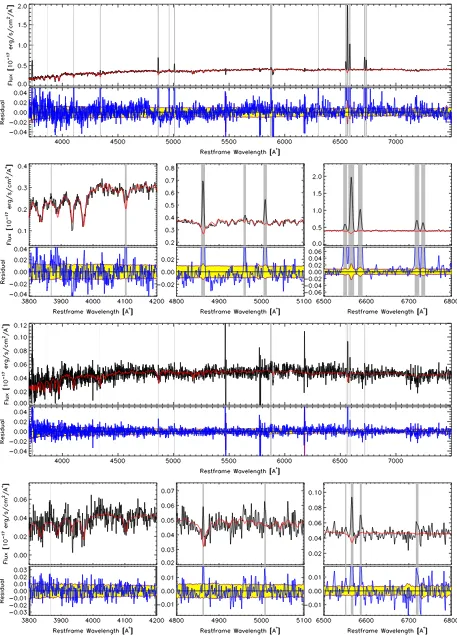
For each spectrum in the datacubes generated as described in Section 2.1, we have performed a decomposition of the emission-line component and the continuum plus absorption-line component (hereafter called the “stellar component”),
using both the public spectral fitting code STARLIGHT(Cid Fernandes et al.2004)and our own code described in Li et al.
(2005). We have carefully masked out the emission-line regions when doing the spectral fitting. Figure 3 displays the results of this procedure when applied to two representative spectra from the MaNGA datacubes, one with a high S/N(S/N
∼20)at 5500 Å in the continuum and one with a more modest S/N∼8.
We measure the Dn(4000)and HδAindices from each best-fit
spectrum, defining the indices in the same way as in the previous subsection. We have also measured the flux and equivalent width of the emission lines (both Balmer and forbidden) by fitting a Gaussian profile to these lines in the stellar component-subtracted spectrum. The emission-line parameters from STARLIGHT were compared to those obtained from our code. We have also performed the same procedure of spectral fitting and parameter measuring on Voronoi-binned versions of the datacubes to assess the effects of spatial averaging before fitting. All these analyses were found to return indistinguishable results, and so in what follows we will only present the values we obtain when applying our code to the unbinned datacubes.
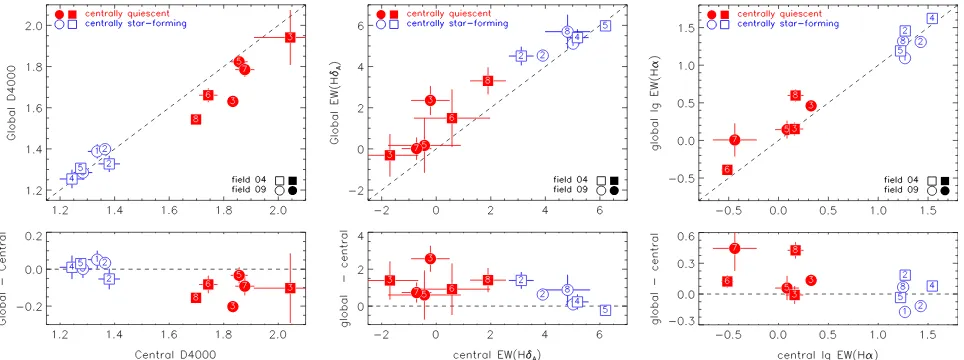
We have also applied our code to the archival SDSS spectra of the centers of the P-MaNGA galaxies, and in Figure 4 we compare the resulting measurements of Dn(4000), EW(HδA), and
log10EW(Hα)to those obtained from the central spaxel of the
P-MaNGA datacubes(plotted as blue squares in thefigure). In the samefigure, we also compare our measurements, from both SDSS (black crosses) and the central spaxel of P-MaNGA datacubes(red triangles), with the measurements taken from the MPA/JHU database. Overall, the values from different observa-tions and pipelines agree well with each other. We have visually examined the best-fit spectrum for the few outliersandfind that our code provides a reasonably good fit to both SDSS and P-MaNGA spectra even in these cases. The relatively large discrepancy in one of the outliers(the blue square and black cross located in the left-bottom corner in the rightpanel)is caused by the bad data pixels over the Hαband in the SDSS spectrum.
We note that, when fitting the spectra and measuring the diagnostic parameters, we do not take into account the covariance between wavelengths, nor the covariance between pixels. Methods for tracking such covariances have been studied in depth(e.g., Sharp et al.2015, for the SAMI survey). As pointed out in Wilkinson et al.(2015), when compared to P-MaNGA, MaNGA will provide more accurately estimated spectral errors(thus accurate error propagation through to the final datacubes), allowing construction of covariances between pixels. We will apply a detailed treatment of covariance in MaNGA data in future work.
3. RESULTS
3.1. Global versus Central Parameters
from the stacking. We then measure the diagnostic parameters Dn(4000), EW(HδA), and log10EW(Hα)in the same manner as
above. Figure5compares the global measurements to the same parameters obtained from the central spaxel of the galaxies. For CSF galaxies, the global parameters differ little from the central ones. In contrast, however, most of the CQ galaxies show significant difference between central and global parameters, with smaller Dn(4000)and larger EW(HδA)and log10EW (Hα)in the latter. This result implies that the outer regions of CQ galaxies contain younger stellar populations and have therefore experienced more recent star formation than their inner parts. The difference in EW(Hα)is relatively weak compared to the other two parameters, suggesting that the central-to-global variation may be mainly driven by the radial variation in recent star formation history, but not the current SFR. It may also be the case that Hαis not a reliable tracer of star formation in galaxies dominated by older stellar popula-tions(see Section4).
A comparison of the global parameters with the central parameters on the diagnostic diagrams of recent star formation history is shown in Figure6, where we plot the galaxies on the Dn(4000)-EW(HδA)and EW(HδA)-log10EW(Hα)planes,
using the central and global parameters for the upper and lower panels, respectively. Comparing the upper and lower panels, we identify two noticeable effects. First, the gap between the CSF and CQ galaxies as seen in the upper panels is largely filled in the lower panels, and this in-fill is made up exclusively of CQ galaxies due to the broad scatter in their global values of Dn(4000)and EW(HδA). Second, when
globally measured, both the CSF galaxies and the CQ galaxies appear to deviate from the continuous star formation models, moving by varying degrees toward the regime of recent bursts.
3.2. 2D Maps and Radial Profiles
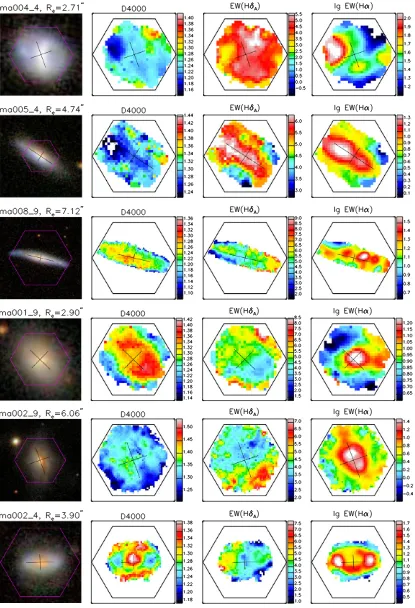
In Figures 7 and 8 we present the 2D maps of the three diagnostic parameters, Dn(4000), EW(HδA), and log10EW (Hα), for all 12 galaxies in the sample, with the CSF galaxies in onefigure and the CQ galaxies in the other. In each case, the galaxies have been ordered such that the central values of Dn(4000), as measured from the central spaxel of the
[image:8.612.76.545.51.200.2]datacubes, increasefrom left to right. The SDSSgri image is also shown for each galaxy. The effective radius, length, and direction of major and minor axes are indicated in the images
Figure 4.Measurements of Dn(4000) (left panel), EW(HδA) (middle panel), and log10EW(Hα) (right panel)for the P-MaNGA galaxies. Blue squares compare the
measurements obtained by applying our code to the central spaxel of P-MaNGA datacubes and the SDSS spectra, which are compared in red triangles and black crosses to the measurements taken from the MPA/JHU database. For clarity errors are shown only on the blue squares, which compare the measurements obtained from the SDSS and P-MaNGA spectra. For a given parameter its error is estimated by the 1σscatter between the three measurements.
Figure 5.Upper panels compare the global Dn(4000), EW(HδA), and log10EW(Hα)of the P-MaNGA galaxies with the same parameters measured from the central
[image:8.612.67.549.259.439.2]and maps. When generating the maps, we only employ spaxels where the S/N in the continuum at 5500 Å is greater than 3.
Consistent with what was found from the global measure-ments in the previous subsection, the overall impression from the 2D maps is that all the galaxies show variation within the probed radius in all three parameters, but to varying degrees and differing radial extents, with the variations more pronounced in the CQ galaxies. As noted above in Section2.2, galaxyma003_9shows a blue outer disk in the optical image, which causes it to be classified as a blue-cloud galaxy in the color–mass diagram, although its red core suggests that this is intrinsically a CQ galaxy. In agreement with this interpretation, the galaxy shows strong contrast between the central and outer parts in the maps of all three diagnostic parameters. Similar behavior is seen in galaxyma008_4, the most massive galaxy in the P-MaNGA sample with M*=2´1011M, which is
also a face-on spiral with a relatively blue outer disk(although less prominent than inma003_9)and strong radial variation in the diagnostic parameters. The galaxy is classified as a green-valley galaxy on the color–mass diagram(see Figure1)
due to its intermediate color, NUV−r = 4.4, which is unusually blue for its large stellar mass.
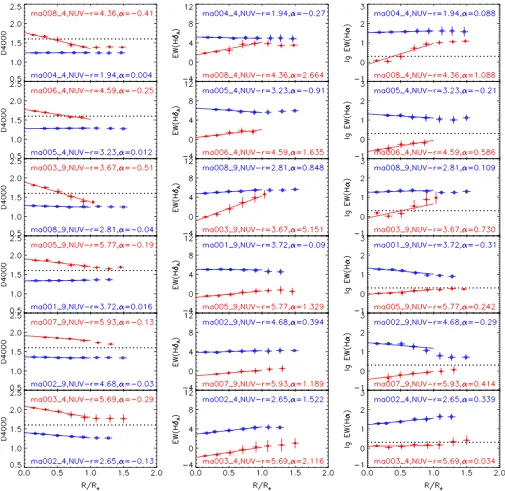
The radial variations of the galaxies are shown more clearly in Figure 9, where we plot the radial profiles of the three parameters for all 12 galaxies. To save space, we display two galaxies in every panel, with one CSF galaxy (blue symbols) and one CQ galaxy (red symbols). This paired format also highlights the highly different behavior of the two broad classes. In constructing these profiles, we have corrected for the effects of inclination on the radius for each spaxel in the datacubes, using the minor-to-major axis ratio from NSA, as determined from the SDSSr-band photometry. When estimat-ing the radial profile, we bin all the spaxels with the continuum S/N > 10 at 5500 Å into a set of radial intervals with a constant width of Dlog10
(
R Re)
=0.2, according to the deprojectedradius of the spaxel(r)and the effective radius of the galaxy
(Re). The value of the profile at a given radius is then estimated
by the median of the spaxels falling in the radial interval, and the error is given by the 1σscatter between the spaxels.
Figure 9 clearly shows that CQ galaxies generally present significant radial gradients in all the parameters, in the sense that the outer parts of the galaxies show weaker Dn(4000) (thus
[image:9.612.115.499.49.421.2]a larger fraction of stellar populations with ages of <1 Gyr), stronger Hδabsorption(thus more recent star formation in the
Figure 6.Distribution of the P-MaNGA galaxies(symbols)on the plane of 4000 Åbreak vs. HδAindex(leftpanels)and the plane of HδAindex vs. log10EW(Hα),
the equivalent width of Hαemission line in logarithm(rightpanels). Results in the upper panels are for the central spaxel of the P-MaNGA datacubes. Results in the lower panels are based on the average spectrum, obtained from stacking the whole datacube for a given galaxy. Shown in solid and dashed lines are solar-metallicity models of continuous star formation histories and star formation bursts calculated using the stellar population synthesis code of Bruzual & Charlot(2003). Symbols
Figure 7.Panels from left to right show the SDSS image and maps of Dn(4000), EW(HδA), and log10EW(Hα)for thecentrally star-forming galaxiesin P-MaNGA.
From top to bottom panels the galaxies are sorted by increasing the Dn(4000)measured from the central spaxel of the P-MaNGA datacube. The longer black line in each panel indicates the direction of the major axis, with the line length equal to twice the effective radius of the galaxy(Re). The shorter line perpendicular to the major axis indicates the minor axis, and the line length is set tob/atimesRe, whereb/ais the minor-to-major axis ratio determined from ther-band SDSS image. The P-MaNGA galaxy name, as well as the value ofRe, is indicated above the leftmost panel, where the size of the SDSS images is set to 6Re× 6Re. The hexagon in each panel indicates thefield of view of the IFU bundle. The color scales in the Dn(4000), EW(HδA), and log10EW(Hα)maps are tailored to each galaxy for the sake of
Figure 8.SDSS image(leftmost panels)and maps of Dn(4000), EW(HδA), and log10EW(Hα)for thecentrally quiescent galaxiesin P-MaNGA. The galaxies from
past few Myr), and stronger Hαemission(thus likely stronger ongoing star formation). In contrast, CSF galaxies possess quiteflat profiles in all cases, revealing little by way of gradient in star formation properties. At least out to Re, the radial
profiles are close to linear for all the galaxies. For each galaxy we apply a linearfit to the radial profile within Reand show the
bestfit as a solid line in thefigure. The slope of the best-fit line is indicated in each panel. Figure10compares the slope index for the three parameters, α(Dn(4000)), α(EW(HδA)), and α
(log10EW(Hα)). These plots confirm that the radial gradients
in the CSF galaxies are small, but also showthat the different parameters are well correlated across galaxies of both types. This correlation is particularly strong for α(Dn(4000))and α
(EW(HδA)), which are beautifully (albeit nonlinearly)
corre-lated. However, given the small sample size, these apparent correlations should probably not be overinterpreted. We note that the weak variation in EW(Hα)seen in our CSF galaxies is similar to the recent IFU observations of Hα emission in GAMA survey galaxies(Brough et al.2013).
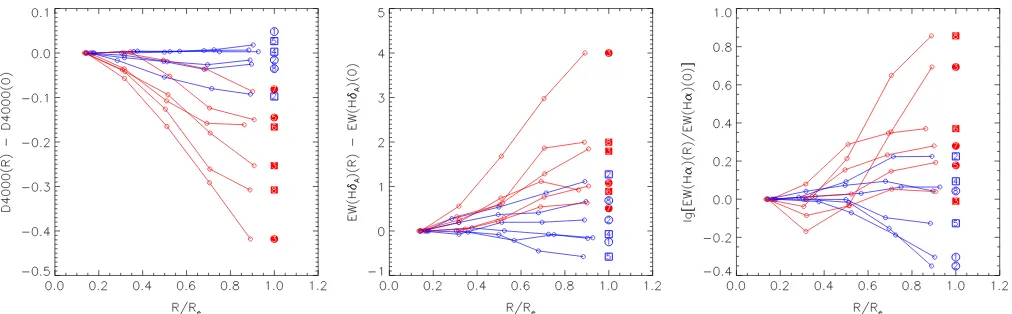
[image:12.612.53.558.49.540.2]Figure 11 compares the slopes of the radial profiles in a different way, where we plot all the profiles in the same panel for a given parameter, normalizing each profile by the innermost radial bin and scaling the radii by the effective radius. The differing behavior of the two classes of galaxies is striking. The CSF galaxies show only weak or no radial variation, while the CQ galaxies display steeper profiles,
Figure 9.Radial profiles of three diagnostic parameters measured for the P-MaNGA galaxies(from left to right): Dn(4000), EW(HδA), and log10EW(Hα). Each panel
spanning a wide range in slope. It is, however, interesting to note that although the average properties of the two types differ dramatically, there is a degree of overlap between the classes in all panels, suggesting that a continuum of the same underlying physical processes has driven star formation in all these galaxies.
As indicated from the 2D maps, the galaxies with a blue outer disk (ma003_9 and ma008_4) indeed show the strongest radial variation in all parameters. These two galaxies manifest their peculiarity in the profile of log10EW(Hα), which isflat(for ma008_4) or even negative (for ma003_9) at R < 0.4Re,
before rapidly increasing at larger radii. When compared to these two galaxies, the other CQ galaxies present much shallower profiles (though still steeper than that of CSF galaxies), with log10EW(Hα)increasing smoothly at R < 0.6Reand becoming
flat at larger radii. The large values of log10EW(Hα)at large radii
indicatethat these two galaxies are strongly forming stars in their outer disks. This measurement is consistent with blue NUV−rcolor in these outer disks, which is known to be a sensitive indicator of the cold gas mass fraction in galaxies(e.g., Catinella et al.2010; Li et al. 2012a).
The negative log10EW(Hα)profile at R < 0.4Reseen in
ma003_9is also found in ma003_4and may be caused by the presence of a bulge or AGN in the galactic center. Indeed, according to the BPT diagram(Figure1), the two galaxies are the only AGN candidates in the sample. It is likely that an
AGN contributes to the Hαemission in the central region, thus enhancing the central log10EW(Hα)and leading to a dip in the
profile as seen at R ∼ 0.3Re. Interestingly, apart from this
feature, the radial profiles of the two probableAGN hosts are similar to those of the other CQ galaxies, suggesting that current, low levels of AGN activity may not have a strong effect on recent star formation activity, at least for these two examples.
It is interesting to note that the three galaxies discussed above, ma003_9, ma008_4, and ma003_4, share a number of common properties: they are all spiral galaxies with a quiescent center, at the massive end of our sample withM*∼
1011 M, and showing the largest gradients in
Dn(4000)indicative of young stellar populations formed within
the past few Gyr. They all share some properties with the population of “passive red spirals,” identified recently as an interesting set of possible transition objects with disk-like morphologies but red colors, at both lowz (e.g., Wolf et al. 2005,2009; Bamford et al. 2009; Masters et al. 2010)
and highz(e.g., Bundy et al.2010). Statistical analyses on a larger sample from MaNGA(or other IFU surveys)are needed in order to better understand the physical link between our galaxies and the passive/quiescent spiral population.
[image:13.612.54.559.50.206.2]The 2D maps in Figures7and8, as well as the radial profiles in Figures9and11, are in broad agreement with maps/profiles of stellar population age estimated from both CALIFA
Figure 11.Radial profiles of three diagnostic parameters measured for the P-MaNGA galaxies(from left to right): Dn(4000), EW(HδA), and log10EW(Hα). For a
[image:13.612.54.560.244.401.2](González Delgado et al. 2014) and P-MaNGA (Wilkinson et al. 2015), in the sense that most galaxies in the nearby universe showflat to negative gradients in stellar age, although in those studies the detailed behaviors of the age gradients depend on galaxy mass or morphology. In this work we only consider the dependence of our measurements on the Dn(4000)
of the galactic center, which is an indicator of the prominence of stellar populations younger than 1–2 Gyr, rather than the mean stellar age as investigated in those studies. Despite these differences, the IFU-based results obtained so far are all consistent with the“inside-out”growth of galactic disks(White & Frenk1991; Mo et al. 1998), a picture that was supported previously by both numerical simulations (e.g., Brook et al.2006)and abundant studies of broadband color gradients pioneered more than 50 yr ago by Tifft(1963).
3.3. Diagnostic Diagrams of Recent Star Formation History
We now return to the comparison of diagnostic diagrams of recent star formation history, based on the radial profiles obtained in the previous subsection. Figure 12 presents the Dn(4000)versus EW(HδA) (left panels) and EW(HδA)versus
log10EW(Hα) (right panels) planes, with each panel once
again contrasting two galaxies, one CSF system(blue symbols) and one CQ system(red symbols). Panels are ordered such that Dn(4000)increases from top to bottom. For each galaxy, the
radial profiles within the effective radius Re as shown in the
previous figure are plotted here, with larger data points corresponding to larger radii. The set of BC03 models in Figure6 are also repeated here as the solid and dashed lines, but for clarity these lines are not colored; they provide a reference grid to register the relative position of the different radial bins on the diagnostic diagrams.
Both the weak radial variations for CSF galaxies and the strong variations for CQ galaxies are readily apparent in this figure. Comparing the location of the radial bins on the two diagrams, as well as their relative location with respect to the model curves, presents a comprehensive picture of how and where star formation cessation is occurring within the galaxies. The diagrams demonstrate that all the CQ galaxies behave in the same manner: Dn(4000)decreases, while EW(HδA)and
log10EW(Hα)increase, as one moves outward in the galaxies.
This consistency is even clearer in Figure 13, where we overplot the radial profiles of all 12 galaxies in a single set of diagnostic diagrams. The profiles are plotted with cyan triangles for CSF galaxiesand magenta triangles for CQ galaxies. We highlight the two peculiar galaxies discussed above(ma003_9and ma008_4), which show the strongest radial gradients and unusual shape in the profile of log10EW (Hα), by identifying them with yellow triangles. We also pick out the green-valley galaxies (4 < NUV−r < 5) as green triangles. For comparison, the central spaxels are plotted with blue open symbols and redfilledsymbols for the two classes of galaxies. The CQ galaxies indeed follow a tight track on the Dn(4000)versus EW(HδA)plane.
These spatially resolved data, reaching out to Re for all 12
galaxies, also show how the clear distinction between the two classes of galaxies becomes blurred when one also considers their outer parts. Figure13shows that the gaps in the parameter space between the regions occupied by the centers of the galaxies are populated by these same galaxies’outer parts. This continuous sequence forms a tight relation in the Dn(4000)-EW
(HδA)plane, closely following the continuous star formation
models. In detail, though, the intermediate region on the diagrams is mainly occupied by the two galaxies (ma003_9 andma008_4)that have strong radial variations and unusual profiles in log10EW(Hα). In order to see this dominance more
clearly, we have repeated the same panels of Figure 13, but excluding these two systems, and wefind that the gap between the galaxy types once again starts to emerge. It is clear, however, that the CQ galaxies do still extend substantially into the intermediate region, and that the effect appears to be stronger for green-valley galaxies than for the other objects in the CQ galaxy class.
3.4. Notes on Individual Galaxies
ma008_4: This system, CGCG 184–033, is the central galaxy of a group in the catalog of Yang et al.(2007). The system comprises eight member galaxies with spectro-scopically measured redshift from SDSS, including the central galaxy itself. This is the most massive galaxy in the sample with a stellar mass ofM*=2 ´1011M. The SDSS
spectroscopy and the central spaxel of the P-MaNGA datacube reveal that the central region of this galaxy shows relatively strong absorption in Hδfor its EW(Hα), implying that a starburst event has happened within the galaxy in the past 1–2 Gyr. Considering the fact that the galaxy has a very close companion, a strongly star-forming spiral at the same redshift (z = 0.042), the post-starburst feature may be the product of a tidal interaction with the companion, which caused the central part of the galaxy to have ceased star formation recently. The P-MaNGA data also reveal strong radial variation in all the diagnostic parameters in this galaxy: Dn(4000), EW(HδA), and EW(Hα). In particular, the
profile of log10EW(Hα)shows a very strange shape when
compared to the other CQ galaxies.
ma003_9: This galaxy is a spiral with a red core but very blue outer disk in the optical image (see Figure 8). It is classified as a blue-cloud galaxy because of its blue NUV−rcolor, but it is classified as a CQ galaxy due to its large central Dn(4000). The red core with old stellar
populations and a blue global color seems to suggest that the galaxy might be a“Bluedisk”galaxy, a class of system with an unusually high fraction of HIgas mass, as recently studied in detail by Wang et al.(2013). However, the HIgas mass is log10
(
MHI M)
=9.8 according to the HI globalprofile from Huchtmeier & Richter(1989), homogenized in Paturel et al. (2003). This is comparable to the value expected from the NUV−rand stellar surface mass density for a normal spiral (Catinella et al. 2010; Li et al. 2012b). The BPT diagram shown in Figure 1reveals strong nuclear activity in the galactic center. A∼12 mJy source coincident with this galaxy is detected by the NVSS survey (Condon et al.1998), but no source is detected by the FIRST survey
(Becker et al.1995), suggesting that the radio emission from this galaxy is variable. This is consistent with an AGN origin, albeit at a low luminosity (L1.4 GHz~1021.6 W/Hz).
See the related paper by Belfiore et al.(2015)for a spatially resolved BPT diagram of this galaxy, also based on the P-MaNGA data.
ma003_4: This system is one of the two AGNs in the sample (the other one is ma003_9 above). The AGN component is likely responsible for the strange profiles of the log10EW(Hα)diagnostic in these systems, as discussed
ma006_4: With a stellar mass of6.3´109M, this galaxy
is the only low-mass CQ galaxy in the P-MaNGA sample. It has unusually low EW(Hα)for its EW(HδA)(see Figure12).
This might be a metallicity effect, as the galaxy is much closer to the continuous models for a lower metallicity of
Z=0.008.
4. SUMMARY AND DISCUSSION
Using datacubes for 12 galaxies produced during the MaNGA prototype (P-MaNGA) observations, we have obtained maps and radial profiles of the Dn(4000), EW
(HδA), and EW(Hα)spectral diagnostics. These parameters
[image:15.612.89.525.45.597.2]were derived for each spaxel by decomposing the spectrum into
Figure 12. Radial variation of the P-MaNGA galaxies in the plane of Dn(4000)vs. EW(HδA) (left panels)and the plane of EW(HδA)vs. log10EW(Hα) (right
an emission-line component and a continuum plus absorption-line componentand measuring the relevant indices from these separate components. We study the spatially resolved recent star formation histories of these galaxies by displaying their radial profiles on the Dn(4000)versus EW(HδA)and EW
(HδA)versus log10EW(Hα)planes. We have classified the
galaxies as either “CQ” or “CSF” according to the value of Dn(4000)in the central spaxel, and we compare the 2D maps
and radial profiles for the two classes. CQ galaxies present significant radial gradients in all three parameters, in the sense that Dn(4000)decreaseswhile both EW(HδA)and EW
(Hα)increase as one goes from the galactic center toward the outer region. In contrast, CSF galaxies show very weak or no radial variations. The outer parts of the galaxies show greater scatter on the diagnostic diagrams than their central regions. In particular, the separation between CQ and CSF galaxies in these diagnostic planes is largelyfilled in by the outer parts of galaxies whose global colors place them in the green valley.
The three spectral diagnostics are known to be sensitive indicators of stellar populations of different ages. Spatially resolving a galaxy on the Dn(4000)–EW(HδA)–EW
(Hα)diagrams probes the radial variations in recent star formation histories, thus revealing the way in which the galaxy grows and its star formation ceases. When spatially resolved, the P-MaNGA galaxies are found to form a tight sequence on the Dn(4000)versus EW(HδA)plane, although the distribution
of their central regions is strongly bimodal (Figure13). This sequence closely follows the continuous star formation locus predicted by current stellar population modelsand covers a very similar area to the distribution of the large sample of galactic centers from SDSS (Figure2). This relation suggests that, at least for the systems being studied here, galaxy growth has been a smooth processand is likely regulated by a common set of physical drivers. This result is consistent with the“ inside-out”picture of galaxy growth, where the stellar mass assembly starts in the galactic center and gradually extends to the outer regions (White & Frenk 1991; Mo et al. 1998; Brook et al. 2006). In this picture, the shutdown of star formation alsofirst occurs in the central region and slowly propagates out to ever larger radii. However, this result should not be
overemphasized given the small size of our sample. The tight sequence on the Dn(4000)–EW(HδA)diagram might be just a
result of small number statistics. It could also be the case that there are a variety of physical processes behind this sequence, which can be discriminated only when a larger sample becomes available.
Radially resolved stellar populations have been studied previously to some extent, based on multi-wavelength broad-band photometry at both lowz(e.g., de Jong1996; Bell & de Jong 2000; Taylor et al. 2005; Muñoz-Mateos et al. 2007; Zibetti et al.2009; Roche et al.2010; Suh et al.2010; Tortora et al. 2010; Gonzalez-Perez et al. 2011; Tortora et al. 2011; Kauffmann 2015) and highz (e.g., Abraham et al. 1999; Azzollini et al.2009; Szomoru et al.2012; Wuyts et al.2012; Szomoru et al.2013; Wuyts et al.2013), as well as long-slit spectroscopy for nearby galaxies (e.g., Moran et al. 2012; Huang et al. 2013b). Most spirals are found to have stellar population gradients, with the inner regions being older and more metal-rich than their outer regions, supporting the inside-out scenario of disk galaxy formation. The majority of the early-type galaxies show flat color profiles, with only a small fraction being“blue-core”systems with positive color gradients
(i.e., bluer inner parts). The star formation history of galactic disks is found to be primarily driven by its structural properties, as usually quantified by the surface stellar mass density (μ*;
Bell & de Jong 2000) and stellar light concentration
(Gonzalez-Perez et al.2011), while the total stellar mass is a secondary parameter, correlated more closely with metallicity than with age. For massive galaxies, recent short-lived episodes or bursts of star formation occurring in their outer regions are required to interpret the radially resolved spectral indices as measured from long-slit spectroscopy(Huang et al.2013b), a result that is consistent with the existence of many early-type galaxies in the nearby universe that display extended star-forming disks, as originally discovered by ultraviolet imaging
[image:16.612.119.496.50.231.2](e.g., Yi et al.2005; Kauffmann et al.2007; Fang et al.2012). The overall radial dependence of the diagnostic parameters presented in our work is apparently consistent with these previousfindings, although the small sample size doesn’t allow the correlation of the radial profiles with galaxy morphology,
Figure 13.Same as Figure6, except that the radial profiles of the P-MaNGA galaxies are additionally plotted, with magenta(light cyan)triangles for centrally quiescent(star-forming)galaxies. The profile for a given galaxy is connected with a solid line, and the symbols are sized by radius, with larger triangles for larger radii. Plotted in yellow triangles are the two galaxiesma003_9andma008_4, which show the strongest radial gradients and unusual shape in the profile of log10EW
clear evidence of an interaction (Sánchez et al. 2014). This result also supports the inside-out picture for the growth of galactic disksand is consistent with the stellar age and metallicity gradients obtained by Sánchez-Blázquez et al.
(2014) based on CALIFA data for a smaller sample of 62 nearly face-on spirals.
Using a sample of 107 galaxies from CALIFA, González Delgado et al.(2014)performed a detailed study of the radial structure of the stellar mass surface density (μ*) and stellar
population age, as well as their dependence on the total stellar mass and morphology. In support of the inside-out formation picture, negative gradients of the stellar age are present in most of their galaxies. The behaviors of the Dn(4000)profiles in the
P-MaNGA galaxies(see Figure11)are in good agreement with this result, although the Dn(4000)is not a direct measure of
stellar age, but rather an indicator of the prominence of young stellar populations. Confirming the previous broadband photo-metry-basedfindings, the CALIFA data revealthatμ*is more
important thanM*in driving the star formation history in disks,
whileM*plays a more fundamental role in spheroidal systems.
The CALIFA results, together with the results from broadband photometry and long-slit spectroscopy, strongly suggest that galaxy growth and death are driven by multiple parameters(at least the local surface density, total stellar mass, and morphology), and that further studies of much larger samples are needed in order to isolate the role of each parameterand the physical process behind it. The increasing MaNGA sample is expected to provide much better results in the near future.
Another interesting result from our work is that, when spatially resolved, the distribution of galaxies on the diagnostic diagrams is no longer bimodal, and the separation between the CQ and CSF populations isfilled in by those galaxies that are classified as“green-valley”according to their optical/UV color. In a recent complementary study, Mendel et al.(2013)selected from SDSS a large sample of“recently quenched”galaxies that have a significant fraction of young stars within the central 3″ regionand found them to populate the region of green-valley galaxies in Dn(4000)and optical colors, so their central parts
seem to be at the same evolutionary stage as the outer parts of the P-MaNGA galaxies. The two studies combine to suggest that the green valley does, indeed, pick out a transition phase between star-forming and passive populations, but that different parts of different galaxies enter the green valley at different times.
There are a few caveats to this analysis that we will address in future work. We have used relative measurements of
with dominant old stellar populations, OB stars may not be the only source of ionizing photons (e.g., Cid Fernandes et al.2010; Sánchez et al.2014). Indeed, EW(Hα)lower than 6 Å was found to be more compatible with light from post-AGB stars (Papaderos et al. 2013; Sarzi et al. 2013), and it would be interesting to evaluate the contribution of such stars to the emission-line properties of the spectra once a larger sample is available.
In a recent SDSS-based study Kauffmann(2014)has nicely demonstrated that a combination of Dn(4000), EW(HδA), and
the specific SFR (SFR/M*) provides stringent constraints on
the recent star formation histories of the central region of galaxies in the stellar mass range 108–1010M. In particular,
this methodology is powerful in separating out the galaxies with ongoing or past starbursts from those with a continuous star formation history. By applying this new methodology to the spatially resolved spectroscopy for a large sample from MaNGA, we may well expect to better quantify the fractions of the mass produced by ongoing and recent bursts, as well as their radial variation across the whole galaxy, thus leading to more reliable constraints on the maps and radial profiles of the recent star formation history.
Previous studies have proposed a variety of galaxy properties as indicators of the termination of star formation, including both color indices (e.g., NUV−r) and structural parameters like the central surface mass density and stellar velocity dispersion(e.g., Fang et al.2013), the effective radius Reand
the ratio of stellar mass relative to Re, Re2, or Re1.5(e.g., Omand
et al.2014), and Sérsic profile indexn(e.g., Bell2008). Since different indicators may trace different physical processes, it is important to ask which galaxy property is most closely linked to the end of star formation. Again, once larger samples of galaxies become available, it will be very interesting to correlate the kind of spectral diagnostic gradient study presented here with these other parameters, to see which is the trigger, and even how the trigger varies between galaxies of different types or in different environments.
C.L. acknowledges the support of the 100 Talents Program of Chinese Academy of Sciences(CAS). This work is supported by NSFC (11173045,11233005,11325314,11320101002), by the Strategic Priority Research Program “The Emergence of Cosmological Structures” of CAS (grant No. XDB09000000), and by World Premier International Research Center Initiative
(WPI Initiative), MEXT, Japan. We have made use of data from HyperLeda for our work. Funding for SDSS-III and SDSS-IV has been provided by the Alfred P. Sloan Foundation and Participating Institutions. Additional funding for SDSS-III comes from the National Science Foundation and the U.S. Department of Energy Office of Science. Further information about both projects is available atwww.sdss3.org.
SDSS is managed by the Astrophysical Research Con-sortium for the Participating Institutions in both collaborations. In SDSS-III these include the University of Arizona, the Brazilian Participation Group, Brookhaven National Labora-tory, Carnegie Mellon University, University of Florida, the French Participation Group, the German Participation Group, Harvard University, the Instituto de Astrofisica de Canarias, the Michigan State/Notre Dame/JINA Participation Group, Johns Hopkins University, Lawrence Berkeley National Laboratory, Max Planck Institute for Astrophysics, Max Planck Institute for Extraterrestrial Physics, New Mexico State University, New York University, Ohio State University, Pennsylvania State University, University of Portsmouth, Princeton University, the Spanish Participation Group, University of Tokyo, University of Utah, Vanderbilt University, University of Virginia, University of Washington, and Yale University.
The Participating Institutions in SDSS-IV are Carnegie Mellon University, Colorado University, Boulder, Harvard-Smithsonian Center for Astrophysics Participation Group, Johns Hopkins University, Kavli Institute for the Physics and Mathematics of the universe, Max-Planck-Institut fuer Astro-physik(MPA Garching), Max-Planck-Institut fuer Extraterres-trische Physik (MPE), Max-Planck-Institut fuer Astronomie
(MPIA Heidelberg), National Astronomical Observatory of China, New Mexico State University, New York University, The Ohio State University, Penn State University, Shanghai Astronomical Observatory, United Kingdom Participation Group, University of Portsmouth, University of Utah, Uni-versity of Wisconsin, and Yale UniUni-versity.
REFERENCES
Abadi, M. G., Moore, B., & Bower, R. G. 1999,MNRAS,308, 947
Abraham, R. G., Ellis, R. S., Fabian, A. C., Tanvir, N. R., & Glazebrook, K. 1999,MNRAS,303, 641
Azzollini, R., Beckman, J. E., & Trujillo, I. 2009,A&A,501, 119
Bacon, R., Copin, Y., Monnet, G., et al. 2001,MNRAS,326, 23
Baldry, I. K., Glazebrook, K., Brinkmann, J., et al. 2004,ApJ,600, 681
Baldwin, J. A., Phillips, M. M., & Terlevich, R. 1981,PASP,93, 5
Balogh, M. L., Morris, S. L., Yee, H. K. C., Carlberg, R. G., & Ellingson, E. 1999,ApJ,527, 54
Bamford, S. P., Nichol, R. C., Baldry, I. K., et al. 2009,MNRAS,393, 1324
Becker, R. H., White, R. L., & Helfand, D. J. 1995,ApJ,450, 559
Belfiore, F., Maiolino, R., Bundy, K., et al. 2015,MNRAS,449, 867
Bell, E. F. 2008,ApJ,682, 355
Bell, E. F., & de Jong, R. S. 2000,MNRAS,312, 497
Bell, E. F., McIntosh, D. H., Barden, M., et al. 2004,ApJL,600, L11
Bell, E. F., van der Wel, A., Papovich, C., et al. 2012,ApJ,753, 167
Bershady, M. A., Verheijen, M. A. W., Swaters, R. A., et al. 2010, ApJ,
716, 198
Birnboim, Y., & Dekel, A. 2003,MNRAS,345, 349
Blanton, M. R., Eisenstein, D., Hogg, D. W., Schlegel, D. J., & Brinkmann, J. 2005a,ApJ,629, 143
Blanton, M. R., Hogg, D. W., Bahcall, N. A., et al. 2003,ApJ,594, 186
Blanton, M. R., Kazin, E., Muna, D., Weaver, B. A., & Price-Whelan, A. 2011,
AJ,142, 31
Blanton, M. R., Lupton, R. H., Schlegel, D. J., et al. 2005b,ApJ,631, 208
Blanton, M. R., & Roweis, S. 2007,AJ,133, 734
Blumenthal, G. R., Faber, S. M., Primack, J. R., & Rees, M. J. 1984,Natur,
311, 517
Brammer, G. B., Whitaker, K. E., van Dokkum, P. G., et al. 2009,ApJL,
706, L173
Brinchmann, J., Charlot, S., White, S. D. M., et al. 2004,MNRAS,351, 1151
Brook, C. B., Kawata, D., Martel, H., Gibson, B. K., & Bailin, J. 2006,ApJ,
639, 126
Brough, S., Croom, S., Sharp, R., et al. 2013,MNRAS,435, 2903
Bruzual, G., & Charlot, S. 2003,MNRAS,344, 1000
Bundy, K., Bershady, M. A., Law, D. R., et al. 2015,ApJ,798, 7
Bundy, K., Ellis, R. S., Conselice, C. J., et al. 2006,ApJ,651, 120
Bundy, K., Scarlata, C., Carollo, C. M., et al. 2010,ApJ,719, 1969
Cappellari, M., & Copin, Y. 2003,MNRAS,342, 345
Cappellari, M., Emsellem, E., Krajnović, D., et al. 2011,MNRAS,416, 1680
Catinella, B., Schiminovich, D., Kauffmann, G., et al. 2010,MNRAS,403, 683
Cattaneo, A., Dekel, A., Devriendt, J., Guiderdoni, B., & Blaizot, J. 2006,
MNRAS,370, 1651
Chabrier, G. 2003,PASP,115, 763
Cheung, E., Faber, S. M., Koo, D. C., et al. 2012,ApJ,760, 131
Chung, A., van Gorkom, J. H., Kenney, J. D. P., Crowl, H., & Vollmer, B. 2009,AJ,138, 1741
Cid Fernandes, R., Gu, Q., Melnick, J., et al. 2004,MNRAS,355, 273
Cid Fernandes, R., Stasińska, G., Schlickmann, M. S., et al. 2010,MNRAS,
403, 1036
Cirasuolo, M., McLure, R. J., Dunlop, J. S., et al. 2007,MNRAS,380, 585
Colless, M., Dalton, G., Maddox, S., et al. 2001,MNRAS,328, 1039
Condon, J. J., Cotton, W. D., Greisen, E. W., et al. 1998,AJ,115, 1693
Cooper, M. C., Newman, J. A., Weiner, B. J., et al. 2008,MNRAS,383, 1058
Cowie, L. L., & Barger, A. J. 2008,ApJ,686, 72
Croom, S. M., Lawrence, J. S., Bland-Hawthorn, J., et al. 2012,MNRAS,
421, 872
de Jong, R. S. 1996, A&A,313, 377
Dekel, A., & Birnboim, Y. 2006,MNRAS,368, 2
di Matteo, T., Springel, V., & Hernquist, L. 2005,Natur,433, 604
Drory, N., MacDonald, N., Bershady, M. A., et al. 2015,AJ,149, 77
Eisenstein, D. J., Weinberg, D. H., Agol, E., et al. 2011,AJ,142, 72
Fabello, S., Catinella, B., Giovanelli, R., et al. 2011,MNRAS,411, 993
Fabello, S., Kauffmann, G., Catinella, B., et al. 2012,MNRAS,427, 2841
Faber, S. M., Willmer, C. N. A., Wolf, C., et al. 2007,ApJ,665, 265
Fang, J. J., Faber, S. M., Koo, D. C., & Dekel, A. 2013,ApJ,776, 63
Fang, J. J., Faber, S. M., Salim, S., Graves, G. J., & Rich, R. M. 2012,ApJ,
761, 23
Franx, M., van Dokkum, P. G., Schreiber, N. M. F., et al. 2008,ApJ,688, 770
Giovanelli, R., Haynes, M. P., Kent, B. R., et al. 2005,AJ,130, 2598
Gonçalves, T. S., Martin, D. C., Menéndez-Delmestre, K., Wyder, T. K., & Koekemoer, A. 2012,ApJ,759, 67
González Delgado, R. M., Pérez, E., Cid Fernandes, R., et al. 2014,A&A,
562, A47
Gonzalez-Perez, V., Castander, F. J., & Kauffmann, G. 2011, MNRAS,
411, 1151
Gunn, J. E., & Gott, J. R., III 1972,ApJ,176, 1
Hopkins, P. F., Hernquist, L., Cox, T. J., et al. 2006,ApJS,163, 1
Huang, J.-S., Faber, S. M., Willmer, C. N. A., et al. 2013a,ApJ,766, 21
Huang, M.-L., Kauffmann, G., Chen, Y.-M., et al. 2013b,MNRAS,431, 2622
Huchtmeier, W. K., & Richter, O.-G. 1989, A&A,210, 1
Hummer, D. G., & Storey, P. J. 1987,MNRAS,224, 801
Hunter, D. A., & Elmegreen, B. G. 2004,AJ,128, 2170
Kauffmann, G. 2014,MNRAS,441, 2717
Kauffmann, G. 2015, MNRAS, submitted(arXiv:1501.01017)
Kauffmann, G., Heckman, T. M., Budavári, T., et al. 2007,ApJS,173, 357
Kauffmann, G., Heckman, T. M., de Lucia, G., et al. 2006, MNRAS,
367, 1394
Kauffmann, G., Heckman, T. M., Tremonti, C., et al. 2003a, MNRAS,
346, 1055
Kauffmann, G., Heckman, T. M., White, S. D. M., et al. 2003b,MNRAS,
341, 54
Kereš, D., Katz, N., Weinberg, D. H., & Davé, R. 2005,MNRAS,363, 2
Kewley, L. J., Groves, B., Kauffmann, G., & Heckman, T. 2006,MNRAS,
372, 961
Paturel, G., Theureau, G., Bottinelli, L., et al. 2003,A&A,412, 57
Peng, Y.-J., Lilly, S. J., Kovač, K., et al. 2010,ApJ,721, 193
Pérez, E., Cid Fernandes, R., González Delgado, R. M., et al. 2013, ApJL,
764, L1
Rees, M. J., & Ostriker, J. P. 1977,MNRAS,179, 541
Roche, N., Bernardi, M., & Hyde, J. 2010,MNRAS,407, 1231
Sánchez, S. F., Kennicutt, R. C., Gil de Paz, A., et al. 2012a,A&A,538, A8
Sánchez, S. F., Rosales-Ortega, F. F., Marino, R. A., et al. 2012b, A&A,
538, A8
Sánchez, S. F., Rosales-Ortega, F. F., Iglesias-Páramo, J., et al. 2014,A&A,
563, A49
Sánchez-Blázquez, P., Rosales-Ortega, F. F., Méndez-Abreu, J., et al. 2014,
A&A,570, A6
Sarzi, M., Alatalo, K., Blitz, L., et al. 2013,MNRAS,432, 1845
Schawinski, K., Thomas, D., Sarzi, M., et al. 2007,MNRAS,382, 1415
Schawinski, K., Urry, C. M., Simmons, B. D., et al. 2014,MNRAS,440, 889
Schiminovich, D., Wyder, T. K., Martin, D. C., et al. 2007,ApJS,173, 315
Sharp, R., Allen, J. T., Fogarty, L. M. R., et al. 2015,MNRAS,446, 1551
Silk, J. 1977,ApJ,211, 638
Skrutskie, M. F., Cutri, R. M., Stiening, R., et al. 2006,AJ,131, 1163
White, S. D. M., & Frenk, C. S. 1991,ApJ,379, 52
Wilkinson, D. M., Maraston, C., Thomas, D., et al. 2015,MNRAS,449, 328
Williams, R. J., Quadri, R. F., Franx, M., van Dokkum, P., & Labbé, I. 2009,
ApJ,691, 1879
Wisnioski, E., Förster Schreiber, N. M., Wuyts, S., et al. 2015,ApJ,799, 209
Wolf, C., Aragón-Salamanca, A., Balogh, M., et al. 2009, MNRAS,
393, 1302
Wolf, C., Gray, M. E., & Meisenheimer, K. 2005,A&A,443, 435
Worthey, G., & Ottaviani, D. L. 1997,ApJS,111, 377
Wuyts, S., Förster Schreiber, N. M., Genzel, R., et al. 2012,ApJ,753, 114
Wuyts, S., Förster Schreiber, N. M., Nelson, E. J., et al. 2013,ApJ,779, 135
Wyder, T. K., Martin, D. C., Schiminovich, D., et al. 2007,ApJS,173, 293
Yan, R., Tremonti, C., Bershady, M. A., et al. 2015, submitted Yang, X., Mo, H. J., van den Bosch, F. C., et al. 2007,ApJ,671, 153
Yi, S. K., Yoon, S.-J., Kaviraj, S., et al. 2005,ApJL,619, L111
York, D. G., Adelman, J., Anderson, J. E., Jr., et al. 2000,AJ,120, 1579
Zhang, W., Li, C., Kauffmann, G., & Xiao, T. 2013,MNRAS,429, 2191
Zibetti, S., Charlot, S., & Rix, H.-W. 2009,MNRAS,400, 1181
Zwaan, M. A., Meyer, M. J., Staveley-Smith, L., & Webster, R. L. 2005,