This paper is available online free of all access charges (see http://jxb.oxfordjournals.org/open_access.html for further details)
ReseaRch PaPeR
Assessing the influence of the rhizosphere on soil hydraulic
properties using X-ray computed tomography and numerical
modelling
Keith R. Daly1, Sacha J. Mooney2, Malcolm J. Bennett2, Neil M. J. Crout2, Tiina Roose1 and Saoirse R. Tracy2,* 1 Bioengineering Sciences Research Group, Faculty of Engineering and Environment, University of Southampton, University Road,
Southampton SO17 1BJ, UK
2 School of Biosciences, University of Nottingham, Sutton Bonington Campus, Leicestershire LE12 5RD, UK
*To whom correspondence should be addressed. E-mail: saoirse.tracy@nottingham.ac.uk
Received 13 October 2014; Revised 25 November 2014; Accepted 28 November 2014
Abstract
Understanding the dynamics of water distribution in soil is crucial for enhancing our knowledge of managing soil and water resources. The application of X-ray computed tomography (CT) to the plant and soil sciences is now well estab-lished. However, few studies have utilized the technique for visualizing water in soil pore spaces. Here this method is utilized to visualize the water in soil in situ and in three-dimensions at successive reductive matric potentials in bulk and rhizosphere soil. The measurements are combined with numerical modelling to determine the unsaturated hydraulic conductivity, providing a complete picture of the hydraulic properties of the soil. The technique was per-formed on soil cores that were sampled adjacent to established roots (rhizosphere soil) and from soil that had not been influenced by roots (bulk soil). A water release curve was obtained for the different soil types using measurements of their pore geometries derived from CT imaging and verified using conventional methods, such as pressure plates. The water, soil, and air phases from the images were segmented and quantified using image analysis. The water release characteristics obtained for the contrasting soils showed clear differences in hydraulic properties between rhizosphere and bulk soil, especially in clay soil. The data suggest that soils influenced by roots (rhizosphere soil) are less porous due to increased aggregation when compared with bulk soil. The information and insights obtained on the hydraulic properties of rhizosphere and bulk soil will enhance our understanding of rhizosphere biophysics and improve current water uptake models.
Key words: Bulk soil, image-based homogenization, matric potential, rhizosphere, soil pores, water release characteristic, X-ray computed tomography.
Introduction
The concept of the ‘rhizosphere’, proposed by Hiltner (1904), refers to the volume of soil adjacent to a plant root over which the root has influence. The rhizosphere is created from root–soil–microbe interactions and the compression of soil due to root expansion (Dexter, 1987; Whalley et al., 2005;
Aravena et al., 2011, 2014). Soil physical structure affects
root growth; however, in turn, a growing root physically alters the soil structure through the creation of biopores (Stirzaker
et al., 1996), which impact on fluid transport through soil (Angers and Caron, 1998). Root water uptake leads to further soil structural changes through drying which may cause soil shrinkage (Towner and Childs, 1972). The root also secretes
This is an Open Access article distributed under the terms of the Creative Commons Attribution License (http://creativecommons.org/licenses/by/3.0/), which permits unrestricted reuse, distribution, and reproduction in any medium, provided the original work is properly cited.
© The Author 2015. Published by Oxford University Press on behalf of the Society for Experimental Biology.
chemical compounds, referred to as exudates, into the sur-rounding soil. These exudates can be divided into three cat-egories: (i) mucilage, which is usually found at the root tips and consists of polysaccharides and uronic acids; (ii) mol-ecules excreted by the root hairs such as amino acids, organic acids, and simple sugars; and (iii) cellular organic substances produced by root epidermis senescence (Tan, 2000). Gases, including carbon dioxide and methane, are also released from roots, although some researchers (Swinnen et al., 1995;
Grayston et al., 1997) do not define them as exudates as they diffuse into the atmosphere. Aside from the gases released by roots, the remaining exudates constitute a resource that is highly valued by microorganisms, resulting in a much greater diversity of microorganisms in the rhizosphere than in the surrounding bulk soil (Smalla et al., 2001). The microbial community that exists in the rhizosphere results in several dynamic processes, some of which aid nutrient cycling and aggregation of soil particles. The release of root exudates into the soil also changes its chemical and physical characteristics, which enhances microbial growth (Gregory, 2006).
Soil characteristics within the rhizosphere are thought to be markedly different from those of the bulk soil. For example, rhizosphere soil has been shown to contain greater numbers of the largest pore sizes (Whalley et al., 2005) and is generally more acidic than bulk soil, with denitrification being more rapid (Tan, 2000). The hydraulic properties of rhizosphere soil are hypothesized to differ from those of bulk soil; for example, some root exudates cause hydrophobicity of soil particles which affects their wetting ability (Czarnes
et al., 2000). In addition, root exudates act like glue by aid-ing the aggregation of soil particles in the rhizosphere, while also decreasing the wetting rate (Czarnes et al., 2000; Hallett
et al., 2009). This stabilizing effect is enhanced in dry soil in which the viscosity of root exudates is increased (Walker
et al., 2003). Root exudates are also important in maintaining root–soil contact in drying soils. As the soil dries, the surface tension of the exudate decreases, increasing its ability to wet surrounding soil particles (Read and Gregory, 1997). Other studies suggest that rhizosphere soil may be wetter than bulk soil (Young, 1995) due to the formation of a coherent sheath of soil permeated by mucilage and root hairs, known as the rhizosheath (Gregory, 2006). Small quantities of water are released from the root to the rhizosheath at night, while the root absorbs water from the rhizosheath during the day (Walker et al., 2003). The rhizosheath therefore has a signifi-cant effect on soil hydraulic properties, and roots in general modify the soil structure, affecting the water retention capac-ity of soil.
In order to investigate the above effects on the hydrau-lic properties of soil, non-invasive measurements of soil structure are required. There has been significant growth in the use of X-ray computed tomography (CT) as a method to visualize and quantify water flow in soil non-destruc-tively (Crestana et al., 1985; Mooney, 2002; Mooney et al., 2012). Mathematical modelling combined with CT has also been widely used to obtain properties of porous materials based on pore scale geometries (Blunt et al., 2013), and to understand the effect of root-induced compaction using a
Darcy–Richards’ formulation (Aravena et al., 2011, 2014). Recently, Tracy et al. (2015) combined CT imaging and image-based quantification with numerical modelling (Pavliotis and Stuart, 2008; Daly and Roose, 2014) to calculate the hydraulic conductivity of soil using direct measurements of soil pore structure under a range of different saturation conditions.
Here the application of this method to quantify water distri-bution in soil pores for bulk and rhizosphere soil in contrast-ing soil textures is demonstrated. By combincontrast-ing CT imagcontrast-ing with mathematical modelling and up-scaling techniques, it is possible to determine the effect of a living root system on shaping the soil structure (i.e. rhizosphere morphology) on the hydraulic and structural properties of soil under a range of different saturation conditions.
Materials and methods
Sample preparationSoil was obtained from the University of Nottingham farm at Bunny, Nottinghamshire, UK (52.52°N, 1.07°W). The soils used in this study were a Eutric Cambisol (Newport series, loamy sand/ sandy loam) and an Argillic Pelosol (Worcester series, clay loam). Particle size analysis for the two soils was: 83% sand, 13% clay, and 4% silt for the Newport series; and 36% sand, 33% clay, and 31% silt for the Worcester series. Typical organic matter contents were 2.3% for the Newport series and 5.5% for the Worcester series (Mooney and Morris, 2008). Loose soil was collected from each site in sample bags, sieved to <2 mm, and packed into columns (120 mm height, 60 mm diameter) at a bulk density of 1.2 Mg m–3. The soil was mixed
to distribute the different sized soil particles evenly before pouring it in small quantities into the columns. After compacting each layer, the surface was lightly scarified to ensure homogeneous packing and hydraulic continuity within the column (Lewis and Sjostrom, 2010). The soil columns were saturated slowly by wetting from the base for 12 h and allowed to drain freely for 48 h. All columns were weighed and maintained at this weight throughout the experiment by adding the required volume of water daily to the top of the col-umn to ensure soil moisture content remained near a notional field capacity. Half the columns were planted with a single wheat seed (cv. Zebedee) and grown for 4 weeks in a growth room, 16 h day/8 h night, day temperature 24 ºC, night temperature 18 ºC, 50% humid-ity. At the end of the growth period, small soil cores (10 mm height, 10 mm diameter) were carefully excavated from the centre of the soil columns. The columns that contained a plant were considered to have developed a rhizosphere, while those without were consid-ered to contain only bulk soil. The samples were then CT scanned (below). Saturated hydraulic conductivity measurements of all cores were obtained using a constant head device (Rowell, 1994), for com-parison with the model-derived values.
Soil water release characteristic (WRC)
potential the soil core inside the chamber was scanned. After each scan, the soil core was removed from the chamber and weighed to calculate water content.
To obtain a conventional WRC for both soils, a pressure plate Model 1600 Pressure Plate Extractor (Soil Moisture Corp) was used. The soil core samples were placed on the plate and weighed frequently until equilibrated at each matric potential. After the final measurement, the samples were oven dried at 105 °C for 24 h then weighed.
X-ray computed tomography
Three replicate cores from each treatment (bulk or rhizosphere soil) and soil type (sand or clay) of the cores were scanned at the seven matric potentials (0 to –75 kPa) giving a total of 84 scans. X-ray CT scanning was performed using a Phoenix Nanotom 180NF (GE Sensing & Inspection Technologies GmbH, Wunstorf, Germany). The scanner consisted of a 180 kV nanofocus X-ray tube fitted with a diamond transmission target and a five megapixel (2316 × 2316 pixels) flat panel detector (Hamamatsu Photonics KK, Shizuoka, Japan). A maximum X-ray energy of 100 kV and 140 μA was used to scan each soil core. A total of 1440 projection images were acquired over a 360° rotation. Each projection was the average of three images acquired with a detector exposure time of 1 s. The resulting isotropic voxel edge length was 10.17 μm and total scan time was 105 min per core. Although much faster scan times are possible, it was necessary in this instance to use a longer scan time to acquire the highest quality images to aid with the phase separation of the different soil constituents. Two small aluminium and copper refer-ence objects (<1 mm2) were attached to the side of the soil core to
assist with image calibration and alignment during image analysis. Reconstruction of the projection images to produce three-dimen-sional (3D) volumetric data sets was performed using the software datos|rec (GE Sensing & Inspection Technologies GmbH).
The reconstructed CT volumes were visualized and quantified using VG StudioMAX® 2.2 (Volume Graphics GmbH, Heidelberg,
Germany). Air, soil, and water phases of the scanned volumes were segmented using a threshold technique based on measurements from two reference objects, which were included in each scan; one contained a soil pore water sample and the other finely sieved soil (<100 μm). The definition of the phases was based on their differ-ences in X-ray attenuation which are represented as greyscale values in the reconstructed CT volumes. This process is described further in Tracy et al. (2015). Image stacks of the extracted volumes for each phase were exported and subsequently analysed for individual pore characteristics using ImageJ v1.42 (http://rsbweb.nih.gov/ij/ docs/user-guide.pdf) (Ferreira and Rasband, 2011). For 2D analy-sis, objects less than two pixels (twice the resolution) in diameter (0.02 mm) and for 3D analysis objects less than two voxels in each direction (8 × 10⁻⁶ mm3) were considered as potential noise as a
pre-caution (Wildenschild et al., 2005), and subsequently excluded from the analysis.
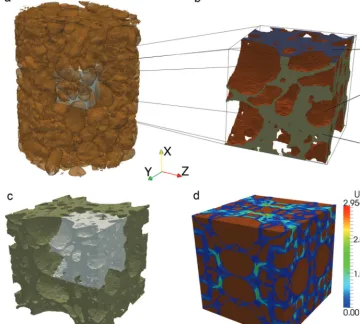
In order for the geometries of the water-filled pores (WFPs) to be modelled, surface mesh files (.stl) were required; which were generated in VG StudioMax v2.2. After segmentation of the soil water phase, a cube-shaped region of interest (ROI) template was imported. Each sample was subsampled, from random initial co-ordinates, with six cubes comprising side lengths of 3.8 mm, giving an overall cube volume of Vm=54.9 mm3 (Fig. 1). The same
co-ordi-nates were used for different matric potentials of the same sample.
Numerical modelling
To understand the differences between the properties of the rhizos-phere and bulk soils, the hydraulic conductivity is calculated using the method of homogenization (Pavliotis and Stuart, 2008). This technique enables Darcy’s law to be derived from Stokes’ equations for fluid flow and, through a mathematically rigorous up-scaling, the hydraulic conductivity to be calculated based on a representative elementary volume (REV). Full details of the scaling and resulting
equations can be found in Daly and Roose (2014) and Hornung (1997). Further discussion of the assumptions used and their appli-cability in this context are described in Tracy et al. (2015). Here the underlying assumptions, the method, and resulting equations are summarized.
There are several key assumptions that are made in order to develop the model. First it is observed that for typical pore sizes the viscous forces dominate the flow properties (Fowler, 1997). Hence, the Stokes limit of the Navier–Stokes equations where all inertial terms are neglected may be considered. Secondly, it is required that the soil structure is periodic (i.e. it is made up of regularly repeating units and, hence, a single one of these units is representative of the overall soil properties). Clearly for real soil samples this is not the case, and an apparent, image-based, periodicity is enforced by reflec-tion of the REV (Fig. 1). The error induced by enforcing periodic-ity is that the geometry considered numerically is now fully periodic rather than quasi-periodic and does not truly represent the imaged soil structure. To overcome this, different size REVs were taken from the segmented *.stl files.
The REVs sampled from the six cubes were of volume, V=Vm/2j,
where j is a positive integer in the range 0–8 such that the smallest volume considered is 0.2 mm3 and the largest is Vm. As j is decreased
and, hence, the size of the REV is increased, the relative size of the errors induced by the reflection decreases. Similarly as the REV size increases, the hydraulic properties of the subsample will, in princi-ple, converge to the hydraulic properties of the soil. Finally, as it is possible to segment the air and water separately from the CT scan image of the soil structure, the fluid dynamics can be greatly simpli-fied. Rather than consider the moving interface between each phase, the relatively slow flow of water about a fixed interface is consid-ered. The equations are further simplified by assuming that the non-wetting phase, in this case air, is stationary. If this is not the case, then the movement of the air effectively lubricates the movement of water, resulting in an increase in the hydraulic conductivity. This approach is valid assuming first that the pressure gradients are suf-ficiently low that the interface remains fixed and secondly that the wetting phase is not connected and, hence, the trapped non-wetting phase has zero average velocity.
After a rigorous mathematical analysis of Stokes equations, it was possible to derive Darcy’s law which is valid for the bulk or rhizos-phere soil and describes fluid driven by an external pressure gradi-ent (see Hornung, 1997; Daly and Roose, 2014;). The average water velocity u is given by
u= −K∇p∇ 0−ρgez, (1)
where ρ is the fluid density (ρ =103 kg m−3
in the case of water),
g=9 8. m s−2
is the acceleration due to gravity, p0 is the applied pressure, and K is the relative permeability (in the general case a tensor) which has components defined as
Kjk y j k L
dy
w
= 2
∫
⋅ µ Ωe νν . (2)
Here, ej for j x y z= , , is a unit vector in the j-th direction, µ is
the viscosity (µ =10−3 kg m− −1s1 in the case of water), L y is the
length of the REV, and ννk is the local velocity. The hydraulic
con-ductivity is defined as the average water velocity driven by grav-ity. Assuming that the air velocity is slower than the water velocity, local ‘corrector’ velocity ννk satisfies the following set of equations
which are solved on a single REV a single time to parameterize Equation 2,
∇2νν νν 0 ∈Ω
ννk=0, x∈Γ, (3b)
πk k
k k j k k
x j k x
= ∂
∂ ⋅ = ⋅ = ≠ ∈
0, e v 0,e v 0, , x Γ , (3c)
∂
∂ =
∂
∂ ⋅ = ⋅ = ≠ ≠ ∈
πk
j p
p k j k j
x 0, x e v 0,e v 0,p k p, j, x Γx, (3d)
where πk is the local pressure correction due to the microscale geometry, Ωw is the water domain, Γxk is the boundary located
at xk=0 , xk=1 2/ , Γxj is the union of the boundaries located
at xj =0 , and xj =1 2/ for j k≠ , and Γ is the union of the soil–
water interface and the air–water interface (Fig. 1). Physically this problem in Equations 3a–3d can be thought of as calculating the fluid velocity subject to a unit pressure gradient in the direction of
ˆ
ek. As the equations are linear, Darcy’s law follows by multiplying
the resulting solution by the pressure gradient.
Equations 3 were solved numerically on each subsample obtained from the CT images. The equations were solved using OpenFOAM, an open source Computational Fluid Dynamics toolbox running on IRIDIS, the High Performance Computing Facility at the University of Southampton. The result is a set of hydraulic conduc-tivity calculations that converge to the true hydraulic conducconduc-tivity of the soil, at each point along the WRC, as the subvolume size is increased.
To quantify the results further, the van Genuchten model for the WRC and the unsaturated hydraulic conductivity (van Genuchten,
1980) was fitted to the calculated values using a non-linear least squares method. The volumetric water content θ is given by
θ θ θ
α θ
= −
+
( )
+
( s r) n ,
m
r h 1
1 (4)
where θs and θr are the saturated and residual volumetric water content respectively, h is the hydraulic head, m= −1 1 /n, and
n and α are the van Genuchten parameters. The corresponding hydraulic conductivity is given by K=K ksat rvg. Here Ksat is the
saturated hydraulic conductivity, and the relative hydraulic conduc-tivity is given by
k
h h
h rvg
n n m
n m
= −
( )
+( )
{
}
+
( )
− −
1 1
1
1 2
2
α α
α / . (5)
θr is taken to be negligible and the remaining parameters were fit to the imaged data.
Statistical analysis
[image:4.626.121.482.43.368.2]The results obtained directly from the CT images were analysed by general analysis of variance (ANOVA) containing soil type and mat-ric potential and all possible interactions as explanatory variables using Genstat 15.1 (VSN International, UK). The probability of significance P, with a threshold value of (P<0.05), corresponding to a 95% confidence limit, was calculated and is used as a measure of significance of the results obtained.
Fig. 1. Schematic showing (a) subsampling of segmented volume, (b) subsampled geometry with boundaries Γxk, Γxj, and Γ for k=1, (c) the resulting
Results and Discussion
Hydraulic propertiesThe WRC was obtained via conventional methods and the imaging method (Fig. 2) for bulk and rhizosphere soil in the two soil textures. Despite the differences between the meth-ods, the image-based approach does capture the differences between the bulk and rhizosphere soils. For both soil types, more water is retained in the bulk soil than within the rhizo-sphere (Fig. 2). Measured in the conventional way, this trend is observable for both the sand and clay soils. However, using the imaging method, only the clay soil shows a significant dif-ference between the bulk and rhizosphere soils. In general, the imaging method provides a good estimate of the volu-metric water content at 0 kPa. The method performs less well and provides a noticeable overestimate at more negative matric potentials, compared with the conventional method. The result is that the slope of the WRC with matric potential, which is a key parameter in Darcy–Richards’ flow models (Hornung, 1997), is underestimated.
From the conventionally measured WRC, it can be seen that the bulk clay soil responded the least to a decrease in matric potential (Fig. 2). The volumetric water content at saturation was high and the soil retained the majority of this water across the matric potential range. The rhizosphere clay soil behaved similarly to the bulk clay soil. However, the ini-tial drainage of the soil from saturation to –30 kPa was much steeper and the resulting volumetric water content was lower compared with the bulk clay soil. The sand soils drained to
lower volumetric water contents compared with the clay soils (Fig. 2). The rhizosphere sand responded strongly to the decreased matric potential, losing almost half of its water content by –30 kPa. The bulk sand showed an initial lag in drainage; however, by –30 kPa, the volumetric water content was similar to that of rhizosphere sand. It would appear that the bulk sand soil required a slightly lower matric potential (more than –10 kPa) for drainage to occur compared with rhizosphere sand. The differences observed in the WRC between the bulk and rhizosphere soils were most significant for matric potentials less than –10 kPa for the sand soil and –20 kPa for the clay soil. Hence, there is a significant differ-ence between the behaviour of the different soil types at –30 kPa, a typical field capacity (Richards and Weaver, 1944). These trends are also observed in the imaged data (Fig. 2), although the differences between the different soils are less significant.
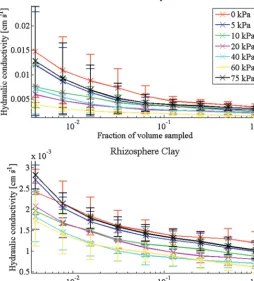
The trends in the WRC are supported in the hydraulic con-ductivity predictions (Fig. 3). For all soils, the value of the hydraulic conductivity is seen to converge approximately to a fixed value as the REV size is increased (Figs 4, 5). It should be noted that the negative values obtained for low REV size in
Fig. 5 do not correspond to a negative hydraulic conductivity. Rather these values tell us that with a REV this small the aver-age hydraulic conductivity is smaller than the standard devia-tion and there is no correladevia-tion between the values obtained. As the size of the REV is increased, the correlation increases
Fig. 2. Water release characteristic of the sand and clay bulk and rhizosphere soils for the conventional and imaging methods. (This figure is available in colour at JXB online.)
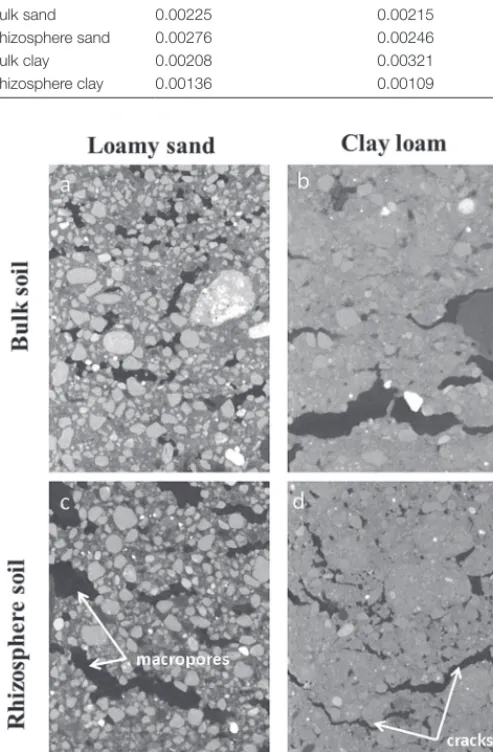
and all values become positive. The predicted hydraulic con-ductivity values are seen to compare with reasonable accuracy with the measured value at 0 kPa (Table 1). Here there is a significant difference observed between the bulk and rhizos-phere hydraulic conductivities for the clay soil and relatively little difference for the sand soil. The sizeable error bars in these figures are attributed to natural variation in the soil samples that can occur even in repacked soil samples. Despite these variations, it is clear that there is a measurable differ-ence between the calculated hydraulic conductivity of the bulk and rhizosphere soils. The calculated hydraulic conductivity for the bulk clay soil is quite high and corresponds to a high number of macropores and cracks (Figs. 6, 7). It is here that the differences in bulk and rhizosphere soil can be most clearly observed as the rhizosphere clay soil has the lowest hydraulic conductivity of the soils considered. In the clay soil, a bimodal distribution of pores was observed after successive wetting and drying cycles (Peng et al., 2007); the pore sizes consist of a large number of subresolution micropores and a smaller num-ber of large cracks and macropores (Fig. 6). The large reduc-tion in hydraulic conductivity seen in the clay soil is related to a reduction in the diameter of the pores which contribute significantly to the hydraulic conductivity as the soil drains. This supports the hypothesis that one of the main effects of root exudates is to aid aggregation, reducing the overall macr-oporosity. In the case of the sand soil, there is a wider range of pore sizes. Hence, the root system has a significantly smaller
effect on the overall soil pore size range. In summary, the macroporosity may decrease but, due to the wider range of pore sizes, this has less effect on the overall hydraulic conduc-tivity. Alternatively, the main differences in soil structure may be occurring below the resolution of the CT images.
The van Genuchten curves were fitted to the calculated hydraulic conductivity (Fig. 3) and the imaged WRC (Fig. 2). The resulting parameter values are given in Table 1. The curves are seen to fit the hydraulic conductivity well for all cases. The WRC fit is less favourable, with the slope of the van Genuchten curves for both the sand and clay being underpredicted. In the case of the clay soil, the comparison is reasonable with a slight underprediction of the volumetric water content at low matric potentials. However, in the case of the sand soil, the fit is less good. This suggests that there may be significant subresolution processes occurring which it was not possible to detect.
[image:6.626.215.550.39.334.2]The results indicate that sand soil responded to the change in pore water pressure more than the associated clay soil, leading to a reduced volumetric water content compared with clay soil. While the differences were not as great as expected, this trend could be predicted due to the dominant particle size for the respective soils (i.e. the water in the clay soil is retained in the predominantly smaller pores). The clearest difference observed from the WRC, measured in the conven-tional way, was the variation in drainage between the bulk and rhizosphere soils. The presence of a higher percentage
[image:6.626.43.298.46.327.2]Fig. 4. Convergence plots for clay soil. For each case (rhizosphere and bulk), three samples were taken. From each of these, six subsamples were obtained. These plots show the average and standard deviation over the 18 subsamples for increasing subsample size. (This figure is available in colour at JXB online.)
of clay in the clay soil meant that the soil structure is more prone to structural change, for example shrinkage, as the soil drained. Hence, the reason for the greater difference in the clay soil between the bulk and rhizosphere soil may be that the additions of root exudates and possible enhanced micro-bial activity in the rhizosphere soil intensified the aggregate formation process (Helliwell et al., 2014). This effect may not have been seen as strongly in the sand soil, as this soil only had an average clay content of 13% and previous research suggests that a >12% clay content is required for aggregate formation in natural soils (Horn and Smucker, 2005). This result highlights that any ‘rhizosphere effect’ may be exhib-ited more strongly in soils with a high clay content and illus-trates the requirement for studies that utilize contrasting soil textures as the majority of previous bulk and rhizosphere soil research focused on a single soil texture (Czarnes et al., 2000;
Smalla et al., 2001; Whalley et al., 2005). As the clay soil exhibited large-scale changes in both porosity and volumet-ric water content, there must be significant large-scale struc-tural changes occurring brought about by the rhizosphere. The data suggest that, in the clay soil, the main effect of the root is to reduce the porosity through densification (Dexter, 1988) (Fig. 6) and decrease the rate of drainage (Fig. 2). In the sand soil, the main observed difference is an increase in drainage (Fig. 2), with little observable effect on the hydraulic conductivity. This suggests that, in addition to the increased aggregation in the clay soil, additional effects are occurring in the rhizosphere to alter the ability of the soil to retain water.
Soil pore characteristics
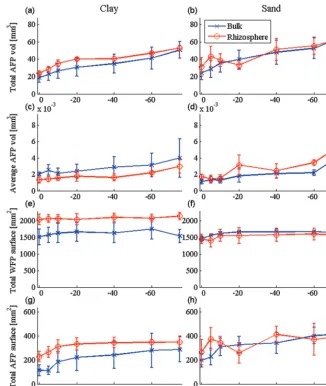
In order to quantify the global air and water content per sample by imaging, air-filled pores (AFPs) and WFPs are defined as single connected regions of air or water, respec-tively. The pore space is also defined as the union of all the AFPs and WFPs. In addition, individual pores within the soil are referred to as simple connected pathways between two distinct points within the pore space. Typically, the pore space contained a single large WFP that contains >50% of the water within the pore space and a large number of much smaller AFPs and WFPs. The connected WFPs are the main contributor to both the WRC and the hydraulic conductivity calculations, and the WFP volume is analogous to the volu-metric water content (Fig, 2). However, further insight may be gained into the wetting and drying behaviour of the soils by considering the properties of the AFPs and the total WFP surface area.
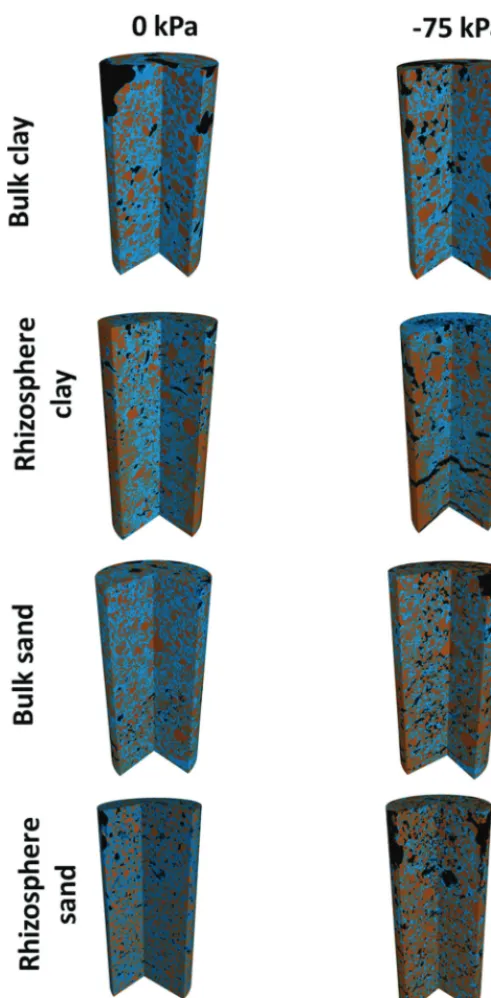
The water-filled porosity decreased with decreasing mat-ric potential (Figs 2, 7; P<0.001). There were no significant differences between total WFP in bulk and rhizosphere soil for both soil types. Previous work by Whalley et al. (2005)
found that bulk and rhizosphere soils had similar porosities, but contrasting structures, which altered the water reten-tion characteristics. The overall proporreten-tion of WFP space reduced by a total of 14% in bulk clay, 26% in bulk sand, 16% in rhizosphere clay, and 30% in rhizosphere sand soil from 0 to –75 kPa. The total volume of AFP space increased sig-nificantly (Figs. 7, 8; P<0.001) with decreasing matric poten-tial from saturation (0 kPa). The rhizosphere soil contained larger quantities of AFPs (82.3 mm3) compared with bulk soil
(69.5 mm3), but the difference was not significant. At 0 kPa
the average AFP volume was 45 mm3 for clay and 51 mm3 for
sand; this increased to just 87 mm3 in clay and 101 mm3 in
[image:7.626.51.560.71.135.2]sand (Fig. 8; P<0.001). There were no significant differences
Table 1. Calculated and measured saturated hydraulic conductivity values and the van Genuchten parameters used to fit the calculated data
Soil Measured Ksat (cm s–1) Calculated Ksat (cm s–1) Saturated volumetric water content θ
s α (cm–1) N
Bulk sand 0.00225 0.00215 0.458 0.052 1.65
Rhizosphere sand 0.00276 0.00246 0.450 0.064 1.77
Bulk clay 0.00208 0.00321 0.494 0.032 1.75
Rhizosphere clay 0.00136 0.00109 0.446 0.051 1.98
[image:7.626.42.289.91.467.2]between the average volumes of the individual AFPs at the different matric potentials or soil types.
The total surface area of the WFPs generally increased as the matric potential decreased (Fig. 8; P<0.001). This trend was observed for all treatments. Rhizosphere soil had a greater total WFP surface area (1804 mm2) compared with
bulk soil (1616 mm2), although the difference was not
signifi-cant. The total WFP surface area was 1618 mm2 in bulk clay
and 2079 mm2 in rhizosphere clay, 1615 mm2 in bulk sand, and
1529 mm2 in rhizosphere sand. Although the total volume of
WFPs decreased as matric potential decreased (Fig. 2), the
surface area increased across successive draining (until –60 kPa). Hence, as the size of the WFPs decreased due to drain-age they remained adhesively attached to the soil interface, forming thin connected films of water that facilitated flow throughout the pore space. This would have biological advan-tages for the growing root system as the surface area availa-ble for water uptake remains high, although water quantities are reduced (Hillel, 1998). This may sustain a growing plant in short-term dry spells between rainfall events (Hunt, 2007). The total surface area of AFPs also increased with decreasing matric potential (Fig. 8; P<0.001). There were no significant differences between soil types (sand and clay soil) for the sur-face area of AFPs, but the interaction between soil category (bulk and rhizosphere soil) and matric potential was signifi-cant (P<0.01). Specifically, the bulk soil AFP space at 0 kPa has a much smaller total surface area (156 mm2) compared
with rhizosphere soil (373 mm2). As the soil dried to –75 kPa,
the resulting AFP space greatly increased to 354 mm2 (56%
increase) in bulk soil and to 373 mm2 (34 % increase) in
rhizo-sphere soil. The average surface area for AFP space was larger in the sand (0.0171 mm2) compared with the clay (0.0168 mm2).
Conclusions
Here a combination of traditional and novel image-based tech-niques was used to investigate the effect of rhizosphere forma-tion on soil hydraulic properties. The latter technique employed CT and image-based modelling using homogenization theory. This has the main advantage that it provides a method that can be used to derive Darcy’s law and the corresponding unsatu-rated hydraulic conductivity through a representative cell prob-lem. The image-based method was also shown to capture the salient features of the WRC including the pore size and con-nectivity, which could be viewed and quantified in 3D across the successive drying matric potentials, therefore providing geometrical detail not possible by other methods. However, the image-based method tends to overestimate the volumetric water content at lower matric potentials, which can be attrib-uted to possible partial volume effects and the chosen image resolution. As the matric potential is made increasingly nega-tive, the water saturation decreases and the majority of water is trapped in smaller pores. Once these pores become compa-rable with or smaller than the resolution of the imaging tech-nique, it is impossible to distinguish the difference between air and water and the method becomes less reliable. This trend is observable in both the image-based WRC and the unsaturated hydraulic conductivity. Higher resolutions are achievable by X-ray CT than used in this study, although this comes at the expense of smaller sample sizes. As this is also not desirable, a trade-off must be made between sample sizes and image resolution. Hence, a more favourable comparison between the imaging and conventional methods could be obtained through high resolution imaging of specific ROIs.
[image:8.626.42.288.29.528.2]A decrease in the ability of the rhizosphere to retain water was observed; that is, the volumetric water content of the rhizosphere is lower than that of the bulk soil. When the rhizosphere forms, the hydraulic conductivity is seen to decrease significantly as the volumetric water content also
decreases. This suggests that rhizosphere formation acts to reduce the soil macroporosity through densification of soil by root action, although this was soil texture dependent (Dexter, 1987; Whalley et al., 2005; Aravena et al., 2011, 2014). This rearrangement of pore geometries by the active root system is likely to have significant implications for key processes such as water and nutrient uptake. These results provide insight into the formation of the rhizosphere in contrasting soil types. Combining this with improved numerical models which cap-ture the dynamics of the fluid–fluid interface and advanced up-scaling techniques will provide a much more detailed picture of air and water movement in soil. The information and insights obtained on the hydraulic properties of rhizos-phere and bulk soil in contrasting soil textures will enhance our understanding of rhizosphere biophysics and provide the means to improve current and future water uptake models.
Acknowledgements
The authors acknowledge the use of the IRIDIS High Performance Computing Facility, and associated support services at the University of Southampton, in the completion of this work. This project was funded by
BBSRC BB/J000868/1, a collaborative project between Southampton and Nottingham; TR is the principal investigator and and overall lead.
References
Angers D, Caron J. 1998. Plant-induced changes in soil structure: processes and feedbacks. In: Van Breemen N, ed. Plant-induced soil changes: processes and feedbacks , Vol. 4. Dordrecht, The Netherlands: Springer, 55–72.
Aravena JE, Berli M, Ghezzehei TA, Tyler SW. 2011. Effects of root-induced compaction on rhizosphere hydraulic properties—X-ray microtomography imaging and numerical simulations. Environmental Science and Technology45, 425–431.
Aravena JE, Berli M, Ruiz S, Suárez F, Ghezzehei TA, Tyler SW. 2014. Quantifying coupled deformation and water flow in the rhizosphere using X-ray microtomography and numerical simulations. Plant and Soil376, 95–110.
Blunt MJ, Bijeljic B, Dong H, Gharbi O, Iglauer S, Mostaghimi P, Paluszny A, Pentland C. 2013. Pore-scale imaging and modelling.
Advances in Water Resources51, 197–216.
Crestana S, Mascarenhas S, Pozzi-Mucelli R. 1985. Static and dynamic three-dimensional studies of water in soil using computed tomographic scanning Soil Science140, 326–332.
Czarnes S, Hallett PD, Bengough AG, Young IM. 2000. Root- and microbial-derived mucilages affect soil structure and water transport.
[image:9.626.136.462.32.418.2]European Journal of Soil Science51, 435–443.
Daly KR, Roose T. 2014. Multiscale modelling of hydraulic conductivity in vuggy porous media. Proceedings of the Royal Society A: Mathematical, Physical and Engineering Science470, 20130383.
Dexter AR. 1987. Compression of soil around roots. Plant and Soil97,
401–406.
Dexter AR. 1988. Advances in characterization of soil structure. Soil and Tillage Research11, 199–238.
Ferreira TAWR, Rasband W. 2011. The ImageJ User Guide, Version 1.45, http://imagej.nih.gov/ij/docs/user-guide-A4booklet.pdf.
Fowler AC. 1997. Mathematical models in the applied sciences. Cambridge: Cambridge University Press.
Grayston SJ, Vaughan D, Jones D. 1997. Rhizosphere carbon flow in trees, in comparison with annual plants: the importance of root exudation and its impact on microbial activity and nutrient availability. Applied Soil Ecology5,
29–56.
Gregory PJ. 2006. Roots, rhizosphere and soil: the route to a better understanding of soil science? European Journal of Soil Science57, 2–12.
Hallett P, Feeney D, Bengough A, Rillig M, Scrimgeour C, Young I.
2009. Disentangling the impact of AM fungi versus roots on soil structure and water transport. Plant and Soil314, 183–196.
Helliwell JR, Miller AJ, Whalley WR, Mooney SJ, Sturrock CJ. 2014. Quantifying the impact of microbes on soil structural development and behaviour in wet soils. Soil Biology and Biochemistry74, 138–147.
Hillel D. 1998. Environmental soil physics. San Diego: Academic Press.
Hiltner L. 1904. Ueber neuere Erfahrungen und Probleme auf dem Gebiete der Bodenbakteriologie unter besonderer Beruecksichtigung der Gruenduengung und Brache. Arbeiten der Deutschen Landwirtschaftlichen Gesellschaft98, 59–78.
Horn R, Smucker A. 2005. Structure formation and its consequences for gas and water transport in unsaturated arable and forest soils. Soil and Tillage Research82, 5–14.
Hornung U. 1997. Homogenization and porous media. Berlin: Springer.
Hunt CE. 2007. Thirsty planet: strategies for sustainable water management. Academic Foundation.
Lewis J, Sjostrom J. 2010. Optimizing the experimental design of soil columns in saturated and unsaturated transport experiments. Journal of Contaminant Hydrology115, 1–13.
Mooney SJ. 2002. Three-dimensional visualization and quantification of soil macroporosity and water flow patterns using computed tomography.
Soil Use and Management18, 142–151.
Mooney SJ, Morris C. 2008. A morphological approach to
understanding preferential flow using image analysis with dye tracers and X-ray computed tomography. CATENA73, 204–211.
Mooney SJ, Pridmore TP, Helliwell J, Bennett MJ. 2012. Developing X-ray computed tomography to non-invasively image 3-D root systems architecture in soil. Plant and Soil352, 1–22.
Pavliotis G, Stuart A. 2008. Multiscale methods: averaging and homogenization. Berlin: Springer.
Peng X, Horn R, Smucker A. 2007. Pore shrinkage dependency of inorganic and organic soils on wetting and drying cycles. Soil Science Society of America Journal71, 1095–1104.
Read DB, Gregory PJ. 1997. Surface tension and viscosity of axenic maize and lupin root mucilages. New Phytologist137,
623–628.
Richards L, Weaver L. 1944. Moisture retention by some irrigated soils as related to soil moisture tension. Journal of Agricultural Research69,
215–235.
Rowell DL. 1994. Soil science: methods and applications. Longman Scientific & Technical; Prentice Hall.
Smalla K, Wieland G, Buchner A, Zock A, Parzy J, Kaiser S, Roskot N, Heuer H, Berg G. 2001. Bulk and rhizosphere soil bacterial communities studied by denaturing gradient gel electrophoresis: plant-dependent enrichment and seasonal shifts revealed. Applied and Environmental Microbiology67, 4742–4751.
Stirzaker RJ, Passioura JB, Wilms Y. 1996. Soil structure and plant growth: impact of bulk density and biopores. Plant and Soil185,
151–162.
Swinnen J, Vanveen JA, Merckx R. 1995. Carbon fluxes in the rhizosphere of winter-wheat and spring barley with conventional vs integrated farming. Soil Biology and Biochemistry27, 811–820.
Tan KH. 2000. Environmental soil sciencew New York: Marcel Dekker, Inc.
Towner GD, Childs EC. 1972. The mechanical strength of unsaturated porous granular material Journal of Soil Science23, 481–498.
Tracy S, Daly K, Sturrock C, Crout N, Mooney S, Roose T. 2015. Three dimensional quantification of soil hydraulic properties using X-ray computed tomography and image based modelling. Water Resources Research15, doi:10.1002/2014WR016020.
van Genuchten MT. 1980. A closed-form equation for predicting the hydraulic conductivity of unsaturated soils. Soil Science Society of America Journal44, 892–898.
Walker TS, Bais HP, Grotewold E, Vivanco JM. 2003. Root exudation and rhizosphere biology. Plant Physiology132, 44–51.
Whalley WR, Riseley B, Leeds-Harrison PB, Bird NRA, Leech PK, Adderley WP. 2005. Structural differences between bulk and rhizosphere soil. European Journal of Soil Science56, 353–360.
Wildenschild D, Hopmans JW, Rivers ML, Kent AJR. 2005. Quantitative analysis of flow processes in a sand using synchrotron-based X-ray microtomography. Vadose Zone Journal4, 112–126.
Young IM. 1995. Variation in moisture contents between bulk soil and the rhizosheath of wheat (Triticum-aestivum L cv Wembley).. New Phytologist