An Assessment of the Population of
Cotton-Top Tamarins (Saguinus oedipus) and Their
Habitat in Colombia
Anne Savage1*, Len Thomas2, Katie L. Feilen1, Darren Kidney2, Luis H. Soto3, Mackenzie Pearson1, Felix S. Medina3, German Emeris3, Rosamira R. Guillen3
1 Conservation Department, Disney’s Animals, Science and Environment, Lake Buena Vista, FL United
States of America, 2 Centre for Research into Ecological and Environmental Modelling and School of Mathematics and Statistics, University of St. Andrews, St. Andrews, Scotland, United Kingdom, 3 Fundacio´n Proyecto Titı´, Barranquilla, Colombia
*Anne.Savage@disney.com
Abstract
Numerous animals have declining populations due to habitat loss, illegal wildlife trade, and climate change. The cotton-top tamarin (Saguinus oedipus) is a Critically Endangered pri-mate species, endemic to northwest Colombia, threatened by deforestation and illegal trade. In order to assess the current state of this species, we analyzed changes in the popu-lation of cotton-top tamarins and its habitat from 2005 to 2012. We used a tailor-made “lure strip transect” method to survey 43 accessible forest parcels that represent 30% of the spe-cies’ range. Estimated population size in the surveyed region was approximately 2,050 in 2005 and 1,900 in 2012, with a coefficient of variation of approximately 10%. The estimated population change between surveys was -7% (a decline of approximately 1.3% per year) suggesting a relatively stable population. If densities of inaccessible forest parcels are simi-lar to those of surveyed samples, the estimated population of cotton-top tamarins in the wild in 2012 was 6,946 individuals. We also recorded little change in the amount of suitable habi-tat for cotton-top tamarins between sample periods: in 2005, 18% of surveyed forest was preferred habitat for cotton-top tamarins, while in 2012, 17% percent was preferred. We attribute the relatively stable population of this Critically Endangered species to increased conservation efforts of Proyecto Titı´, conservation NGOs, and the Colombian government. Due to continued threats to cotton-top tamarins and their habitat such as agriculture and urban expansion, ongoing conservation efforts are needed to ensure the long-term survival of cotton-top tamarins in Colombia.
Introduction
Many species and ecosystems are currently threatened due to anthropogenic pressures such as habitat loss, illegal hunting, and global climate change. Evaluating the success of efforts to pre-serve biodiversity is of urgent global concern. The Convention on Biological Diversity, first realized in 1994, proposed achieving a significant reduction in the rate of biodiversity loss
a11111
OPEN ACCESS
Citation: Savage A, Thomas L, Feilen KL, Kidney D, Soto LH, Pearson M, et al. (2016) An Assessment of the Population of Cotton-Top Tamarins (Saguinus oedipus) and Their Habitat in Colombia. PLoS ONE 11(12): e0168324. doi:10.1371/journal. pone.0168324
Editor: Danilo Russo, Universitàdegli Studi di Napoli Federico II, ITALY
Received: March 30, 2016
Accepted: November 29, 2016
Published: December 28, 2016
Copyright:©2016 Savage et al. This is an open access article distributed under the terms of the
Creative Commons Attribution License, which permits unrestricted use, distribution, and reproduction in any medium, provided the original author and source are credited.
Data Availability Statement: All relevant data are within the paper and its Supporting Information files (S1–S3Tables).
globally by 2010 [1]. However, an evaluation of 31 cross-disciplinary indicators that measured the biodiversity status, the anthropogenic pressures (i.e., deforestation), and conservation strategies (i.e., the number of protected areas) on a global level from 1970 to 2010 demon-strated that such reduction has not been achieved [2]. While most of the indicators demon-strated losses of biodiversity, this assessment found small scale successes such as increases in the number of protected areas, down-listing of many species on the IUCN Red List, and increases in funding to assist in biodiversity conservation [2,3]. Some studies have demon-strated that species recovery is possible [2,4–7], and nearly 7% of mammals, birds, and amphibians classified as Threatened or Near Threatened on the IUCN Red List [5] have stable or increasing populations mostly due to conservation actions that protect habitats and reduce human-wildlife conflict over resources [3].
The cotton-top tamarin (Saguinus oedipus) is a small arboreal primate endemic to north-western Colombia that is currently threatened with extinction due to habitat loss and capture for the illegal pet trade [8]. They live in family groups of 5–12 individuals that defend territo-ries of 2–12 ha [9]. Cotton-top tamarins were likely to have been abundant in Colombia, as 20–30,000 individuals were captured in the late 1960’s for use in biomedical research [10], but in 1973 the species was declared Endangered by IUCN. A population survey conducted in 2005 estimated less than 7,500 individuals remaining in the wild [11]. This estimate, combined with the dramatic loss of suitable forest habitat [12] led to the reclassification of the cotton-top tamarins as Critically Endangered [13] and placement on the list of the World’s 25 Most Endangered Primates 2008–2010 [14].
With an increased interest in conservation from both governmental authorities and conser-vation organizations, forest recovery trends in Colombia appear promising [15,16]. Colombia had an estimated increase of 16,963 km2in net woody vegetation between 2001 and 2010 [17], and protected areas in Colombia effectively reduced the probability of forest clearing from 2002 to 2005 [17]. Despite increases in forested and protected areas, forest conversion for agri-culture use, cattle ranching, and palm oil plantations still happens on privately owned lands within the historic distribution of cotton-top tamarins [18]. As the total human population in Colombia increased from 16 to 47 million people between 1960 and 2012 [19], and with more than 27.8% of the population living in poverty as of 2015 [20], human impacts on biodiversity represents a serious threat to biodiversity conservation in Colombia.
Although forest coverage is improving, pressures such as agriculture and urban expansion continue to threaten the habitat of cotton-top tamarins. In order to monitor the status of the population of cotton-top tamarins, we aimed to resurvey the remaining wild population of cot-ton-top tamarins and their habitat in 2012. We compared these values to an initial survey that took place in 2005 to examine how the population of cotton-top tamarins and their habitat changed over time.
Material and Methods
Survey Design
We replicated the survey design and procedures described in [11] to estimate cotton-top tama-rins’ population in 2012 and to compare it with results from the 2005 survey. Using remote-sensed spectral data covering the historic distribution of cotton-top tamarins in northwestern Colombia in 2000, we identified 14,534 km2of tropical dry forest patches. At the time of the 2005 survey, 10,515 km2of this land was inaccessible due to political conflict in the area. Of the 4,019 km2that was safely accessible to the field team, much of the forested area previously identified in the satellite images was already deforested, misidentified, or smaller than neces-sary to sustain a tamarin population (less than 0.005 km2), leaving only 98.93 km2of tropical
the study design, data collection and analysis, decision to publish, or preparation of the manuscript. The specific roles of these authors are articulated in the ‘author contributions’ section. The study was also funded by The SeaWorld & Busch Gardens Conservation Fund, Mohammed bin Zayed Species Conservation Fund, Wildlife Conservation Network, and Phoenix Zoo.
dry forest in 43 forest patches available to be surveyed. Of the 43 identified patches, our field team was able to access 36 patches in 2012. Patch size ranged from 0.18 to 17.35 km2(mean for-est patch size = 2.3, SD = 3.49 km2). To survey both the monkeys and forest quality, we placed transects that were 1.5 km long, 200 m wide, with the long axis oriented north-south, and using a systematic random design with a between-transect spacing of 400m. The number of transects per forest patch varied between 3 and 51 (mean number of transects per patch = 8.5, SD = 9.4) depending on the size of the patch and how the systematic random transects intersected the for-est. The study design marked 303 transects to be surveyed; due to political conflict or lack of permission from the landowners, our field team was able to survey 247 transects in 2005 and 235 transects in 2012 (208 of these were surveyed in both 2005 and 2012).
Field Methods
The field team surveyed areas using a “lure strip transect” method [11] from January through June 2012. Monkeys were surveyed in the morning, between 0700–1100, as this is the period of the day they are most active. Two teams walked parallel to each other 200 m apart, with both teams playing recordings of unknown cotton-top tamarins long calls (continuous play of 60 s of calls at 80 dB followed by 30 s of silence) from a high-quality playback device. The broadcast loudspeakers were generally oriented to cover forest ahead of each team as they pro-ceeded along the transect. Previous validation trials of the method, using the long-term field site of Proyecto Titı´, showed that: (a) all groups responded from within the strip of 200m width formed by the two teams; (b) it was possible to distinguish between those responding from inside and outside the strip; and (c) groups became rapidly habituated and stopped responding after multiple trials [11]. In the 2012 survey, as in the 2005 survey, the team sur-veyed each transect once to avoid habituation.
When cotton-top tamarins were observed, the field team recorded the compass bearing the group arrived along, the location of the animals along the transect and the number of adults, juveniles, and infants.
Vegetation type was classified along the transect every 50 m as (a) primary forest, (b) sec-ondary forest, (c) forest with cleared undergrowth, (d) area of regrowth with young trees pro-ducing fruits, (e) area of regrowth without fruiting trees, (f) open pasture or agriculture land, or (g) land converted for human settlements. Based on previous behavioral research [9], we attributed a preference index to each habitat type (a-g) reflecting its use by the tamarins: 0 (non-suitable habitats: e, f, g), 1 (habitats used only for feeding: d) and 2 (preferred habitats: a, b, c).
Statistical analyses
R Statistical Software [21] was used for all statistical analyses. We calculated the cotton-top tamarin population size by using the following formula,
b
N¼nsbsA a
edge of the forest, we calculated encounter rates and variance for the core forest area (the mapped patch plus 30 m margin) and the buffer area (area 300 m border around core forest area) separately.
We used an improved estimator of encounter rate variance that accounts for the systematic nature of the survey design (i.e., with transects laid out on a systematic random grid). The pre-vious estimator (Eq 4 of reference11)
c
var ns a ¼
1
aðk 1Þ
Xk
i¼1ai
ns;i ai
ns a
2
assumed a completely random layout of transects, and tends to over-estimate variance given a systematic design [22]. Hence, we instead used the estimator for systematic designs (Eq 16 of [22]–estimator O2)
c
varO2
ns a ¼
2k a2ðk 1Þ
Pk 1
i¼1
ðaiaiþ1Þ 2
ðaþaiþ1Þ 2
ns;i ai
ns;iþ1
aiþ1
2
:
This involves pairing up adjacent transects into overlapping pseudo-strata; in our study we used all pairs of adjacent transects to form pairs. In order to compare the 2005 survey results to those of 2012, we reanalyzed the 2005 data using the improved estimate of encounter rate variance.
We used the number of groups rather than the number of individuals sighted to calcu-late the encounter rate because it resulted in a lower variation between transects within patches. In order to determine the appropriate geographic level to estimate mean group size, we performed a model selection exercise. We used the observed group size as the response variable, and location within the forest patch (buffer or core), forest patch iden-tity, and department as factor covariates. We then ran a zero-truncated Poisson regression. The model with the lowest Akaike Information Criterion [23] was used to determine group size.
We used the delta method to calculate variance on population size N givenvarcO2ðns=aÞand
c
varðsÞ, and we calculated 95% confidence intervals by assuming N was a log-normal random variable [24].
To compare changes in forest suitability for tamarins between 2005 and 2012, we calculated the frequency of each category of habitat suitability criteria (preference index from 0 to 2) for each department and across the surveyed area and compared it using a Chi-Squared Test of Independence. We also compared changes in forest coverage of each segment between 2005 and 2012 to determine any significant deforestation or regrowth events.
Ethics Statement
Results
During the 2012 survey, 39.39 km2were surveyed in 36 forest patches. Cotton-top tamarins were recorded in 29 of 36 surveyed patches, totaling 816 individuals in 75 group encounters, with an average encounter rate of 1.7, SD = 1.8 groups per km2. Of the 816 tamarins, 89% were adults, 3.6% were juveniles (less than 1-year-old), and 7.2% were infants (less than 3 months).
Groups consisted of 2 to 10 individuals, with the average group size being 4.6, SD = 1.8 indi-viduals. The AIC-best model of group size had core vs. buffer as the explanatory variable (Table 1). This model was considerably better (in AIC terms) than the next best model: we cal-culated AIC weights [23] (also called model weights) for each model and the core vs. buffer model had 95% of the total weight (Table 1). We, therefore, used the core vs. buffer model for inference. Note, that none of the models explained much of the variation in group size (per-centage deviance explained<16%,Table 1), indicating that other factors than those we were able to model must play a larger part in determining group size.
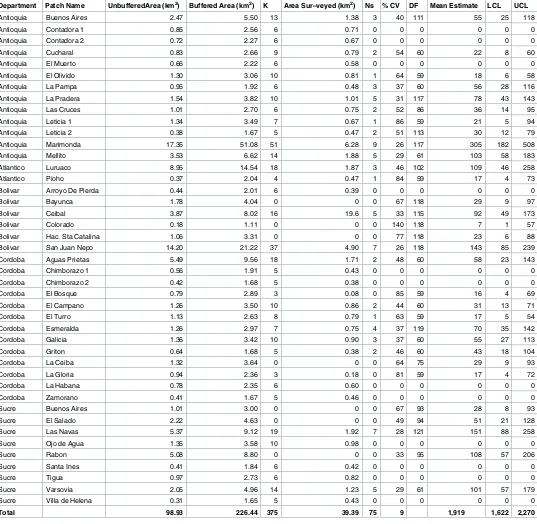
We estimated the population size in each patch (Table 2) totaling 1,919 cotton-top tamarins (95% CI: 1,622–2,270; CV: 9%) in all surveyed area, which covers 27% of the species range. Extrapolating our density estimates to the un-surveyed areas within species range, the esti-mated population of tamarins in the wild in 2012 was 6,946 individuals.
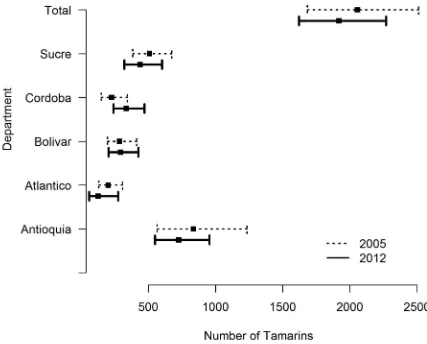
There was little change in the population estimates from 2005 to 2012 within the sampled areas (Fig 1). Recalculating the 2005 data with the same method as 2012 data, we estimated the population to be 2,056 individuals (95% CI: 1,683–2,513; CV: 10%). The point estimate is slightly different from that reported in [11] (of 2,045) due to a small change in the way we accounted for transects that span multiple forest patches. As expected, the variance is lower (the previous CV was 13%) because of the improved encounter rate variance estimator.
Extrapolating the 2005 density estimate to the species’ range, we estimate there were 7,443 animals in 2005. The estimated population change between surveys period was –7%, which represents a decline of approximately 1.3% per year.
Of the 11,794 segments surveyed in 2005, 73.8% were not suitable, 7.3% were suitable for feeding, and 18.8% were preferred. In 2012, 77.0% were not suitable for cotton-top tamarins, 6.0% were suitable only for feeding, and 16.7% were preferred tamarin habitat: suggesting no significant differences in habitat suitability from 2012 (Fig 2;χ= 3.1, df = 3, p = 0.37).
We found similar trends by departments since neither Cordoba (χ= 0.12, df = 1, p = 0.72), Sucre (χ= 0.11, df = 1, p = 0.73), Antioquia (χ= 0.04, df = 1, p = 0.82), Atla´ntico (χ= 0.30, df = 1, p = 0.58), or Bolivar (χ= 0.003, df = 1, p = 0.95) experienced any significant changes in suitability of habitat for cotton-top tamarins from 2005 to 2012.
Discussion
[image:5.612.35.575.634.699.2]The results of our survey demonstrate that the population of cotton-top tamarins has remained relatively stable from 2005 to 2012, at least in the regions we were able to survey. Additionally, there has been very little change in the available habitat for cotton-top tamarins during this time period. Although the total number of animals remaining in the wild is fairly low, a stable
Table 1. Model fit and model selection results for zero–truncated Poisson regression models fit to group size data.
Factor covariate Number of Parameters % deviance explained Akaike Information Criterion, AIC ΔAIC AIC weight
Core/buffer 2 5.56 681.37 0 0.95
None 1 0 687.28 5.92 0.05
Department 5 1.37 693.33 11.96 0.00
Forest patch 27 15.33 717.45 36.08 0.00
population for a Critically Endangered species can be considered a conservation success. Addi-tionally, using the methods of Fewster [22], we were able to improve our population estimates by capitalizing on the systematic random design used to produce a lower estimated variance.
Table 2. Forest patches, cotton-top sightings, and estimated population size of surveyed areas in 2012.
Department Patch Name UnbufferedArea (km2) Buffered Area (km2) K Area Sur–veyed (km2) Ns % CV DF Mean Estimate LCL UCL
Antioquia Buenos Aires 2.47 5.50 13 1.38 3 40 111 55 25 118
Antioquia Contadora 1 0.85 2.56 6 0.71 0 0 0 0 0 0
Antioquia Contadora 2 0.72 2.27 6 0.67 0 0 0 0 0 0
Antioquia Cucharal 0.83 2.66 9 0.79 2 54 60 22 8 60
Antioquia El Muerto 0.66 2.22 6 0.58 0 0 0 0 0 0
Antioquia El Olivido 1.30 3.06 10 0.81 1 64 59 18 6 58
Antioquia La Pampa 0.95 1.92 6 0.48 3 37 60 56 28 116
Antioquia La Pradera 1.54 3.82 10 1.01 5 31 117 78 43 143
Antioquia Las Cruces 1.01 2.70 6 0.75 2 52 86 36 14 95
Antioquia Leticia 1 1.34 3.49 7 0.67 1 86 59 21 5 94
Antioquia Leticia 2 0.38 1.67 5 0.47 2 51 113 30 12 79
Antioquia Marimonda 17.35 51.08 51 6.28 9 26 117 305 182 508
Antioquia Mellito 3.53 6.62 14 1.88 5 29 61 103 58 183
Atlantico Luruaco 8.95 14.54 18 1.87 3 46 102 109 46 258
Atlantico Pioho 0.37 2.04 4 0.47 1 84 59 17 4 73
Bolivar Arroyo De Pierda 0.44 2.01 6 0.39 0 0 0 0 0 0
Bolivar Bayunca 1.78 4.04 0 0 0 67 118 29 9 97
Bolivar Ceibal 3.87 8.02 16 19.6 5 33 115 92 49 173
Bolivar Colorado 0.18 1.11 0 0 0 140 118 7 1 57
Bolivar Hac. Sta Catalina 1.06 3.31 0 0 0 77 118 23 6 88
Bolivar San Juan Nepo 14.20 21.22 37 4.90 7 26 118 143 85 239
Cordoba Aguas Prietas 5.49 9.56 18 1.71 2 48 60 58 23 143
Cordoba Chimborazo 1 0.56 1.91 5 0.43 0 0 0 0 0 0
Cordoba Chimborazo 2 0.42 1.68 5 0.38 0 0 0 0 0 0
Cordoba El Bosque 0.79 2.89 3 0.08 0 85 59 16 4 69
Cordoba El Campano 1.26 3.50 10 0.86 2 44 60 31 13 71
Cordoba El Turro 1.13 2.63 8 0.79 1 63 59 17 5 54
Cordoba Esmeralda 1.26 2.97 7 0.75 4 37 119 70 35 142
Cordoba Galicia 1.36 3.42 10 0.90 3 37 60 55 27 113
Cordoba Griton 0.64 1.68 5 0.38 2 46 60 43 18 104
Cordoba La Ceiba 1.32 3.64 0 0 0 64 75 29 9 93
Cordoba La Gloria 0.94 2.36 3 0.18 0 81 59 17 4 72
Cordoba La Habana 0.78 2.35 6 0.60 0 0 0 0 0 0
Cordoba Zamorano 0.41 1.67 5 0.46 0 0 0 0 0 0
Sucre Buenos Aires 1.01 3.00 0 0 0 67 93 28 8 93
Sucre El Salado 2.22 4.63 0 0 0 49 94 51 21 128
Sucre Las Navas 5.37 9.12 19 1.92 7 28 121 151 88 258
Sucre Ojo de Agua 1.35 3.58 10 0.98 0 0 0 0 0 0
Sucre Rabon 5.08 8.80 0 0 0 33 95 108 57 206
Sucre Santa Ines 0.41 1.84 6 0.42 0 0 0 0 0 0
Sucre Tigua 0.97 2.73 6 0.82 0 0 0 0 0 0
Sucre Varsovia 2.05 4.96 14 1.23 5 29 61 101 57 179
Sucre Villa de Helena 0.31 1.65 5 0.43 0 0 0 0 0 0
Total 98.93 226.44 375 39.39 75 9 1,919 1,622 2,270
K = Number of transects, Ns = Number of observed groups, % CV = Percent coefficient of variation on this estimate, DF = Degrees of freedom, LCL = Lower confidence limit, UCL = Upper confidence limit
Population estimates give a general understanding of a species status. However, they can often obscure underlying population dynamics such as compression effects (higher densities of animals due to less available habitat) [25] or source-sink dynamics (high-quality habitat with population growth supporting poor quality areas with population declines) [26]. With our current dataset, it is difficult to determine what population dynamics contributed to the relatively stable population size from 2005 to 2012. Although we cannot determine if some of these surveyed populations are potential ecological sinks, additional data from other studies on this species suggest that stability is an accurate representation of the cotton-top tamarin population for the sampled areas [27,28]. Reproductive rates of cotton-top tamarins from a long-term research project at Hacienda Ceibal (Bolivar), one of the surveyed patches, have remained stable: on average each adult female produces two offspring a year [27] and infant mortality rates are low [28].
[image:7.612.146.573.73.417.2]Stability of the population can be attributed to decreases in threats. We found that forest suitability for tamarins has not changed from 2005 to 2012. At the level of individual parcels, some forests experienced slight deforestation, while others experienced regrowth. Although the majority of sample was considerably impacted by agricultural expansion and therefore unsuitable territory for tamarins, most parcels consisted of a mosaic landscape, with small sec-tions of secondary forest (preferred habitat for tamarins) near the center of forest patches,
Fig 1. Estimated population size (with 95% confidence interval) of cotton-top tamarins in surveyed areas in Colombia (overall and separated by department) and in each department in 2005 and 2012.
areas of regrowth, agricultural lands used and ranching usually located closer to human settlements.
[image:8.612.190.574.74.489.2]One proposed explanation for the stability of the cotton-top tamarins and habitat is the work of conservation organizations. Since 1987, Proyecto Titı´ has been leading the effort to bring increased national and international attention to the conservation efforts of cotton-top tamarins in Colombia [29] through scientific investigation [9,28,30], community empower-ment and sustainable developempower-ment [31,32], education [8], training of Colombian nationals, and protection of habitat in the department of Atla´ntico and Bolı´var [8]. Proyecto Titı´ directly lead in the protection and conservation of habitat by working to establish two protected areas: El Parque Natural Regional Bosque Seco El Ceibal Mono Titı´ (Cotton-top Tamarin Regional Park in Bolı´var) [33] and Parque Natural Regional Los Rosales in Atla´ntico [34], which added legal protection to 1,724 hectares of forest. With their educational programs and public aware-ness campaigns, Proyecto Titı´ encouraged local people to help blocked the development of an international airport in the department of Atla´ntico, which would have decimated two large forest parcels used by cotton-top tamarins that contain more than 200 individuals [35].
Fig 2. Changes in suitable forest for cotton-top tamarins from 2005 to 2012.
The actions of Proyecto Titı´ to preserve habitat is just one example of a larger trend in Colombia to increase protected areas. Colombia has 627 protected areas covering 23% of its land [36], 214 of these areas have been created since 2005, the year of the first survey. ProAves and World Land Trust established 21 reserves for the protection of birds and other wildlife, including one dedicated to the cotton-top tamarin (Reserva Natural Tití Cabeciblanco; [37,38], while Conservation International Colombia and MPX are conserving 1,100 hectares of tropical dry forest in northern Colombia. These actions reduce the risk of losing key habitat for cotton-top tamarins and other species that use tropical dry forests in Colombia.
Although not directly measured in this study, another possible contributing factor to the relatively stable population is the reduction of animals removed from the wild. In 1973, the Convention on International Trade in Endangered Species of Wild Fauna and Flora (CITES) was written [39]. As cotton-top tamarins are an Appendix 1 species (species that threatened with extinction and have the highest level of protection under CITES), this made any trade of cotton-top tamarins illegal, and reduced the export for biological research. Also, the awareness and education programs of organizations such as Proyecto Titı´ has decreased the desire to have wild animals as pets in Colombia. In a household survey, results showed that in areas where Proyecto Titı´ either had economic development programs or education programs, no cotton-top tamarins or other mammals were reported as pets [8].
Large scale development projects, such as mining operations [40], palm oil plantations [41], and dams [42], have the potential to destroy large areas of habitat. As most of the remaining habitats for cotton-top tamarins are small isolated parcels of forest, it is important to focus efforts on providing protection for remaining land areas, connecting small forest fragments to larger protected areas, and increasing the connectivity of forest fragments to allow for popula-tion growth and genetic exchange. Efforts that engage local farmers that want to work on their own protected areas have the potential to increase habitat for cotton-top tamarins.
Both the cotton-top tamarin population and the available habitat had few changes from 2005 to 2012. Although we were not able to measure directly the causes of this stability, we pro-pose that long-term, multi-disciplinary conservation programs may have contributed to this result. Through the efforts of Proyecto Titı´ and the organizations involved in the development of The National Plan for Cotton-top Tamarins, there is now a concerted effort to protect cot-ton-top tamarins in Colombia. We encourage scientists and conservation managers to think critically about the threats to their species and develop integrated strategic programs, especially at the grassroots level, that can help to reduce the impacts of threats. Careful surveying of criti-cally endangered species using replicable survey methods is an essential action to monitor the status of threatened animals and measure the potential impact of conservation interventions.
Supporting Information
S1 Table. Survey Data for Cotton-top Tamarins in 2012 (XLSX)
S2 Table. Survey Data for Cotton-top Tamarins in 2005 (XLSX)
S3 Table. Habitat Assessment Data from 2005 and 2012 (XLSX)
Acknowledgments
Bishop for contributions to the development of survey methods. We also extend our sincerest thanks to the owners of Hacienda El Ceibal for the permission to study the cotton-top tama-rins in their forest and to all the land owners who granted us permission to survey their private forests. We are appreciative of the support of Corporaciones Auto´nomas Regionales de Colombia, CRA, CARDIQUE, CORPOURABA, CVS, CARSUCRE, CORANTIOQUIA, CORPOMOJANA and Parques Nacionales Naturales de Colombia for authorization to con-duct surveys in areas under their jurisdiction. We gratefully acknowledge Jose Gregorio Oli-vares and local field assistants at the survey sites for their expertise and hard work in undertaking the survey under what was often arduous conditions. To the local communities that continue to engage with cotton-top tamarins conservation efforts and champion their sur-vival as their own responsibility, we thank you for helping to protect the magic of nature.
Author Contributions
Conceptualization: AS LT. Data curation: MP KLF DK. Formal analysis: LT DK KLF. Funding acquisition: RRG AS. Investigation: LHS FSM GE. Methodology: AS LT.
Project administration: RRG LHS. Resources: LT DK MP RRG. Supervision: AS RRG. Visualization: KLF.
Writing – original draft: KLF LT. Writing – review & editing: KLF AS.
References
1. UNEP. Report of the Sixth Meeting of the Conference of Parties to the Convention on Biological Diver-sity (UNEP/CBD/COP/20/Part 2) Strategic Plan Decision VI/26 in CBD; 2002.
2. Butchart SH, Walpole M, Collen B, Van Strien A, Scharlemann JP, Almond RE, et al. Global biodiver-sity: indicators of recent declines. Science. 2010; 328(5982):1164–8. doi:10.1126/science.1187512
PMID:20430971
3. Hoffmann M, Hilton-Taylor C, Angulo A, Bo¨hm M, Brooks TM, Butchart SH, et al. The impact of conser-vation on the status of the world’s vertebrates. Science. 2010; 330(6010):1503–9. doi:10.1126/science. 1194442PMID:20978281
4. Kleiman DG, Beck BB, Dietz JM, Dietz LA, Ballou JD, Coimbra-Filho AF. Conservation program for the golden lion tamarin: captive research and management, ecological studies, educational strategies, and reintroduction. In: Benirschke K, editor. Primates: the road to self-sustaining populations. New York: Springer; 1986. p. 959–79.
5. IUCN. IUCN Red List of Threatened specieswww.iucnredlist.org; 2010.
6. McNeilage A, Robbins MM, Gray M, Olupot W, Babaasa D, Bitariho R, et al. Census of the mountain gorilla Gorilla beringei beringei population in Bwindi Impenetrable National Park, Uganda. Oryx. 2006; 40(04):419–27.
8. Savage A, Guillen R, Lamilla I, Soto L. Developing an effective community conservation program for cotton-top tamarins (Saguinus oedipus) in Colombia. Am J Primatol. 2010; 72(5):379–90. doi:10.1002/ ajp.20770PMID:19998392
9. Savage A. The reproductive biology of the cotton-top tamarin (Saguinus oedipus oedipus) in Colombia [dissertation]. Madison(WI): University of Wisconsin–Madison; 1990.
10. Hernandez-Camacho J, Cooper RW. The nonhuman primates of Colombia. In: Thorington RW, Heltne PG, editors. Neotropical primates: field studies and conservation. Washington, DC: National Academy of Sciences; 1976. p. 35–69.
11. Savage A, Thomas L, Leighty KA, Soto LH, Medina FS. Novel survey method finds dramatic decline of wild cotton–top tamarin population. Nat Commun. 2010; 1:30. doi:10.1038/ncomms1030PMID:
20975684
12. Miller L, Savage A, Giraldo H. Quantifying remaining forested habitat within the historic distribution of the cotton-top tamarin (Saguinus oedipus) in Colombia: Implications for long-term conservation. Am J Primatol. 2004; 64(4):451–7. doi:10.1002/ajp.20091PMID:15580586
13. Savage A, Causado J. Saguinus oedipus. IUCN Red List of Threatened Species 2014: e. T19823A17930260. 2014 [cited 2015 July 9]. Available from:www.iucn.redlist.org.
14. Savage A, Soto L, Lamilla I, Guillen R. Cotton-top tamarin Saguinus oedipus (Linnaeus, 1758), Colom-bia (2008) In: Mittermeier RA, Wallis J, Rylands AB, Ganzhorn JU, Oates JF, et al., editors. Primates in Peril: The World’s 25 Most Endangered Primates. 2008–2010. Arlington, VA: IUCN/SSC Priamte Spe-cialist Group (PSG), International Primatological Society (IPS), Conservation International; 2009. pg 1–57.
15. Sa´nchez-Cuervo AM, Aide TM, Clark ML, Etter A. Land cover change in Colombia: surprising forest recovery trends between 2001 and 2010. PloS One. 2012; 7(8):e43943. doi:10.1371/journal.pone. 0043943PMID:22952816
16. Sanchez-Cuervo AM, Aide TM. Identifying hotspots of deforestation and reforestation in Colombia (2001–2010): implications for protected areas. Ecosphere. 2013; 4(11):art143.
17. Da´valos LM, Bejarano AC, Hall MA, Correa HL, Corthals A, Espejo OJ. Forests and drugs: coca-driven deforestation in tropical biodiversity hotspots. Environ Sci Technol. 2011; 45(4):1219–27. doi:10.1021/ es102373dPMID:21222455
18. Etter A, McAlpine C, Wilson K, Phinn S, Possingham H. Regional patterns of agricultural land use and deforestation in Colombia. Agric Ecosyst Environ. 2006; 114(2):369–86.
19. Departamento Administrativo Nacional de Estadı´stica. Poblacio´n de Colombia. Bogota´; 2012.
20. World Bank, Global Poverty Working Group. Poverty headcount ratio at national poverty lines (% of population) Colombia; 2016. Database: The World Bank DataBank [Internet]. Accessed:http://data. worldbank.org/indicator/SI.POV.NAHC/countries/CO?display=graph.
21. R Development Core Team. R: a language and environment for statistical computing. Version 3.2.5. Vienna, Austria: R Foundation for Statistical Computing; 2016.
22. Fewster RM, Buckland ST, Burnham KP, Borchers DL, Jupp PE, Laake JL, et al. Estimating the encounter rate variance in distance sampling. Biometrics. 2009; 65(1):225–36. doi: 10.1111/j.1541-0420.2008.01018.xPMID:18363772
23. Burnham KP, Anderson DR. Model selection and multi-model inference: a practical information-theo-retic approach. New York: Springer; 2002.
24. Thompson SK. Sampling. 3rd ed. WileyHoboken: Wiley; 2012.
25. Dunbar R. Habitat quality, population dynamics, and group composition in colobus monkeys (Colobus
guereza). Int J Primatol. 1987; 8(4):299–329.
26. Brawn JD, Robinson SK. Source-sink population dynamics may complicate the interpretation of long– term census data. Ecology. 1996:3–12.
27. Savage A, Shideler SE, Soto LH, Causado J, Giraldo LH, Lasley BL, et al. Reproductive events of wild cotton-top tamarins (Saguinus oedipus) in Colombia. Am J Primatol. 1997; 43(4):329–37. doi:10.1002/ (SICI)1098-2345(1997)43:4<329::AID-AJP4>3.0.CO;2-ZPMID:9403097
28. Savage A, Soto L, Medina F, Emeris G, Soltis J. Litter size and infant survivorship in wild groups of cot-ton-top tamarins (Saguinus oedipus) in Colombia. Am J Primatol. 2009; 71(8):707–11. doi:10.1002/ajp. 20696PMID:19382151
29. Savage A, Guillen R. Conserving cotton-top tamarins Saguinus oedipus through effective captive man-agement, public engagement and in situ conservation efforts. Int Zoo Yearb. 2012; 46:56–70.
31. United Nations Development Programme. The power of local action: communities on the frontline of sustainable sevelopment. New York (NY): UNDP; 2012.
32. United Nationals Development Programme. United Women Artisans’ Association of Los Lı´mites (ASOARTESANAS), Colombia. Equator Initiative Case Study Series. New York (NY): UNDP; 2013.
33. Perez Barrios LE. Por medio de la cual se declara El Parque Natural Regional Bosque Seco El Mono Titi, ubicado en el municipio de Santa Catalina, Departamento de Bolivar y se adoptan otras determina-ciones; Corporacion Autonoma Regional del Canal del Dique, Cardique; 2013. Report No. 0004.
34. Verano de la Rosa E, Insignares JL. Acuerdo No. 00015: Por el cual se declara el Parque Natural Regional Los Rosales, y se adoptan otras disposiciones; Corporacion Autonoma Regional del Atlantico; 2011. Report No. 00015.
35. Rico L [Internet]. Aeropuerto Bicentenario: otro sueño de Uribe que podrı´a quedar en el aire Colombia La Silla. 2010 Jul 13 [cited 2016 Jan 15]. Available from:http://lasillavacia.com/historia/16530.
36. IUCN, WCMC. The World Database on Protected Areas (WDPA); 2015. Database: UNEP-WCMC [Internet]. Accesssed:www.protectedplanet.net.
37. ProAves [Internet]. ProAves Reserves 2015 [cited 2015 June 2015]. Available from:http://www. proaves.org/reservas–de–proaves/.
38. Trust WL. Colombia’s Cotton-top Tamarin Reserve is safe haven for critially endangered primates Suf-folk, UK: World Land Trust; 2014 [cited 2015 July 2015]. Available from:http://www.worldlandtrust.org/ news/2014/08/colombia–s–cotton–top–tamarin–reserve–safe–haven–critically–endangered–primates.
39. UNEP-WCMC (Comps.) The Checklist of CITES Species Website; 2015. Database: UNEP-WCMC [Internet]. Accessed:http://checklist.cites.org.
40. Swenson JJ, Carter CE, Domec JC, Delgado CI. Gold mining in the Peruvian Amazon: global prices, deforestation, and mercury imports. PloS One. 2011; 6(4):e18875. doi:10.1371/journal.pone.0018875
PMID:21526143
41. Fitzherbert EB, Struebig MJ, Morel A, Danielsen F, Bru¨hl CA, Donald PF, et al. How will oil palm expan-sion affect biodiversity? Trends Ecol Evol. 2008; 23(10):538–45. doi:10.1016/j.tree.2008.06.012PMID:
18775582