Direct numerical simulations of particle sedimentation with
heat transfer using the Lattice Boltzmann method
Bo Yang1, Sheng Chen*1,2,3, Kai Liu1
1 State Key Laboratory of Coal Combustion, School of Energy and Power
Engineering, Huazhong University of Science and Technology, Wuhan, 430074,
China
2 Institute for Modelling and Simulation in Fluodynamics, Nanoscience and
Industrial Mathematics "Gregorio Millan Barbany", Universidad Carlos III de Madrid,
Leganes 28911, Spain
3 Faculty of Engineering, The University of Nottingham, University Park,
Nottingham NG7 2RD, UK
*Corresponding author: Faculty of Engineering, University of Nottingham.
E-mail address: [email protected]
Abstract
In most realistic gas-solid flow, the difference of particles’ temperature is
significant. The heat transfer induced by temperature difference between particles
will influence the behavior of gas-solid flow critically. In order to deepen our insights
into this important topic, in this work three typical cases: (1) double hot particles, (2)
double cold particles, and (3) one hot and one cold particle, are investigated with the
aid of direct numerical simulation of the Lattice Boltzmann method. A
comprehensive comparison is carried out between them and some new interesting
phenomena are observed. Our results show that thermal convection between particles
will influence their behaviors significantly.
1 Introduction
Particle sedimentation exists in many natural and industrial processes, such as
sand deposition in rivers and particle fluidization in fluidized bed reactors. In the past
decades, the behaviors of suspended particles settling under gravity have been
investigated experimentally and numerically extensively by many researchers [1]-[3].
It has been demonstrated that heat transfer between particles with different
investigated the effects of heat transfer on the sedimentation of double cold and hot
particles. It was found that cold particles would tend to repel each other while hot
particles would attract each other. The effects of Grashof numbers (Gr) on the
interaction between two cold particles were also uncovered. With increasing in Gr,
the interactions of repelling and attracting between particles become more evident.
However, many important aspects were omitted in their investigation, such as effects
of the walls and high Grashof numbers. Feng et al. [5] studied the sedimentation of
56 heated circular particles in an enclosure. In their work, the particles were cooled
gradually due to energy exchange with the fluid. The authors observed that the
trailing particles in the thermal wakes of the leading particles had a higher
temperature. Zahra Hashemi et al. [6] simulated the sedimentation of 30 hot particles
in an enclosure. The collective behavior of these hot particles was investigated. It was
found that the average settling velocity of hot particles were much lower than the
isothermal case. Recently, Henrik Ström et al. [7] studied the sedimentation of two
hot particles with an internal heat source. The authors revealed that when the internal
heat sources were large enough, the initial drafting was reversed and no kissing or
tumbling occurred. Zhang et al. [8] made a comparison of sedimentation process of
185 and 504 particles among three cases: cold particles, hot particles and isothermal
particles. The particle distribution patterns of three cases with isothermal contours
during sedimentation were obtained. The cold particles obviously settled more
efficiently than others. However, many important flow characteristics, such as vortex
and velocity distribution, were not investigated. Zhang et al. [9] also investigated the
behaviors of 5000 and 8125 particles with heat transfer, and uncovered the
distribution characteristics of particles’ velocity and position. Their results revealed
that the thermal buoyancy had a great effect on the sedimentation efficiency of the
solid particles. When considering heat transfer, the interface between the hot particle
aggregated and lower fluid was more unstable. Our previous works [10]-[11]
identified three interaction regimes (repulsion, attraction and transition regime)
between double settling particles based on initial configurations, and investigated the
effects of heat transfer on double cold particles in each regime. Although the
sedimentation of thermal particles has been investigated in mentioned literature, the
effects of Gr on the sedimentation of two hot particles and two cold particles still
most above literature studies the effects of heat transfer on the motions of two settling
particles with the same temperature, while the temperature of particles is usually
different in realistic suspension flow. Thus a comprehensive study on sedimentation
of two particles with different temperature (namely one hot particle and one cold
particle) with various Gr is investigated for the first time. Lastly, most of above
literature studies the sedimentation of thermal particles individually, a comprehensive
comparison of interaction regimes among three cases (two hot, two cold, one hot and
one cold particles) at the same condition is absent yet. It will be discussed in this
paper for the first time.
2 Numerical method
In recent years, the Lattice Boltzmann Method (LBM) [12] has been developed to
model particulate flows due to its efficiently treating the complex system of moving
boundaries [13]-[14]. The immersed boundary method (IBM) was introduced by
Peskin [15] and evolved to kinds of computing strategies. It gains popularity because
it is straightforward and easier to apply than other boundary approaches [16]-[17].
The direct-forcing IBM has been applied to solving many complex boundary
problems [18]-[23] because it has good stability and hasn’t adjusted arbitrary
parameters. Here, we adopt the direct-forcing method with sharp interface scheme
proposed by Kang et al. [18]-[19].
Specifically, the double-population thermal lattice Boltzmann equations are
employed to solve flow and temperature field. The evolution equations for fluid flow
and temperature field are formulated as
( , ) ( , ) Ω ( )
i i i i i i
f xct tt f x t f F t R t (1)
1
( , ) ( , ) [ ( , ) eq( , )]
i i i i i i
T
T t tt T t T t T t Q t
x c x x x (2)
Where fi( , ), ( , )x t Ti x t are flow and temperature distribution function, respectively. Δt
is the time step, Fi and Ri are the discrete forcing term for the boundary force, the
buoyancy force respectively. i( )f is the discrete collision operator in
multiple-relaxation-times (MRT) models and is formulated as [24-Error! Reference
source not found.
1
( ) ( ) ( eq)
i ji j j
j
f M SM f f
Where fjeqis the equilibrium distribution function and 1
0 1 2 1
( , , ,..., i )
S diag is a
positive diagonal matrix. We set S diag(1,0.2,0.1,1,1.2,1,1.2,1 /f,1 /f) using D2Q9 model, wherefis the momentum relaxation time. The discrete velocityciis defined as
(0, 0) 0
(cos[( 1) / 2],sin[( 1) / 2]) 1, 2, 3, 4
2 (cos[(2 1) / 4],sin[(2 1) / 4]) 5, 6, 7,8
i
i
c i i i
c i i i
c (4)
Wherec x/ t is the lattice speed and Δx is the lattice grid spacing. The equilibrium distribution functions eq
i
f and eq
i
T are defined by
2 2
2 4 2
( )
1 3 4.5 1.5
eq i i
i i
u u u
f w
c c c
c c (5)
2 1 5 5 2 eq i i i u T T c c (6)
Where 0 4, 1 4 1and 5 8 1
9 9 36
w w w . The transfer matrix M for MRT is given by
1 1 1 1 1 1 1 1 1
4 1 1 1 1 2 2 2 2
4 2 2 2 2 1 1 1 1
0 1 0 1 0 1 1 1 1
0 2 0 2 0 1 1 1 1
0 0 1 0 1 1 1 1 1
0 0 2 0 2 1 1 1 1
0 1 1 1 1 0 0 0 0
0 0 0 0 0 1 1 1 1
M (7)
The forcing term Fi can be given by [26]
1 1
2
i ji i
F M I S M F
(8)
Where I is the unit matrix. Using Guo-Zheng-Shi model [27], Fiand Qi aredefined by 2 4 1 (1 ) 2 i i
i i i
f s s
F w c c
c u c u
1
(1 )
2
i i
T
Q w Q
(10)
Where F and Q is the force density and temperature term from the immersed
boundary, respectively. The macroscopic quantities can be given by
0 0 0
, ,
2 2
i i i i
i i i
t t
f f T T Q
u
c F
(11)Using the Chapman-Enskog analysis, the NS and temperature equations can be
recovered from the Lattice Boltzmann equations:
0 t u (12)
( ) ( ) ( )T
p t
u uu u u F (13)
2 (T ) T T Q t
u (14)
where α is the thermal diffusion coefficient.
Here we adopt the exterior sharp interface scheme [18] to solve the moving
boundary, in which the forcing nodes are located inside the solid and closest to the
boundary. Since the treatments of flow and temperature field are similar, we only
explain the solution for velocity boundary. The force density F is given by [18]
( , ) ( , )
( , ) 2 ( , )
d t t t t t
u x u x
F x x (15)
Whereu x( , )t is the velocity in the forcing node andu xd( , )t is obtained using bilinear and linear interpolation
2 3 4
1
( , ) [ (1 ) (1 )(1 ) (1 )
d
b x y x y x y
x y
t
u x u u u u (16)
or
1 1
0.5 ( , )
2 2 (1 2 ) 0.5
b f
d
b f ff
if t if u u u x
u u u
(17)
The bilinear and linear interpolations are illustrated by Fig. 1. In Eq. (16) subscript b
indicates the node on the boundary closest to the forcing node x, subscripts 2, 3, 4 are
outside fluid nodes moved from the forcing node, by one grid in y-direction,
x-direction, and both directions. Δx and Δy are distances between nodes b and 4 in
area, linear interpolation is used. In Eq. (17) f, ff indicate the outside fluid nodes migrated from the forcing node, by one and two grid in either x- or y-direction, and Δ
is the distance between nodes b and f.
Using Boussinesq approximation, the discrete forcing term Ri is expressed as [27]
2 4
0 ( 0)
i i
i i i
s s T T R w c c
c u c u c R
R g
(18)
where0and T0 are the average density and temperature of fluid, g is the gravity
vector, and β is thermal expansion coefficient of fluid and is given by
2
3 .
Gr d g T
(19)
Where d is the diameter of particles in this paper, T Ts T0is the temperature gradient between particles and fluid and Gr is the Grashof number.
On the basis of Newtonian law, following equations are solved to obtain the
motion of particles.
( )
( )
i
i i
dU t
M F t
dt (20)
( )
( ) [ ( )] ( )
i
i i i i i
t
I t I t T t
dt
(21)
Where Mi, Ii are the mass andinertial tensor of the ith particle, Fi(t) and Ti(t) are the total force and toque acting on the ith particle, Ui(t) and Ωi(t) are translational and angular velocity of the ith particle, respectively.
Repulsive force is introduced to solve the particle-particle collisions when the gap
between two particles exceeds a given threshold [28]:
2
0 | |
| | ( )
| |
| |
i j i j
ij ij i j i j i j
i j i j
i j
x x R R
F c x x R R x x
x x R R
x x (22)
where xi , xjare the center positions of two particles, and Ri,Rj are the radius of two particles, respectively. cij is the force scaling factor for the sedimentation problems; ε is the stiffness parameter for collisions, which is set to be dx2; ζ is the threshold or “safe zone”, and if the gap is less than the given threshold ζ, a strong repulsive force
physically due to the threshold ζ and so the friction, deformation and viscous lubrication processes are not considered here.
3 Simulation results and discussion
In this section, sedimentation of two circular particles in Newtonian fluid is
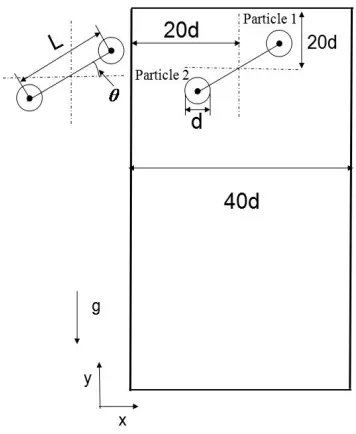
numerically investigated. The investigated domain is illustrated by Fig. 2. As
mentioned above, three representative cases are considered: two hot particles (case 1),
two cold particles (case 2), and one hot and one cold particle (case 3). The sizes of
the particles are identical, with a diameter d=0.5cm and densityp=1.01g/cm³. Initially, the density of fluid is set to f =1.0g/cm³and the non-dimensional temperature of fluid is set to 0. The gravity constant g is set to -981g/cm³. The
non-dimensional temperature of hot and cold particles is set to 1 and -1, respectively.
The Prandtl number Pr is fixed to 0.7 and the range of Grashof number Gr is 0-2000.
The grid spacing dx is set as dx=0.025cm, and the time step is set as dt=0.001042s. The reference Reynolds number Re is set to 84, which is defined by
Re c , ( p 1) / 2
c
f
U d
U d g
(23)
where υ is the fluid viscosity. In LB the pressure of flow field can be obtained
byp cs2, where ρ is the density andcs c/ 3is the Lattice sound speed. The two particles begin to accelerate in rest fluid at t=0 due to the gravity force. Here we
only consider the configurations:L d/ 2.0, 90 . The boundary conditions are
given as
Top and bottom boundary: T/ y 0, u/ y 0 ; left and right
boundary:T 0, u0.
Our numerical code has been validated in our previous work [11], so we do not
repeat it here for clarity.
3.1 sedimentation of two hot particles
In this section, the sedimentation of two hot particles under various Gr is
investigated. By comparing the results at different Gr, the effects of Gr on the
behaviors of hot particles are uncovered.
process. The DKT and separating stage of hot particles rely closely on the Gr, as
illustrated in Fig. 3. The separating stage indicates the process in which the two
particles separate from each other after the DKT. Here and hereafter, the time is
normalized byt* tUc d
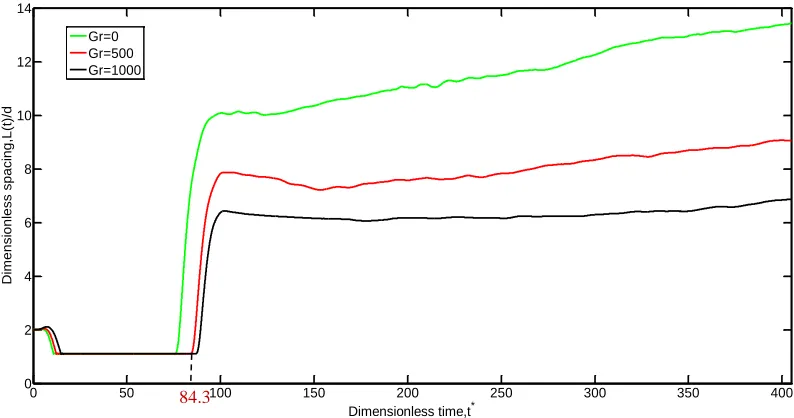
. With the increasing of Gr, the startup of DKT is postponed
and its period is prolonged. During the separating stage, the repulsion force between
the two hot particles becomes weak.
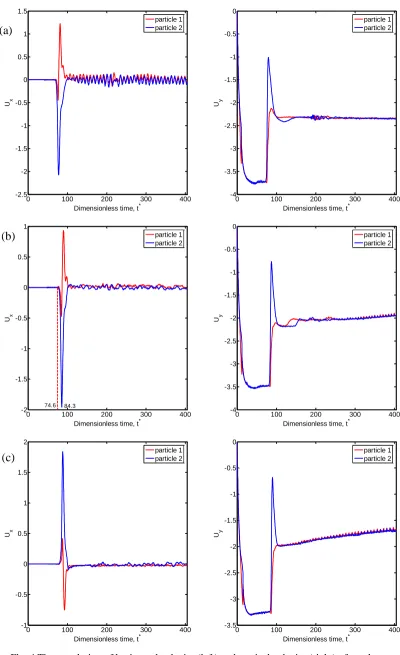
Fig. 4 depicts the horizontal and vertical velocity of two hot particles with various
Gr. In the present work we take Gr=500 as a representative to discuss it (see Fig.
4(b)). In the beginning settling, particles’ vertical velocity increases almost linearly
with time until the trailing particle’s (particle 1) velocity exceeds the leading one
(particle 2) (namely drafting process). When the two hot particles become to contact
with each other, the trailing particle’s velocity decreases sharply to that of the leading
particle’s due to the short-range particle-particle force. Then during the tumbling
process the two hot particles have the same vertical velocity and the velocity
maintains nearly constant. In succession, during the separating stage (84.3<t*<100),
firstly the two hot particles experience strong drag force and their settling velocities
decrease linearly, and then the leading particle’s velocity accelerates to approaching
that of the trailing one. After the separating stage, their settling velocities decrease to
about 2.0 and reach a relatively steady state.
The effects of Gr on the settling velocities of the two hot particles are also
significant. Against Gr increases, the tumbling velocities of two hot particles decrease.
After separating stage, at Gr=0 settling velocities maintain about 2.34, while at Gr>0
the settling velocities decrease slowly with periodic oscillations. It will be explained
below.
It is observed that the variations of horizontal velocities of the two hot particles
depend closely on Gr. As shown in Fig. 4(b), when t*<74.6 the horizontal settling
velocities maintain zero. During 74.6<t*<84.3 (during the tumbling process) two hot
particles migrate to same side, and theirs horizontal velocities increase to maximum
value and then decrease sharply to zero with fluctuations at the same frequency. As
pointed out by Gan et al. [4], vortex shedding causes the oscillations of horizontal
velocities of the settling particles. Moreover, with the increasing Gr, the horizontal
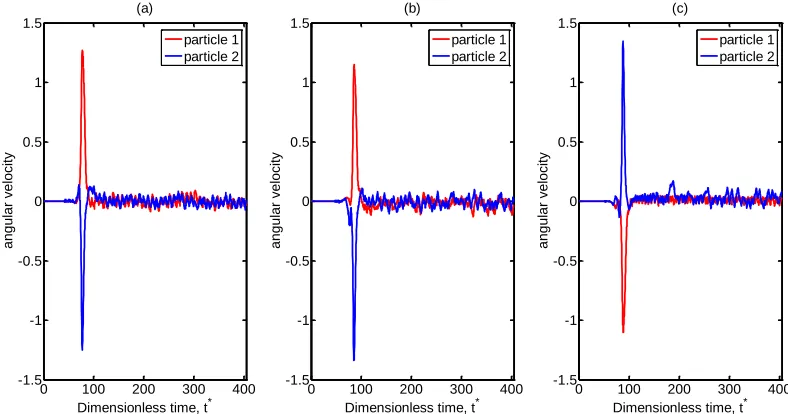
The Gr also influences the variations of hot particles’ angular velocities. Fig. 5
depicts the variations of angular velocities of the two hot particles with various Gr.
As shown in Fig. 5(b) (Gr=500), when t*<48 angular velocities of the two hot
particles maintain about zero. During 48<t*<85.6 (during the tumbling process) they
increase fast up to a maximum value in the opposite directions. In succession, during
85.6<t*<101.8 (during the separating process) they decrease fast down to about zero.
Lastly, they fluctuate strongly with high frequencies around zero. With high Gr,
angular velocities of the two hot particles fluctuate with a bit larger amplitudes.
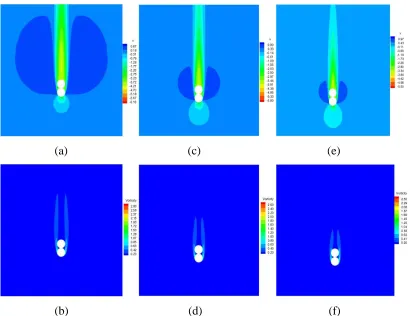
Fig. 6 plots distributions of vertical velocity and vorticity magnitude contours with
various Gr during the tumbling stage. As pointed out by Hu et al.[29], the two
particles would form a “long body” because their wakes would merge. With Gr
increasing, as expected, the moving fluid beside the long body has higher upward
velocity, but fluid in the wake of the long body has lower downward velocity. These
results can be explained by the fact that the upward stream induced by heat
convection between hot particles and surrounding fluid influences strongly the
moving fluid. In addition, against Gr increasing, the length of connected-wake is
reduced.
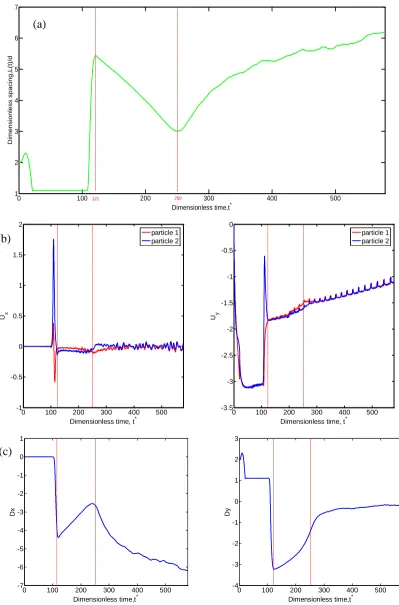
As Gr>1000, the behavior of sedimentation becomes more complicated. As
illustrated by Fig. 7(a), two hot particles at Gr=1500 experience not only a DKT
process but also an extra drafting process, in comparison with its low Gr counterpart.
By measuring the time duration of tumbling, as expected, the tumbling process
begins later and persists longer than its low Gr counterpart. In addition, we observe a
small increment of distance between the two particles during 0<t*<10. As shown by
Fig. 7(c), during the extra drafting process (121<t*<250) one can observe that both
the horizontal and vertical distance between two particles decrease quickly. It can
also be reflected by the history of horizontal and vertical velocities illustrated by Fig.
7(b), in which the area between two velocity curves indicates relative displacement.
The leading particle always moves a little faster than the trailing particle in horizontal
direction. It, together with the vertical velocity difference between the two hot
particles, causes the extra drafting process. In addition, as expected, at Gr=1500 the
settling velocities experience more significant periodic oscillations since t*>300
compared to theirs low Gr counterpart.
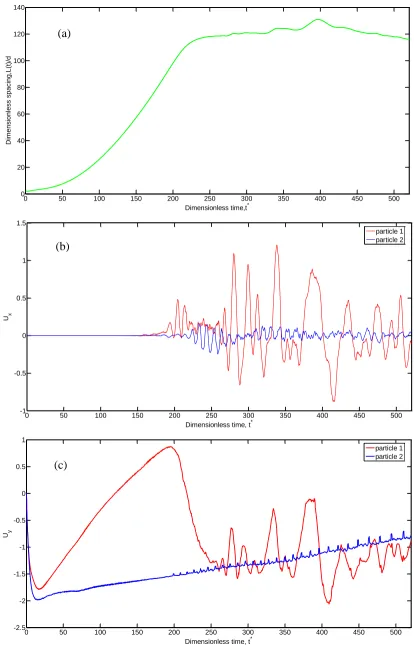
observed, as shown by Fig. 8. The curve of the relative distance between two hot
particles looks like a parabola before t*=220 and there is no DKT process. Thereafter,
the distance increases relatively slowly with fluctuations during 220<t*<396, and then
it begins to decrease. For the horizontal direction, settling velocities fluctuate,
especially for the trailing particle’s. Along the vertical direction, settling velocity of
the leading particle increases sharply to about 2 and then decreases slowly, and since
t*>200 it experiences a periodic fluctuation. For the trailing particle, it will be
vertically accelerated to about 1.8 and in succession decelerates sharply to 0. Then it
will be accelerated again to about 0.87 in the reversed direction. In succession,
similar processes are reproduced, i.e., the trailing particle decelerates to 0 and then
accelerates in reversed direction once again. As the trailing particle’s vertical velocity
approaches the leading’s, it fluctuates substantially: sometime it will move faster than
the leading one while the rest time it is slower than the leading one.
As mentioned above, the time evolution of velocities and distance of two hot
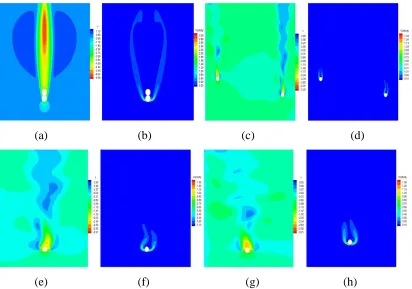
particles at Gr=2000 is extraordinary, we will try to reveal the reasons. As clearly
shown in Fig. 9(a, b), the hot upward stream induced by the leading particle impacts
strongly the movement of the trailing particle. This impacting force reduces the
vertical velocity of the trailing particle during 17<t*<194 (see Fig. 8(c)). As pointed
out by Fortes et al. [30], the sedimentation of two particles aligned vertical in a
Newtonian fluid was dynamically unstable to small disturbances and the asymmetric
wake induced by the small axial perturbations would destabilize the couple. As
illustrated in Gan et al. [4], the upward stream due to natural convection is unstable.
If the leading particle deviates slightly from the channel centre due to small
disturbances, the stream starts to oscillate and obtains a serpentine shape.
Consequently local pressure difference in the hot wake leads to the strong oscillations
of the trailing particle in the horizontal direction, and thus results in the trailing
particle shifting from the channel centre to right side (see Fig. 8(b), Fig. 9(c)). Since
during 194<t*<250 the force exerted by upward stream becomes weak, the trailing
particle accelerates downward again. Although the trailing particle migrates to the
right side, the flow field around the trailing particle is still affected by the upward
stream caused by the leading particle. Fig. 9(e, f) depict the flow characteristics at
t*=289.25. It is observed that upward stream pushes away the surrounding cold fluid
This may lead to the vertical velocity oscillations of the trailing particle with big
amplitude.
As shown in Fig. 9(f), upward stream due to the strong heat transfer and external
downward flow from particle sedimentation influence the motion of the leading
particle. In other words, temperature-induced buoyancy effect, as well as buoyancy
force and gravity force control the motion of settling particles. If upward forces
including temperature-induced buoyancy effect and buoyancy force exceed the
downward gravity, the leading particle slows down (see Fig. 8(c)). The periodic
oscillations occur, perhaps because of oscillations of the upward stream (see Fig.
9(f)).
In summary, the heat transfer affects the interaction between two hot particles
mainly via vortex shedding and upward stream. For low Gr (0-1000), with increasing
Gr, vortex shedding is suppressed and upward stream becomes vigorous.
Consequently DKT happens latter and persists longer, and both horizontal and
vertical distance between two hot particles decrease. Their settling velocities slows
down due to strong buoyancy effects. For high Gr (e.g. 2000), DKT disappears. Hot
upward stream is unstable due to strong natural convection. Thus oscillations of hot
upward stream induced by the leading particle leads to strong oscillations of the
trailing particle both in horizontal and vertical direction.
3.2 sedimentation of two cold particles
In this section, the effects of Gr on the behaviors of two cold particles settling in
infinite channel are investigated. Although this problem has been studied by Gan et al.
[4], many important aspects were omitted in their investigation, such as effects of the
walls and variation of Grashof numbers. These effects will be analyzed
comprehensively in this paper for the first time.
Fig. 10(a) gives the distance between two cold particles as a function of time under
various Gr. As expected, cold particles experience shorter tumbling stage and much
stronger repulsion force than their isothermal counterparts(namely Gr=0 here). It
should be stressed that at Gr=1000 the distance between two cold particles is much
bigger than that in the other scenarios. For Gr ≤ 1000, the oscillations of horizontal
and vertical velocities of two cold particles become stronger with increasing Gr. We
cold particles at Gr=1000. For t*>150 the horizontal velocities of both particles
experience similar and big oscillations around zero. Compared to their isothermal
counterparts (see Fig. 4(a)) in the vertical direction, the tumbling velocities are bigger
and for t*>150 the velocities oscillate more strongly. In addition, the tumbling
velocities keep increasing until the separating stage.
Fig. 10(c) depicts the horizontal and vertical distance between the two cold
particles at Gr=1000. It can be observed, after DKT process the horizontal distance
increases sharply up to about 25d and then oscillates around 25d. In the vertical
direction the distance decreases sharply due to drafting and then maintains constant
during the tumbling stage. In succession, the distance increases sharply during the
separating stage, and finally keeps about 4d-5d. Combining with Fig. 10(b), it should
be noted that strong horizontal velocity oscillations mainly result from repulsion
process.
As illustrated by Fig. 11(a), during the tumbling process, the two cold particles are
impacted by the downward stream. The connected-wake becomes long (see Fig.
11(b)), and it causes a upward stream encircling the downward stream at the rear of
the trailing particle. After separating stage, the stream oscillations and vortex
shedding behind cold particles lead to their velocities’ oscillations, as shown in Fig.
11(c, d).
As 1500≤Gr≤2000, both horizontal and vertical velocities experience more
significant oscillations. Here the case of Gr=2000 is taken as a representative. As
shown in Fig. 12(a), the horizontal velocities of the two cold particles experience
nearly synchronous and big-amplitude oscillations after separating stage. For the
vertical direction shown in Fig. 12(b), during tumbling stage the two cold particles’
velocities firstly increase sharply and then decrease quickly, and afterwards fluctuates
with gradually decreasing amplitude. After separating stage the vertical velocities
also experience oscillations. Fig. 13(a, b) show the distributions of vertical velocity,
vorticity magnitude of fluid field at t*=34.71 during tumbling period. From Fig. 13(b),
it is clearly observed that the long connected-wake breaks up. It may cause the
big-amplitude oscillations of vertical velocities of the two cold particles in the
tumbling process. After separating stage the two cold particles interact with each
other relatively weakly, and thus they settle in a similar way to one cold particle.
13(c, d), the distributions of vertical velocity and vorticity magnitude around the two
cold particles are relatively independent. As illustrated in Fig. 13(c), the downward
flows in the rear of the two cold particles oscillate and form a serpentine shape.
Consequently, the vertical velocities of the two cold particles experience strong
oscillations (see Fig. 12(b)). As expected, strong vortex shedding (see Fig. 13(d))
leads to oscillations of horizontal velocities of the two cold particles.
As discussed above, the influences of Gr on the interactions between two cold
particles are significant. With increasing Gr, the DKT happens earlier and persists
shorter generally, and the oscillations of horizontal and vertical velocities of two cold
particles strengthen. After separating stage, downward streams’ oscillations in the
rear of the two cold particles mainly contribute to oscillations of vertical velocities of
two cold particles. For Gr≥1500, long connected-wake breaking up perhaps generates
the big-amplitude oscillations of vertical velocities of the two cold particles in the
tumbling process.
3.3 sedimentation of one hot and one cold particle
In this section, the behaviors of one hot and one cold particle settling in Newtonian
fluid with various Gr are investigated for the first time. Here, we set the hot particle
above the cold particle initially.
As shown in Fig. 14, the tumbling duration of two particles increases with
increasing Gr generally. The DKT with various Gr happens nearly at the same instant,
but at Gr>0 it persists longer. At Gr=500, after separating stage the distance between
the two particles is smaller than that at Gr=0. While for high Gr (namely 1000, 1500),
the distance between the two particles increases violently after separating stage
compared to its low Gr counterpart. Through the present study, it is revealed for the
first time that there is a critical Gr for the double sedimentation particles.
Fig. 15 gives the time evolution of velocities of the two particles at Gr=500, 1000,
1500. The horizontal velocity of the hot particle experiences small oscillations, while
the horizontal velocity of the cold particle undergoes strong and periodic oscillations.
On the contrary to the sedimentation of two hot particles, with Gr increasing, after
separating stage the horizontal velocities of the two particles oscillate strongly,
particularly for the leading cold particle. For the vertical velocity, with Gr increasing,
to illustrate the variation of the vertical velocity. After separating stage the vertical
velocity of the cold particle increases to a high value, and then experiences a
deceleration process during which the velocity is reduced to about 2.0, and finally
undergoes small-amplitude oscillations. For the hot particle, after separating stage its
settling velocity decreases slowly due to heat-induced effects. This can explain the
phenomenon that for Gr=1000, 1500 the distance between the two particles increases
sharply after separating stage.
When Gr=2000, a different phenomenon happens. It is observed in Fig. 16(a) that
as the distance between the two particles increases to about 50d, it starts to decrease.
As shown in Fig. 16(b), their horizontal velocities oscillate strongly, particularly for
the hot particle’s. For the vertical direction, during tumbling process, their velocities
firstly increase, then decrease sharply and in succession oscillate with small
amplitude. After tumbling stage, the cold particle firstly decelerates and then
accelerates, and finally its settling velocity experiences small oscillations. While for
the hot particle’s vertical velocity, after tumbling stage, it fluctuates and since t*>250
it experiences strong abnormal oscillations. The hot particle’s behavior is similar to
that of the trailing particle of two hot particles’ sedimentation at Gr=2000. Fig. 17(a,
b) plots distributions of vertical velocity and vorticity magnitude of fluid field at
t*=46.28 during the tumbling process. Stream above the long body is fragmentary,
which is believed to lead to the oscillations of tumbling velocity.
After tumbling stage the leading cold particle’s horizontal velocity experiences
oscillations at high frequency due to vortex shedding, as shown in Fig. 17(d, f). As
illustrated in Fig. 17(c), the stream above the cold particle oscillates, which leads to
the oscillations of the cold particle’s vertical velocity. Stream oscillations together
with the shedding vortex leads to many upward flow regions. When the trailing hot
particle passes through these regions, it decelerates. Thus the hot particle
experiences repeatedly accelerating and decelerating. Since t*>250 vortex shedding
happens, shown in Fig. 17(f-2). Consequently, the horizontal velocity of the hot
particle also oscillates more strongly.
In summary, as the hot particle is influenced by the cold wake from the cold
particle, completely different phenomenons appear. For Gr<1000, the interactions
between the hot particle and the cold particle behave like these for two hot particles,
the natural convection strengthens, causing the obvious velocity distinction between
the hot and cold particle and thus sharply increasing distance between them both in
horizontal and vertical direction. For Gr≥2000, vortex shedding and stream
oscillations behind the cold particle occur significantly, leading to strong oscillations
of the cold particle’s velocity. This also leads to the hot particle’s abnormal
oscillations.
3.4 Comparison between three cases
As discussed above, the behaviors of two settling particles in the three cases have
obvious distinctions. Case 1, 2, 3 indicate sedimentation of two hot, two cold, one hot
and one cold particle respectively. In addition, we add case 0 to represent the case of
two isothermal particles (namely Gr=0).
When Gr<1000, repulsion process becomes weak in case 1 and 3, and becomes
strong in case 2, as shown in Fig. 18(a). Comparing case 1 with case 3, they are
similar except that suppressed effect on repulsion process in case 1 is stronger than in
case 3. Fig. 18(b) gives variations of settling velocities in case 2 at Gr=500. During
tumbling process the settling velocities increase slowly, and meantime the leading
particle’s velocity undergoes fluctuations. Referring to Fig. 4(b) and Fig. 15(a), this
result is very different from that for two other cases. In addition, one can observe that
after separating stage, horizontal velocity oscillations for cold particles are much
stronger than for hot particles. These differences among the three cases are a result of
thermal effects on vortex shedding behind settling particles.
When Gr≥1000, the differences among the three cases are more significant than
theirs low Gr counterpart. We take Gr=1000 as a representative to explain it. Fig.
19(a) depicts the comparison of dimensionless distance of two particles among four
cases. DKT between the two cold particles happens earliest and persists shortest,
while for the two hot particles it happens latest and persists longest. We can express
this ast2* t0* t3* t1*, t2* t0* t3* t1*, where t
*, Δt* indicate the beginning
instant and persisting duration of DKT respectively. After separating stage, the
distance for the case 1 increases relatively slowly due to small velocity distinction,
while the distance for the case 3 increases relatively fast due to large velocity
distinction. The distance for the case 2 experiences obvious oscillations around 25d.
settle slowest and particles in case 2 settle fastest. Meanwhile particles in case 3 settle
in the almost same way with the case 0. For the horizontal distance between the two
particles, the distance for the case 2 is maximum and the distance for the case 1 is
minimum.
Fig. 20(a-f) depict vertical velocity and vorticity magnitude contours of fluid field
for the three cases at t*=57.85. As illustrated by Fig. 20(b, e), the wake of two cold
particles becomes very long and it encircles a large region, leading to a large region
of upward stream. The wake of two hot particles is short and thus the upward stream
region narrows, as shown in Fig. 20(a, d). These for the case 3 are exactly in the
moderate level. Since the tumbling velocity satisfies Ut1Ut3Ut2 in which
superscripts indicate case numbers (refer to Fig. 4(c), Fig. 10(b) and Fig. 15(b)), the
velocity of downward fluid in the rear of the two particles also matches the law. As
shown in Fig. 20(b, e), it is noted that the maximum velocity region for the case 2 is
located in the upside of the downward stream region.
When the interactions between the two particles achieve the relative state (t*>150),
the vortexes and stream behind them for the three cases are also different. Fig.
20(g-m) plot the flow feature for three cases at t*=231.4. For case 1 in Fig. 20(g, j),
the upward streams and vortexes behind the two hot particles are relatively stable.
Thus the oscillations of two hot particles’ horizontal and vertical velocities are mild
(see Fig. 4(c)). For case 2 in Fig. 20(h, k), the streams behind two cold particles are
unstable and oscillate strongly, and strong vortex shedding even results in forming of
upward region. Consequently strong oscillations of two cold particles take place in
both direction (see Fig. 10(b)). For case 3 in Fig. 20(i, m), the stream and vortex
behind the hot particle is similar to that in the case 1. While for the cold particle, the
vortex shedding happens relatively mildly. Thus the oscillations of the cold particle
are milder than that in the case 2.
When Gr gets up to 1500 and above, completely different phenomenons occur
among the three cases. We take the Gr=2000 as a representative to explain it in detail.
For two hot particles at Gr=2000 (refer to Fig. 8(a)), DKT process disappears. As
upward stream induced by the leading particle impacts the trailing particle, drafting
process never happens and the trailing particle even moves upwardly for a period.
For two cold particles at Gr=2000 (refer to Fig. 12), DKT happens. After separating
experience oscillations due to unstable stream behind them. For the one hot and one
cold particle at Gr=2000 (refer to Fig. 16), DKT also happens. During tumbling
process, like somewhat the case of two cold particles, their settling velocities also
experience oscillations at almost constant amplitude. While after separating stage,
like somewhat the case of two hot particles, the trailing hot particle experiences
abnormal oscillations in both direction. Meantime, distance between them always
increases due to their settling velocity distinction.
In summary, differences of interactions between two particles among the three
cases are significant. For low Gr (e.g. 500), the differences among the three cases are
a result of thermal effects on vortex shedding behind settling particles. The
interactions between the hot particle and the cold particle seem like these between
two hot particles, but heat effects for the former are little smaller than for the latter.
For middle Gr (e.g. 1000), after separating stage cold particles settle with oscillations
and hot particles decelerate slowly with periodic oscillations. Obvious velocity
difference is observed between the hot and the cold particle. For high Gr (e.g. 2000),
vortex shedding and stream are vigorous. For two hot particles, DKT disappears. For
the other two cases, DKT will happen.
4 Conclusion
The heat transfer induced by temperature difference between particles will
influence the behavior of gas-solid flow significantly. In this work three cases are
investigated: (1) sedimentation of two hot particles, (2) sedimentation of two cold
particles and (3) sedimentation of one hot particle and one cold particle. Through our
analysis, we can draw the following conclusions:
1) The Gr affects the interaction between two hot particles mainly via vortex
shedding and upward stream. For low Gr, DKT happens latter and persists longer,
and both horizontal and vertical distance between two hot particles decrease. Their
settling velocities slows down due to strong buoyancy effects. At Gr=1500, two hot
particles experience not only a DKT process but also an extra drafting process.
Especially for Gr=2000, DKT disappears. Moreover, oscillations of unstable upward
stream induced by the leading particle leads to abnormal oscillations of the trailing
particle both in horizontal and vertical direction.
persists shorter generally, and the oscillations of horizontal and vertical velocities of
the two cold particles become strong. Repulsion process between them becomes
strongest at about Gr=1000. At high Gr (e.g. Gr=2000), their tumbling velocities
experience sharply reducing process with oscillations.
3) For the case of one hot and one cold particle, for Gr<1000, extended tumbling
process and suppressed repulsion process are observed. For 1000≤Gr<1500, the
obvious velocity distinction between the hot and cold particle and thus sharply
increasing distance between them in both horizontal and vertical direction are
observed. For Gr≥1500, the two particles’ velocities experience abnormal
oscillations.
4) Differences of interaction mechanism between two particles among the three
cases are significant. For low Gr (e.g. 500), the interaction mechanism between the
hot particle and the cold particle seems like these between two hot particles, but heat
effects for the former are little smaller than for the latter. For middle Gr (e.g. 1000),
after separating stage cold particles’ velocities experience strong oscillations and hot
particles’ velocities decrease slowly with periodic oscillations. For high Gr (e.g.
2000), DKT disappears in the case of two hot particles but it appears in the two other
cases.
Acknowledgments
This work has received funding from the Universidad Carlos III de Madrid, the
European Union’s Seventh Framework Programme for research, technological
development and demonstration under grant agreement No. 600371, el Ministerio de
Economía y Competitividad (COFUND2014-51509), el Ministerio de Educación,
cultura y Deporte (CEI-15-17) and Banco Santander. We also acknowledge the
support from the British Newton Alumni Fellowship Scheme, the National Natural
Science Foundation of China (Grant No. 51176061).
Reference
[1]K.O.L.F. Jayaweera, B.J. Mason, G.W. Slack, The behaviour of clusters of spheres falling in a
viscous fluid Part 1. Experiment, J. Fluid Mech. 20 (1964) 121-128.
[2]D.D. Joseph, Y.J. Liu, M. Poletto, J. Feng, Aggregation and dispersion of spheres falling in
viscoelastic liquids, J. Non Newtonian Fluid Mech. 54 (1994) 45-86.
[3]J. Wu, R. Manasseh, Dynamics of dual-particles settling under gravity, Int. J. Multiphase Flow
24 (1998) 1343-1358.
with thermal convection, Journal of Fluid Mechanics 481 (2003) 385-411.
[5]Zhi-Gang Feng, Efstathios E. Michaelides, Heat transfer in particulate flows with Direct
Numerical Simulation (DNS), International Journal of Heat and Mass Transfer 52 (2009)
777-786.
[6]Zahra Hashemi, Omid Abouali, Reza Kamali, Three dimensional thermal Lattice Boltzmann
simulation of heating/cooling spheres falling in a Newtonian liquid, International Journal of
Thermal Sciences 82 (2014) 23-33.
[7]Henrik Ström, Srdjan Sasic, Detailed simulations of the effect of particle deformation and
particle-fluid heat transfer on particle-particle interactions in liquids, Procedia Engineering 102
(2015) 1563-1572.
[8]Hao Zhang, Aibing Yu, Wenqi Zhong, Yuanqiang Tan, A combined TLBM-IBM-DEM scheme
for simulating isothermal particulate flow in fluid, International Journal of Heat and Mass
Transfer 91 (2015) 178-189.
[9]Hao Zhang, Haizhuan Yuan, et al., Particulate immersed boundary method for complex
fluid-particle interaction problems with heat transfer, Computers and Mathematics with
Applications 71 (2016) 391-407
[10] Chuansheng Cao, Sheng Chen, et al., Simulating the interactions of two freely settling
spherical particles in Newtonian fluid using lattice-Boltzmann method, Applied Mathematics
and Computation 250 (2015) 533-551.
[11] Bo Yang, Sheng Chen, Chuansheng Cao, Zhaohui Liu, Chuguang Zheng, Lattice Boltzmann
simulation of two cold particles settling in Newtonian fluid with thermal convection,
International Journal of Heat and Mass Transfer 93 (2016) 477-490.
[12] Y.H. Qian, Dominique d’Humières, Pierre Lallemand, Lattice BGK models for
Navier-Stokes equation, in: EPL (Europhys. Lett.) 17 (6) (1992) 479.
[13] A.J.C. Ladd, Sedimentation of homogeneous suspensions of non-Brownian spheres, Phys.
Fluids 9 (1997) 491-499.
[14] C.K. Aidun, L. Yannan, E.J. Ding, Direct analysis of particulate suspensions with inertia
using the discrete Boltzmann equation, J. Fluid Mech. 373 (1998) 287-311.
[15] Peskin CS, Flow patterns around heart valves: a numerical method, Journal of
Computational Physics 10 (1972) 251-271.
[16] Z.-G. Feng, E.E. Michaelides, The immersed boundary-lattice Boltzmann method for solving
fluid–particles interaction problems, J. Comput. Phys. 195 (2) (2004) 602-628.
[17] Z.-G. Feng, E.E. Michaelides, Proteus: a direct forcing method in the simulations of
particulate flows, J. Comput. Phys. 202 (1) (2005) 20-51.
[18] Shin K. Kang, Yassin A. Hassan, A comparative study of direct-forcing immersed
boundary-lattice Boltzmann methods for stationary complex boundaries, Int. J. Numer. Meth.
Fluids 66 (2011) 1132-1158.
Boltzmann method, Computers & Fluids 49 (2011) 36-45.
[20] Delouei, A. A., Nazari, M., Kayhani, M. H., & Succi, S., Non-Newtonian unconfined flow
and heat transfer over a heated cylinder using the direct-forcing immersed boundary–thermal
lattice Boltzmann method, Physical Review E, 89 (5) (2014) 053312.
[21] Delouei, A. A., Nazari, M., Kayhani, M. H., & Succi, S., Immersed boundary–thermal
lattice Boltzmann methods for non-Newtonian flows over a heated cylinder: a comparative
study. Communications in Computational Physics, 18 (02) (2015) 489-515.
[22] Delouei, A. Amiri, M. Nazari, M. H. Kayhani, S. K. Kang, and S. Succi., Non-Newtonian
particulate flow simulation: A direct-forcing immersed boundary–lattice Boltzmann
approach, Physica A: Statistical Mechanics and its Applications, 447 (2016) 1-20.
[23] Delouei, A. Amiri, M. Nazari, M. H. Kayhani, and G. Ahmadi., A non-Newtonian direct
numerical study for stationary and moving objects with various shapes: An immersed
boundary–Lattice Boltzmann approach, Journal of Aerosol Science, 93 (2016) 45-62.
[24] P. Lallemand, L.S. Luo, Theory of the lattice Boltzmann method: dispersion, dissipation,
isotropy, Galilean invariance, and stability, Phys. Rev. E 61 (2000) 6546-6562.
[25] F. Higuera, S. Succi, R. Benzi, Lattice gas dynamics with enhanced collisions, Europhys.
Lett. 9 (1989) 345.
[26] Zhaoli Guo, Chuguang Zheng, Analysis of lattice Boltzmann equation for microscale gas
flows: Relaxation times, boundary, conditions and the Knudsen layer, International Journal of
Computational Fluid Dynamics 22 (7) (2008) 465-473.
[27] Guo ZL, Zheng CG, Shi BC, Discrete lattice effects on the forcing term in the lattice
Boltzmann method, Phys Rev E 65 (4) (2002):046308.
[28] R. Glowinski, T.W. Pan, T.I. Hesla, D.D. Joseph, J. Périaux, A fictitious domain approach to
the direct numerical simulation of incompressible viscous flow past moving rigid bodies:
application to particulate flow, J. Comput. Phys. 169 (2001) 363-426.
[29] Howard H. Hu, Daniel D. Joseph, Experiments and direct simulations of fluid particle
motions, Video J . Engng Res. 2 (1992) 17-24.
[30] A.F. Fortes, D.D. Joseph, T.S. Lundgren, Nonlinear mechanics of fluidization of beds of
Figures
(a) (b)
Fig. 1 Schematic figure of the bilinear and linear interpolations for exterior sharp interface
scheme: (a) bilinear interpolation, and (b) linear interpolation.
b
2
3 y
x
4
d
d d
b f ff
0 50 100 150 200 250 300 350 400 0
2 4 6 8 10 12 14
Dimensionless time,t*
D
im
e
n
si
o
n
le
ss sp
a
ci
n
g
,L
(t
)/
d
[image:24.593.99.496.93.302.2]Gr=0 Gr=500 Gr=1000
0 100 200 300 400 -2.5 -2 -1.5 -1 -0.5 0 0.5 1 1.5
Dimensionless time, t*
Ux
particle 1 particle 2
0 100 200 300 400 -4 -3.5 -3 -2.5 -2 -1.5 -1 -0.5 0
Dimensionless time, t*
Uy
particle 1 particle 2
0 100 200 300 400 -2 -1.5 -1 -0.5 0 0.5 1
Dimensionless time, t*
Ux
particle 1 particle 2
0 100 200 300 400 -4 -3.5 -3 -2.5 -2 -1.5 -1 -0.5 0
Dimensionless time, t*
Uy
particle 1 particle 2
74.6 84.3
0 100 200 300 400 -1 -0.5 0 0.5 1 1.5 2
Dimensionless time, t*
Ux
particle 1 particle 2
0 100 200 300 400 -3.5 -3 -2.5 -2 -1.5 -1 -0.5 0
Dimensionless time, t*
Uy
[image:25.593.92.492.67.722.2]particle 1 particle 2
Fig. 4 Time evolution of horizontal velocity (left) and vertical velocity (right) of two hot
particles at (a) Gr=0; (b) Gr=500 and (c) Gr=1000. (a)
(b)
0 100 200 300 400 -1.5 -1 -0.5 0 0.5 1 1.5
Dimensionless time, t*
a n g u la r ve lo ci ty (a)
0 100 200 300 400 -1.5 -1 -0.5 0 0.5 1 1.5
Dimensionless time, t*
a n g u la r ve lo ci ty (b)
0 100 200 300 400 -1.5 -1 -0.5 0 0.5 1 1.5
Dimensionless time, t*
[image:26.593.107.501.94.301.2]a n g u la r ve lo ci ty (c) particle 1 particle 2 particle 1 particle 2 particle 1 particle 2
Fig. 5 Time evolution of angular velocities of two hot particles at (a) Gr=0; (b) Gr=500 and
Gr=1000.
(a) (c) (e)
(b) (d) (f)
Fig. 6 Sedimentation of two hot particles at various Gr at t*=57.85. (a, b), (c, d,) and (e, f,) are
allocated for the cases of Gr=0, 500, 1000 respectively. (a, c, e) vertical velocity contours, (b, d, f)
[image:27.593.90.500.89.405.2]0 100 200 300 400 500 -1 -0.5 0 0.5 1 1.5 2
Dimensionless time, t*
Ux
particle 1 particle 2
0 100 200 300 400 500 -3.5 -3 -2.5 -2 -1.5 -1 -0.5 0
Dimensionless time, t*
Uy
particle 1 particle 2
0 100 200 300 400 500 -7 -6 -5 -4 -3 -2 -1 0 1
Dimensionless time,t*
Dx
0 100 200 300 400 500 -4 -3 -2 -1 0 1 2 3
Dimensionless time,t*
Dy
Fig. 7 Time evolution of (a) dimensionless distance, (b) settling velocity, and (c) distance
component of two hot particles at Gr=1500. The two red dotted lines indicate the time period
within which another drafting process happens. Note that in (c) Dx>0, Dy>0 indicate the
0 100 200 300 400 500
1 2 3 4 5 6 7
Dimensionless time,t*
[image:28.593.97.496.90.695.2]0 50 100 150 200 250 300 350 400 450 500 -1
-0.5 0 0.5 1 1.5
Dimensionless time, t*
Ux
particle 1 particle 2
0 50 100 150 200 250 300 350 400 450 500 -2.5
-2 -1.5 -1 -0.5 0 0.5 1
Dimensionless time, t*
Uy
particle 1 particle 2
Fig. 8 Time evolution of (a) dimensionless distance, (b) horizontal velocity, and (c) vertical
velocity of two hot particles at Gr=2000.
0 50 100 150 200 250 300 350 400 450 500 0
20 40 60 80 100 120 140
Dimensionless time,t*
D
im
e
n
si
o
n
le
ss sp
a
ci
n
g
,L
(t
)/
d
(a)
(b)
[image:29.593.90.504.69.714.2](a) (c) (e)
[image:30.593.90.503.89.406.2]
(b) (d) (f)
Fig. 9 Vertical velocity, vorticity magnitude contours of fluid field around the two hot particles at
Gr=2000. (a, b) at t*=57.85, (c, d) at t*=231.4, (e, f) at t*=289.25. Particularly, (c, e), (d, f) are
the figures of local velocity region around the trailing particle and the leading particle
0 50 100 150 200 250 300 350 400 0 5 10 15 20 25 30
Dimensionless time,t*
D im e n si o n le ss sp a ci n g ,L (t )/ d Gr=0 Gr=500 Gr=1000 Gr=1500 Gr=2000
0 100 200 300 400
-2.5 -2 -1.5 -1 -0.5 0 0.5 1 1.5 2
Dimensionless time, t*
U x
particle 1 particle 2
0 100 200 300 400
-4.5 -4 -3.5 -3 -2.5 -2 -1.5 -1 -0.5 0
Dimensionless time, t*
U y
particle 1 particle 2
Fig. 10 Sedimentation of two cold particles. (a) Comparisons of dimensionless spacing of two
cold particles at various Gr. (b) settling velocity, (c) horizontal and vertical distance of the two
cold particles at Gr=1000 (a, b indicate the tumbling, separating stage respectively).
0 100 200 300 400 -5 0 5 10 15 20 25 30
Dimensionless time,t*
Dx
0 100 200 300 400 -10 -8 -6 -4 -2 0 2 4
Dimensionless time,t*
[image:31.593.95.496.71.691.2](a) (b) (c) (d)
(e) (f) (g) (h)
Fig. 11 Distributions of (a, c) vertical velocity and (b, d) vorticity magnitude of fluid field at
Gr=1000. (a, b) at t*=57.85, (c, d) at t*=231.4. Note that (e, f) and (g, h) are the magnifying
figures of vertical velocity and vorticity magnitude around the trailing and the leading particle
[image:32.593.92.504.70.359.2]Fig. 12 Sedimentation of two cold particles at Gr=2000. (a) horizontal and (b) vertical
velocities of two cold particles as a function of time.
0 50 100 150 200 250 300 350 400 -1.5
-1 -0.5 0 0.5 1 1.5 2
Dimensionless time, t*
Ux
particle 1 particle 2
(a)
0 50 100 150 200 250 300 350 400 -4
-3.5 -3 -2.5 -2 -1.5 -1 -0.5 0
Dimensionless time, t*
Uy
particle 1 particle 2
tumbling separating
[image:33.593.92.504.71.502.2](a) (b) (c) (d)
Fig. 13 Distributions of (a, c) vertical velocity, (b, d) vorticity magnitude of fluid field at Gr=2000.
0 50 100 150 200 250 300 350 400 0
5 10 15 20 25 30 35
Dimensionless time,t*
D
im
e
n
si
o
n
le
ss sp
a
ci
n
g
,L
(t
)/
d
[image:35.593.92.485.72.279.2]Gr=0 Gr=500 Gr=1000 Gr=1500
0 100 200 300 400 -2.5 -2 -1.5 -1 -0.5 0 0.5 1 1.5
Dimensionless time, t*
U x
particle 1 particle 2
0 100 200 300 400
-4 -3.5 -3 -2.5 -2 -1.5 -1 -0.5 0
Dimensionless time, t*
U y
particle 1 particle 2
0 100 200 300 400
-1.5 -1 -0.5 0 0.5 1 1.5 2
Dimensionless time, t*
U x
particle 1 particle 2
0 100 200 300 400
-4 -3.5 -3 -2.5 -2 -1.5 -1 -0.5 0
Dimensionless time, t*
U y
particle 1 particle 2
0 100 200 300 400
-2 -1.5 -1 -0.5 0 0.5 1 1.5
Dimensionless time, t*
U x
particle 1 particle 2
0 100 200 300 400
-4 -3.5 -3 -2.5 -2 -1.5 -1 -0.5 0
Dimensionless time, t*
U y
[image:36.593.91.494.66.725.2]particle 1 particle 2
Fig. 15 Time evolution of horizontal velocity (left) and vertical velocity (right) of one hot and
cold particle at (a) Gr=500; (b) Gr=1000 and (c) Gr=1500. (a)
(b)
0 50 100 150 200 250 300 350 400 450 0 10 20 30 40 50 60
Dimensionless time,t*
D im e n s io n le s s s p a c in g ,L (t )/ d
0 50 100 150 200 250 300 350 400 450
-2 -1.5 -1 -0.5 0 0.5 1 1.5 2
Dimensionless time, t* U x
particle 1 particle 2
0 50 100 150 200 250 300 350 400 450
-4 -3.5 -3 -2.5 -2 -1.5 -1 -0.5 0
Dimensionless time, t* U y
[image:37.593.94.505.92.641.2]particle 1 particle 2
Fig. 16 Time evolution of (a) dimensionless distance, (b) horizontal velocity, and (c) vertical
velocity of one hot particle and one cold particle at Gr=2000. (a)
(b)
(a) (b) (c) (d)
[image:38.593.92.504.69.352.2](e-1) (e-2) (f-1) (f-2)
Fig. 17 Distributions of (a, c, e) vertical velocity and (b, d, f) vorticity magnitude of fluid field at
Gr=2000 at t*=46.28, 185.12, 370.24 respectively. Since flow field is much large, we take the
regions around the two particles to study. Here, red and white circles indicate the hot and cold
0 50 100 150 200 250 300 350 400 0 2 4 6 8 10 12 14 16
Dimensionless time,t*
D im e n s io n le s s s p a c in g ,L (t )/ d case 0 case 1 case 2 case 3
0 100 200 300 400
-2.5 -2 -1.5 -1 -0.5 0 0.5 1 1.5
Dimensionless time, t*
U x
particle 1 particle 2
0 100 200 300 400
-4.5 -4 -3.5 -3 -2.5 -2 -1.5 -1 -0.5 0
Dimensionless time, t*
U y
particle 1 particle 2
Fig. 18 (a) Comparison of two settling particles in the four cases at Gr=500. (b) Time evolution of
horizontal velocity and vertical velocity of two cold particles at Gr=500. (a)
[image:39.593.93.503.71.496.2]0 50 100 150 200 250 300 350 400 0
5 10 15 20 25 30
Dimensionless time,t*
D
im
e
n
s
io
n
le
s
s
s
p
a
c
in
g
,L
(t
)/
d
Case 0 Case 1 Case 2 Case 3
[image:40.593.89.504.72.518.2]case 0 case 1 case 2 case 3
Fig. 19 Comparison of (a) dimensionless spacing and (b) trajectories of two settling particles in
the four cases at Gr=1000. (a)
(a) (b) (c)
(d) (e) (f)
(g) (h) (i)
[image:41.593.89.504.65.709.2](j) (k) (m)
Fig. 20 Vertical velocity, and vorticity magnitude contours of fluid field: (a, d, g, j) for case 1, (b,