JSLHR
Research Article
Automatic Speech Recognition Predicts
Speech Intelligibility and Comprehension
for Listeners With Simulated
Age-Related Hearing Loss
Lionel Fontan,a,bIsabelle Ferrané,bJérôme Farinas,bJulien Pinquier,b Julien Tardieu,cCynthia Magnen,cPascal Gaillard,d
Xavier Aumont,aand Christian Füllgrabee
Purpose:The purpose of this article is to assess speech processing for listeners with simulated age-related hearing loss (ARHL) and to investigate whether the observed performance can be replicated using an automatic speech recognition (ASR) system. The long-term goal of this research is to develop a system that will assist audiologists/ hearing-aid dispensers in the fine-tuning of hearing aids. Method:Sixty young participants with normal hearing listened to speech materials mimicking the perceptual consequences of ARHL at different levels of severity. Two intelligibility tests (repetition of words and sentences) and 1 comprehension test (responding to oral commands by moving virtual objects) were administered. Several language
models were developed and used by the ASR system in order to fit human performances.
Results:Strong significant positive correlations were observed between human and ASR scores, with coefficients up to .99. However, the spectral smearing used to simulate losses in frequency selectivity caused larger declines in ASR performance than in human performance.
Conclusion:Both intelligibility and comprehension scores for listeners with simulated ARHL are highly correlated with the performances of an ASR-based system. In the future, it needs to be determined if the ASR system is similarly successful in predicting speech processing in noise and by older people with ARHL.
A
ge-related hearing loss (ARHL)—the progressive decline with increasing age of hearing sensitivity, as measured by an audiometric assessment— affects more than 45% of the population over the age of 48 years (Cruickshanks et al., 1998). The most common complaint of listeners with ARHL is the difficulty to under-stand speech, especially in noisy environments (e.g., CHABA, 1988). In part, this difficulty results directly from the loss in audibility of the speech signal, but it is also due toadditional deficits in suprathreshold auditory processing, such as loudness recruitment, loss in frequency selectivity (e.g., Nejime & Moore, 1997), and reduced sensitivity to temporal–fine structure and temporal-envelope information (e.g., Füllgrabe, 2013; Füllgrabe, Moore, & Stone, 2015). When left uncorrected, speech-perception difficulties can compromise interindividual communication, resulting in various negative consequences for the affected person, such as social isolation (e.g., Strawbridge, Wallhagen, Shema, & Kaplan, 2000), depression (e.g., Gopinath et al., 2009), and accelerated cognitive decline (e.g., Lin et al., 2013).
Currently, the standard treatment for ARHL is digital hearing aids (HAs), providing amplification in a number of frequency channels in order to restore the audibility of sounds. However, up to 40% of the listeners fitted with HAs never or rarely use their devices (Knudsen, Öberg, Nielsen, Naylor, & Kramer, 2010). One explanation for this high rejection rate might be the quality of HA fitting, resulting in suboptimal speech-intelligibility benefits.
aArchean Technologies, Montauban, France bIRIT - Université de Toulouse, France
cMSHS-T (USR 3414), Université de Toulouse, CNRS, France dCLLE (UMR 5263), Université de Toulouse, CNRS, France eMedical Research Council Institute of Hearing Research, School of Medicine, The University of Nottingham, Nottinghamshire, UK Correspondence to Lionel Fontan: lfontan@archean.fr Editor: Julie Liss
Associate Editor: Bharath Chandrasekaran Received June 24, 2016
Revision received February 10, 2017 Accepted March 14, 2017
https://doi.org/10.1044/2017_JSLHR-S-16-0269
Traditionally, speech perception is measured by deter-mining the percentage of speech items (e.g., words) that are correctly identified by the listener. However, a growing number of authors distinguish between speech intelligibility and speech comprehension; intelligibility tests focus on the perception of speech units, whereas speech comprehen-sion tests aim at quantifying the degree to which listeners can interpret the meaning of spoken messages in a commu-nication context (e.g., Fontan, Tardieu, Gaillard, Woisard, & Ruiz, 2015; Hustad, 2008; Wilson & Spaulding, 2010). Intelligibility and comprehension measures may be thought of as complementary because they provide different insights into speech communication. Intelligibility tests yield sensitive and reproducible scores that are mainly dependent on the integrity of the acoustic information present in speech signals. In contrast, the contextual information present in compre-hension tests allows listeners to compensate for losses of acoustic information in the speech signal through top-down cognitive processes. Therefore, comprehension scores are less sensitive to small degradations of the speech signal (Lindblom, 1990). They also show a better external validity because they involve processes that are used in everyday communication (Fontan, 2012; Fontan, Gaillard, & Woisard, 2013; Fontan, Tardieu, et al., 2015). Thus, the two kinds of measures might be relevant in professional contexts for which the evaluation of both speech signal transfer and communicative performance is needed. Indeed, it has been shown that performance on one test does not strongly predict performance on the other (Fontan, Tardieu, et al., 2015; Smith, 1992; Smith & Nelson, 2008).
From a practical perspective, both intelligibility and comprehension tests are fairly time consuming, which might limit their clinical use, for example, for the fitting of HAs. In France, audiologists/HA dispensers generally establish speech-processing abilities of their patients/clients by asking them to repeat lists of words (such as those developed by Fournier, 1951). Either a global intelligibility score, corre-sponding to the percentage of correctly identified words, or the Speech Reception Threshold (SRT), corresponding to the speech level required to obtain 50% correctly identified words, is calculated. In order to establish those HA settings yielding optimal speech intelligibility, the word identification task has to be repeated for each combination of HA settings. Such prolonged testing can result in increased levels of fatigue in the generally older patients/clients, leading to lower identification performance.
Moreover, it has been shown that speech intelligibility scores depend on the listener’s familiarity with the speech material (e.g., Hustad & Cahill, 2003). Hence, in theory, speech material should only be used once with the same patient/client, thus limiting the number of combinations of HA settings that can be tested.
To overcome these issues, automatic speech recogni-tion (ASR) could be used to predict speech-processing per-formance. Indeed, ASR systems have been shown to yield good predictions of human intelligibility and comprehension performance of disordered speech by listeners with normal hearing (e.g., Fontan, Pellegrini, Olcoz, & Abad, 2015;
Maier et al., 2009; Schuster et al., 2006). However, to the best of the authors’knowledge, this is the first time that an ASR system is used to predict speech intelligibility and com-prehension performance in listeners with simulated ARHL.
Context and Objective of the Present Study
This study is part of a larger research project bringing together language and computer scientists and ear, nose, and throat specialists.1The long-term goal of this project is to develop a clinical tool allowing audiologists/HA dis-pensers to predict speech intelligibility and comprehension for listeners experiencing ARHL in order to facilitate and improve HA fitting. More specifically, the system to be developed would allow recording speech stimuli (e.g., lists of words) in the patient’s ear canal near the eardrum, both when wearing a HA and without a HA. The recorded speech is then processed in order to mimic the perceptual consequences of the hearing loss experienced by the patient/ client, based on his/her auditory data (e.g., audiogram). The resulting audio signals are then fed to an ASR system that tries to recognize the original speech stimuli. The ASR results (e.g., word error rate [WER]; phonological distances between stimuli and ASR results) and the associated confi-dence scores are used to predict the intelligibility and com-prehension scores human listeners would obtain in the same conditions.As a first step to reach this goal, several experiments were conducted to study the ability of an ASR system to predict intelligibility and comprehension observed in young participants with normal hearing who are listening to speech processed to simulate ARHL at various levels of severity. This experimental design allowed the same stimuli to be presented to the human listeners and to the ASR system. In addition, it was reasoned that the use of young listeners would reduce the influence of individual differences in cog-nitive functions (such as working memory) on speech per-ception (Füllgrabe & Rosen, 2016b) that has been found in older listeners (e.g., Füllgrabe et al., 2015; Füllgrabe & Rosen, 2016a).
Method
Assessment of Human Intelligibility
and Comprehension Scores
Speech Material
Word and sentence materials.The material used for the intelligibility tests consisted of 60 words (six lists of 10 words), taken from the intelligibility test developed by Fournier (1951) and widely used by French audiologists/HA dispensers, and of 60 sentences (three lists of 20 sentences),
1
taken from the French version of the Hearing in Noise Test (HINT; Vaillancourt et al., 2005). Word lists exclusively contained disyllabic masculine nouns preceded by the French definite article“le.”Sentences consisted of various but rather simple syntactic structures forming single assertive clauses.
The material used for the comprehension test con-sisted of 30 imperative sentences asking the listener to move virtual objects presented on a computer screen via a click-and-drag action with the computer mouse. These oral com-mands all matched the following lexico-syntactic pattern:
Mettez[Object 1] [position] [Object 2] (Move [Object 1] [position] [Object 2]),
where [Object 1] and [Object 2] corresponded to mono- or polysyllabic nouns, and [position] referred to one out of the four spatial prepositions:à droite de(“to the right of”),à gauche de(“to the left of”),au-dessus de(“above”), and au-dessous de(“under”). Example sentences are:Mettez la feuille à gauche du chapeau(“Move the leaf to the left of the hat”) orMettez la loupe au-dessus du slip(“Move the magnifying glass above the underpants”).
For each intelligibility and comprehension test, 10 additional items were presented prior to data collection for training purposes.
Speech recordings.Recordings took place in an audio-metric booth2using an omnidirectional Sennheiser MD46 microphone (Sennheiser, Wedemark, Germany) and a TASCAM DM-3200 mixing console (TEAC Corporation, Tokyo, Japan). Each of three native French speakers (a 12-year-old girl, a 46-year-old man, and a 47-year-old woman) produced all 70 words and 110 sentences. Hence, the entire corpus comprised 210 words and 330 sentences and had a total duration of 12 min. In order to equalize the loudness of the recorded words and sentences, three of the authors adjusted the level of each word and sentence relative to a reference item, and the mean gain values of the adjustments were applied to the stimuli.
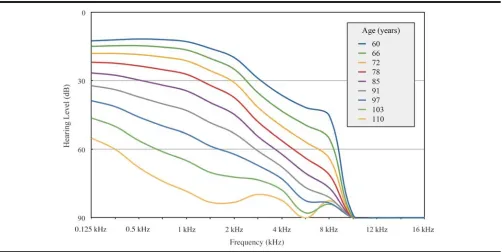
Simulation of ARHL.The algorithms described by Nejime & Moore (1997) were used to simulate some of the perceptual consequences of ARHL, using a custom-written MATLAB program (MathWorks, 2015). The program uses the audiometric thresholds as input data. Here, nine levels of hearing-loss severity were simulated. This was done by using the mean audiograms observed for the 3,753 older participants of the Beaver Dam study, grouped into nine age groups with mean ages ranging between 60 and 110 years (Cruickshanks et al., 1998). Figure 1 shows the best polyno-mial regression curves obtained for fitting mean hearing thresholds at 15 frequencies ranging from 125 Hz to 16 kHz.
Based on the audiometric input data, the program simulates three effects associated with ARHL: (a) reduced audibility (by filtering several frequency bands according to the audiogram values given as an input); (b) reduced fre-quency selectivity (by spectrally smearing the speech signal; Baer & Moore, 1993); (c) loudness recruitment (by raising the signal envelope; Moore & Glasberg, 1993).
To simulate the reduction of frequency selectivity, the program first defines the degree of hearing loss (mild, moderate, or severe) based on the pure-tone average for audiometric frequencies between 2 and 8 kHz. Three differ-ent degrees of spectral smearing are then applied, depending on the degree of hearing loss.
In this study, only one simulation of loudness recruit-ment was used; the envelope of the speech signal was raised in order to simulate the effect of moderate loudness recruitment (Moore & Glasberg, 1993). This choice made loudness re-cruitment subject to a high intersubject variability (Moore, 2007); therefore, the level of recruitment cannot be pre-dicted on the sole basis of age and auditory thresholds.
The nine conditions of simulated thresholds, loudness recruitment, and loss of frequency selectivity are shown in Table 1, with corresponding theoretical ages.
The speech corpus was processed to simulate the effects of ARHL at nine levels of severity, resulting in 1,890 word stimuli and 2,970 sentence stimuli (approximate total corpus duration: 115 min). These levels are referred to as ARHL-simulation conditions 1 to 9 in the remainder of the article.
Participants
Sixty university students (34 women, 26 men) ages 18 to 30 years (mean age = 21.3 years; standard deviation = 2.2) took part in this study in exchange for monetary com-pensation. All were native French speakers and had hearing thresholds≤15 dB HL at 250, 500, and 1000 Hz, and average audiometric thresholds < 15 dB HL for frequencies of 2, 4, and 8 kHz (the latter complied with the definition of no ARHL in the program used to simulate the effects of ARHL). None of the participants reported any uncorrected vision problem.
Procedure
Participants completed two intelligibility tests (referred to as IT1 and IT2) and one comprehension test (referred to as CT). They were separated in two groups: Half of the participants completed IT1 and CT, whereas the other half completed IT2 and CT. Consequently, both IT1 and IT2 were completed by 30 participants, whereas CT was completed by all 60 participants. For both participant groups, the order between intelligibility and comprehension tests was counterbalanced. The nine ARHL-simulation conditions were also counterbalanced.
Each participant completed the tests individually in a double-walled sound-attenuating booth (ambient noise level: 28-dB, A-weighted). The participant was seated in front of two Tannoy Precision 6D loudspeakers (Tannoy Ltd., Coatbridge, Scotland, UK), placed at a distance of approx-imately one meter and at ± 30° azimuth relative to the listener. Speech level was calibrated so that the level of the unprocessed speech stimuli (i.e., stimuli that had not undergone the ARHL-simulation process) reached, on aver-age, 60 dB (A-weighted) at the participant’s ear.
2
Intelligibility Tests
Participants were asked to repeat what they had heard (words in IT1 and sentences in IT2) into a microphone posi-tioned in front of them. They were encouraged to guess in case they were unsure about what had been presented. Responses were recorded to be transcribed and scored offline by three of the authors. For IT1, a response was judged as “correct”if it matched every phoneme of the target word, and“incorrect”otherwise (binary score). For IT2, the
score for each sentence was calculated as the number of correctly identified words divided by the total number of words in the sentence. The final intelligibility scores were calculated as the total percentage of correct responses for each test.
Comprehension Test
[image:4.585.44.546.99.351.2]Participants were seated facing a 20-in. color monitor displaying six images (evenly distributed into two rows
Figure 1.Regression curves fitting mean hearing thresholds for nine mean ages as a function of tone frequency, according to Cruickshanks et al. (1998).
Table 1.Experimental conditions of age-related hearing loss simulated for ages between 60 and 110 years and associated absolute thresholds, level of loudness recruitment, and reduction of frequency selectivity.
Parameter
Condition no.
1 2 3 4 5 6 7 8 9
Theoretical age (years) 60 66 72 78 85 91 97 103 110
Loudness recruitment Moderate Moderate Moderate Moderate Moderate Moderate Moderate Moderate Moderate Reduction of frequency
selectivity
Mild Moderate Moderate Moderate Severe Severe Severe Severe Severe
Simulated thresholds (dB HL)
0.125 kHz 12 15 18 22 27 32 39 46 55
0.250 kHz 12 15 18 22 28 34 41 50 60
0.500 kHz 12 15 19 24 30 37 46 56 68
0.750 kHz 12 15 20 25 32 40 50 61 74
1.000 kHz 13 16 21 27 34 43 53 65 78
1.500 kHz 16 20 26 32 40 48 59 70 83
2.000 kHz 20 25 31 37 45 53 62 72 83
3.000 kHz 29 35 42 48 54 61 67 73 80
4.000 kHz 36 43 50 56 62 68 73 78 82
6.000 kHz 42 49 57 64 70 77 83 88 90
[image:4.585.46.544.529.721.2]and three columns) for each sentence that was played (see Figure 2 in Fontan, Tardieu, et al., 2015). They were asked to respond to each command by selecting and then dragging a target image (Object 1) above/below/to the right of/to the left of another target image (Object 2). A computer mouse was used to perform these actions. Each sentence was con-sidered as understood if the three key elements (Target Image 1, position, Target Image 2) were correctly identified by the listener, based on the actions that were performed on the computer screen. Final CT scores were calculated as the percentage of sentences correctly understood by the listeners in each of the nine ARHL-simulation conditions.
Computing Automatic Intelligibility
and Comprehension Scores
In contrast to most research in the field of ASR that has the goal to design the best possible system (in terms of WER), the present work aimed at developing an ASR system that would simulate as closely as possible human behavior, even if that resulted in suboptimal performance. To achieve this, an ASR system based on SPHINX-3 (dis-tributed by Carnegie Mellon University; Seymore et al., 1998) and French acoustic models adapted to the three voices were used. The ESTER23audio and text corpus (Galliano, Gravier, & Chaubard, 2009) was used for the creation of the acoustic models and of a trigram language model that together constituted the baseline ASR system. Different configurations for the lexicon and language models were then developed in order to best fit the human scores.
Description of the ASR System
Acoustic ModelsThe French acoustic models used in this study came from the Laboratoire d’Informatique de l’Université du Maine (France; Deléglise, Estève, Meignier, & Merlin, 2005; Estève, 2009). They included 35 phones and five kinds of pauses and were designed to process 16-kHz audio samples based on a Perceptual Linear Predictive feature extraction (Hermansky, 1990). Acoustic models were trained upon the basis of French radio broadcasts (Galliano et al., 2009) and were formed by 5,725 context-dependent states (senones) with 22 Gaussian mixtures per state.
Speaker Adaptation
The acoustic models were trained on recordings that included more male than female voices (Galliano et al., 2006). This caused the system to show a better WER for the male than for the female and child speaker. As a conse-quence, a first step of the present work was to adapt the ASR system to the voices of the speakers in order to obtain ASR performances as similar as possible (in terms of WER) for the adult-male, adult-female, and child speech. To this
end, the vocal-tract-length normalization technique (VTLN; Wegmann, McAllaster, Orloff, & Peskin, 1996) was used. The VTLN technique is based on the assumption that there is a direct linear relationship between speech formant areas and the vocal tract length of the speaker. It consists of deter-mining the best warping factorλthat maximizes the like-lihood of the phones produced by a specific speaker:
λ¼ arg maxPð0jX;λkÞ; (1Þ
whereXis the observation andkthe index of thekth fre-quency warping factor considered. In order to find the best λvalue for each of the three speakers, the inverse linear functiony = x/λwas used and tested on the IT1 subcorpus. Results showed that the adult-male speaker recordings did not need any adaptation (λ= 1.0), whereas the adult-female speaker and the girl speaker recordings needed VTLN with optimalλvalues of 1.84 and 2.24, respectively. These two warping factors were systematically used for the extrac-tion of female and child speech features during automatic speech recognition.
Lexicon and Language Models
The lexicon and language modeling constituted the main stage in the fitting of the ASR scores to human scores. Based on the assumption that human performance is greatly influenced by top-down expectations at lexical, syntactic, and contextual levels, the goal was to feed the system with similar lexical and syntactic cues to constrain its behavior and thus to get a better linear correlation with human data.
To this end, different ways of modeling the lexicon and syntax were explored for each of the three tests, and the results compared to those obtained with the baseline model. The latter contained very low constraints upon the lexicon and syntactic structures to be recognized; it is a trigram language model calculated on the basis of the ESTER2 corpus (Deléglise et al., 2005; Galliano et al., 2009) asso-ciated with a 62,000-word lexicon and is henceforth re-ferred to as BM.
For IT1, one additional language model was designed in order to reflect the syntactic, lexical, and phonological properties of the test stimuli. This model, referred to as IT1M, is a bigram language model based on the syntac-tic structure [Det + Noun], and its lexicon contains only disyllabic masculine nouns beginning with a consonant (15,000 forms). To reflect the frequency of these forms in oral French, the frequency values defined by New, Brysbaert, Veronis, and Pallier (2007), based on movie subtitles and available in the database Lexique 3.8,4were used.
For IT2, four additional language models were designed:
• IT2M1 is a trigram language model, based on a subcorpus of ESTER2; this subcorpus consists of the ESTER2 utterances containing at least one word occurring in IT2 sentences.
3
Évaluation des Systèmes de Transcription Enrichie d’Emissions Radiophoniques (Evaluation of Broadcast News Enriched Transcription
• IT2M2 is the same trigram model as BM, but with a lexicon restricted to the words constituting the 260 sentences of the complete French version of the HINT.
• IT2M3 is the same trigram model as BM, but with a lexicon restricted to the words constituting the 60 HINT sentences included in the IT2 test. • IT2M4 is an finite-state grammar (FSG), allowing
the generation of the 60 HINT sentences included in the IT2 test.
Finally, two additional language models were de-signed for CT:
• CTM1 is an FSG, allowing the generation of all the possible combinations in the CT test, that is, around 50,000 sentences (112 objects × 4 positions × 111 objects);
• CTM2 is the same FSG as CTM1, but associated with a dynamic lexicon; for each sentence processed by the ASR system, only the nouns corresponding to the six images actually presented to the listeners during CT were included in the lexicon.
Table 2 summarizes the different language models used for the automatic recognition.
ASR-Score Calculation.For the recognition of the intelligibility-test items (words and sentences for IT1 and IT2, respectively) only the percentage of correct words was considered as an outcome measure. The determinant “le”was not taken into account for IT1 items in order to follow the scoring procedure used with human participants. For the recognition of CT items, only the recognition of the three main keywords of each sentence (i.e., Object 1, position, Object 2) was considered and the ASR score cor-responds to the percentage of sentences for which all key-words were recognized by the system.
Results
Word Intelligibility Test (IT1)
Word-identification performance for the human lis-teners and the ASR system using two different language models are presented in Figure 2 as a function of simulated-ARHL condition. The different panels show average results for each of the three speakers and the grand average.
Human word identification declines sigmoidally with increasing severity of the simulated ARHL condition, with, on average, Conditions 1 and 2 and Conditions 8 and 9 yielding ceiling and floor effects, respectively.
[image:6.585.301.546.106.353.2]Machine scores are generally lower than human scores (mean: 63%), with IT1M yielding higher scores (mean: 32.1%) than BM (mean: 18.8%), but also followed a downward trend with increasing ARHL-simulation condition. However, the shape of the performance functions for the two language systems differs from that for human listeners (e.g., it is linear for BM/female and concave for BM/child). Marked decreases in performance can be seen
Table 2.Language models used for the automatic recognition of Intelligibility Test 1 (IT1), Intelligibility Test 2 (IT2), and Comprehension Test (CT) stimuli.
Model Description
Baseline model (BM) Trigrams (ESTER2 corpus) and 62,000-word lexicon IT1
IT1M Bigrams (Det + N) with word frequencies based on Lexique 3.8
IT2
IT2M1 Trigrams calculated on a subcorpus of ESTER2 IT2M2 BM trigrams with a lexicon
restricted to that of the 260 HINT sentences IT2M3 BM trigrams with a lexicon
restricted to that of the 60 IT2 sentences IT2M4 FSG allowing the generation
of the 60 IT2 sentences CT
CTM1 FSG allowing the generation of the ~50,000 sentences possibly combined in CT
CTM2 Same FSG as CTM1
associated with a dynamic lexicon
[image:6.585.303.546.473.719.2]Note. HINT = Hearing in Noise Test; FSG = finite-state grammar.
between Conditions 1 and 2 and Conditions 4 and 5. On average, the highest machine scores are obtained for the male speaker (meanBM: 30.2%, meanIT1M: 35.2%), then the female speaker (meanBM: 19.6%, meanIT1M: 31.3%), and finally the child speaker (meanBM: 6.5%, meanIT1M: 29.7%).
To establish the goodness-of-fit of the machine scores for human word intelligibility as a function of ARHL-simulation condition, Pearson’s linear correlation coefficient was computed for each combination of language model and speaker condition (see Table 3). Given the exis-tence of floor and ceiling effects, scores were first transformed into rational-arcsine units (RAUs; Studebaker, 1985). As expected based on the visual inspection of the results, all correlations were positive, strong (ranging from .71 to .99), and significant (allp≤.032, two tailed). Comparing correla-tion coefficients for the ASR system using the two different language models, after applying Fisher’s r-to-z transforma-tion, revealed a significant difference (i.e., improvement in the strength of the correlation) between BM and IT1M only for the child speaker (z=−2.95,p= .002, one tailed; a one-tailed test was used because it was assumed that BM would yield lower correlation coefficients than the more “sophisticated”models).5The left panel of Figure 3 shows the scatterplot relating mean RAU-transformed human and machine scores for the BM and the best linear fit. Because ASR performance is lower than human performance for all conditions, all data points (except for the most severe ARHL-simulation condition yielding the lowest possible RAU score for listeners and the ASR system) fall above the diag-onal that indicates identical performance for both the hu-man and machine listener.
Sentence Intelligibility Test (IT2)
Sentence-identification performance for the human listeners and the ASR system using five different language models are presented as a function of simulated-ARHL condition in Figure 4.
As for word identification, human sentence identifica-tion declines sigmoidally with ARHL-simulaidentifica-tion condiidentifica-tion, with the ceiling effect extending up to and including Con-dition 4. On average, identification for sentences (mean: 64.6%) was very similar to that for words.
The ASR system generally yields lower than human scores, independently of the language models used (mean performance ranges from 30.9% to 51.8%), which, consistent with the human results, decline with ARHL-simulation condition. However, the shape of these functions differs from that of human performance; marked decreases are again observed between Conditions 4 and 5 for all language models, and, for IT2M4, performance for Conditions 8 and 9 is actually better than human performance. Across all ARHL
simulations and language models, the male speaker yields the highest machine scores (mean: 46.6%), the female speaker the second highest (mean: 40.2%), and the child speaker the lowest (mean: 35%).
Table 4 indicates Pearson’s linear correlation coeffi-cients between RAU-transformed human and machine scores for the different language models and speakers. All correlations were positive, strong (ranging from .90 to .99), and significant (allp≤.001, two tailed). Compared to the correlation coefficient obtained for the BM—and when averaging performance across speakers—the four other language models yield significantly stronger correlations (allz≥ −2.37, allp≤.009, one tailed). However, when considering performances for each speaker individually, some models did not yield a significant improvement in the strength of the correlation (IT2M1 with the male speaker and IT2M2 and IT2M4 with the female speaker).
The middle panel of Figure 3 shows the scatterplot relating mean RAU-transformed human and machine scores for the BM and IT2M4 (which yielded significantly higher correlation compared to the BM) and the best linear fits. The regression lines for the BM and IT2M4 have com-parable slopes; however, they-intercept of the regression line is higher with the BM than with IT2M4, showing that the difference between human and ASR scores is reduced for IT2M4. For both BM and IT2M4, the regression lines present degrees of incline > 45 degrees, showing that the differences between human and ASR performances tend to increase with the elevation of scores.
Comprehension Test (CT)
Comprehension performance for the human listeners and the ASR system using three different language models are presented as a function of simulated-ARHL condition in Figure 5.
[image:7.585.303.545.117.180.2]Human speech comprehension (mean: 68.7%) is only slightly better than word and sentence identification but shows a similar dependence on ARHL-simulation condition and extent of the ceiling effect.
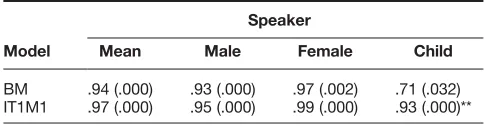
Table 3.Pearson’s correlation coefficients for Intelligibility Test 1 (IT1) between human intelligibility scores and automatic speech recognition (ASR) scores, using different language models and for all speakers combined (mean) or individual speakers.
Model
Speaker
Mean Male Female Child
BM .94 (.000) .93 (.000) .97 (.002) .71 (.032) IT1M1 .97 (.000) .95 (.000) .99 (.000) .93 (.000)**
Note. pvalues for two-tailedttests are given in parentheses. Asterisks indicate thepvalues for one-tailed tests of the difference between the correlation coefficient for the baseline model (BM) and each of the other language models. All tests were uncorrected for multiple comparisons.
**p< .01; one-tailed test re: BM.
5
Machine scores increased from BM (mean: 33.6%) over CTM2 (mean: 54.7%) to CTM1 (mean: 68%) but are lower than human scores. Once again, a marked decline in performance is observed between ARHL-simulation conditions 4 and 5. Interestingly, both more sophisticated language models (especially CTM1) yield performance for the most severe ARHL conditions that exceeds that observed in human listeners. Across all ARHL simulations and language models, highest machine performance was observed for the male speaker (mean: 57.3%), then the child
speaker (mean: 51.2%), and finally the female speaker (mean: 47.8%).
Pearson’s correlation coefficients between RAU-transformed human and machine scores, presented in Table 5, were positive, strong (ranging from .91 to .98), and significant (allp≤.001, two tailed). Compared to BM, both more sophisticated models CTM1 and CTM2 do not yield significantly stronger correlations with human scores for any of the speaker conditions. The right panel of Figure 3 shows the scatterplot relating mean RAU-transformed human and machine scores for the BM and the best linear fit. They-intercept of the regression line is almost situated on the diagonal indicating identical perfor-mance for both the human and machine listener. However, for higher scores, the difference between human and ASR performance tends to increase.
Discussion
The long-term goal of this research work is to develop an ASR-based system able to predict human speech-processing performance, with the purpose of facilitating HA fitting for people with ARHL. The current study con-stituted the first step toward this goal by comparing ASR results to speech intelligibility and comprehension scores of young participants with normal hearing who are listen-ing to speech processed to simulate ARHL.
The observed strong correlations for all three tests and all speaker conditions indicate that the ARHL simula-tion, representing the different levels of severities of the perceptual consequence of hearing loss associated with ages 60 to 110 years, had comparable effects on human and ASR scores. Thus, it appears that ASR systems could be used to predict trends in human speech intelligibility and comprehension with increasing level of ARHL.
[image:8.585.92.499.116.242.2]However, weaker machine scores were generally found when processing words and sentences uttered by the female and child speakers than those uttered by the male speaker. This is probably due to the acoustic models used in this study. They were trained on speech recordings consisting of two thirds male voices (Galliano et al., 2006).
[image:8.585.39.281.480.720.2]Figure 3.Scatterplots relating the mean rational-arcsine unit (RAU)-transformed human scores to RAU-transformed machine scores obtained in each of the three speech tests, Intelligibility Test 1 (IT1), Intelligibility Test 2 (IT2), and Comprehension Test (CT). Results for the baseline model (BM) and a more sophisticated language model (IT2M4) showed a significant improvement in the strength of the correlation. ASR = automatic speech recognition.
Although the VTLN technique (Wegmann et al., 1996) was used to adapt the ASR system to the different voices, the results indicate that this did not fully eliminate interspeaker differences.
In order to obtain the strongest associations possible between ASR scores and human performance, several lan-guage models were designed by taking into account the phonological, lexical, syntactic, and extralinguistic cues that underlie human performance in IT1, IT2, and CT. A model with very low constraints on the lexicon and syntactic structures (BM) was used to generate machine baseline performance against which improvements due to the differ-ent, more sophisticated language models could be measured.
Apart from IT2, model sophistication did not yield signifi-cant improvements in the strength of the association between machine and human scores. A possible partial explanation for this finding is that the correlation between human and BM scores was already very high (≥.90 except for IT1 and the child speaker), and this left little room for improvements. When looking at the conditions yielding the lowest correla-tions with BM (e.g., child speech condicorrela-tions in IT1 and IT2), highly significant improvements were observed when using more sophisticated models.
[image:9.585.90.494.108.201.2]Floor and ceiling effects were observed in the human performance for all three speech tests. However, the num-ber of ARHL-simulation conditions that were affected varied with the test used, with CT > IT2 > IT1 as regards ceiling effects, and IT1 > IT2 > CT as regards floor effects. This observation is consistent with the assumption that contextual effects have an increasingly beneficial effect on human performance as speech processing goes from word identification over sentence identification to comprehension (Lindblom, 1990; Fontan, Tardieu, et al., 2015). The aim of the present study was to explore the effect of the full range of levels of ARHL (from mild to severe) on speech processing in quiet. The existence of floor and ceiling effects was therefore unavoidable. The application of a RAU transformation to the raw data allowed us to overcome the problems associated with such effects, at least to some extent. To enhance the performance of the prediction system and to extend its applicability to other groups of listeners
Table 4.Pearson’s correlation coefficients and associatedpvalues (in parentheses) for Intelligibility Test 2 (IT2) performance between human intelligibility scores and automatic speech recognition (ASR) scores, using different language models and for all speakers combined (mean) or individual speakers.
Model
Speaker
Mean Male Female Child
BM .94 (.000) .95 (.000) .94 (.000) .90 (.001)
IT2M1 .96 (.000)** .97 (.000) .96 (.000)* .94 (.000)**
IT2M2 .97 (.000)** .97 (.000)** .97 (.000) .95 (.000)***
IT2M3 .98 (.000)** .98 (.000)* .97 (.000)* .97 (.000)***
IT2M4 .99 (.000)*** .99 (.000)* .98 (.000) .96 (.000)***
Note. BM = baseline model.
[image:9.585.41.283.476.718.2]*p≤.05; **p< .01; ***p≤.001; one-tailed test re: BM.
Figure 5.Speech comprehension (for the Comprehension Test [CT]) as a function of the condition of simulated age-related hearing loss (ARHL) for human listeners (filled circles) and the automatic speech recognition (ASR) system, using different language models (see open symbols in the figure legend). The different panels show results for each of the three speakers (female, child, and male) and averaged across speakers (mean). BM = baseline model.
Table 5.Pearson’s correlation coefficients and associatedpvalues (in parentheses) for Comprehension Test (CT) performance between human intelligibility scores and automatic speech recognition (ASR) scores, using different language models and for all speakers combined (mean) or individual speakers.
Model
Speaker
Mean Male Female Child
BM .96 (.000) .91 (.001) .95 (.000) .98 (.000) CTM1 .97 (.000) .95 (.000) .96 (.000) .98 (.000) CTM2 .98 (.000) .97 (.000) .98 (.000) .98 (.000)
[image:9.585.304.545.628.702.2]and to other listening conditions, the following lines of research will be pursued in the future.
1. Acoustic models will be trained on speech corpora containing a balance of male and female adult and child voices. Also, because the main difficulty of people experiencing ARHL is to understand speech in the presence of interfering sounds, the applicability of these models to the recognition of speech in adverse listening conditions (e.g., background noise, reverberation) needs to be assessed. Whether our findings can be generalized to other languages than French also needs to be established.
2. In the present study, the goodness-of-fit of the prediction by machine scores of the observed trends in average human performance for a range of simulated ARHL conditions was quantified. Because the ultimate aim of the system is to help audiologists/HA dispensers with the fitting of HAs to individual patients/clients, the system’s predictive power of individual cases of ARHL needs to be tested. Also, the present study used young listeners with normal hearing for whom ARHL was simulated. This choice was made so that the same stimuli could be presented to the participants and to the ASR system. However, the participants tested in the present study differed considerably from the population for which the prediction system was originally designed, namely people with ARHL who are generally older. Performance in many cognitive abilities declines with age (for example, in working memory, attention, processing speed, inhibition; e.g., Füllgrabe et al., 2015; Park et al., 2002). In addition, age-related changes in supraliminary auditory processing are observed in older listeners, for example in the processing of temporal–fine structure (Füllgrabe, 2013; Füllgrabe et al., 2015; Grose & Mamo, 2010; Moore, Glasberg, Stoev, Füllgrabe, & Hopkins, 2012) and temporal-envelope information (Füllgrabe, Meyer, & Lorenzi, 2003; Füllgrabe et al., 2015; He, Mills, Ahlstrom, & Dubno, 2008). As both temporal processing and cognitive abilities are associated with speech-in-noise perception (e.g., Füllgrabe et al., 2015), it is probably necessary to consider these abilities in future versions of the ASR-based prediction system to yield accurate predictions of speech-perception performance for all listeners across the adult lifespan.
3. The simulations of ARHL used to produce the degraded input to the prediction system might have to be refined. For example, in the current study, the simulation of loudness recruitment was fixed at one severity condition corresponding to a moderate level of loudness recruitment. This choice was made because the severity of loudness recruitment is highly variable among people experiencing ARHL (Moore, 2007). However, this restriction has a potential impact on the ability of the system to accurately predict speech intelligibility and comprehension for
older people presenting different degrees of loudness recruitment. In a next step, the level of loudness recruitment should be manipulated in order to verify that its effect on ASR scores is comparable to its effects on human speech recognition performance. In addition, strong decreases in ASR scores were observed between ARHL-simulation conditions 4 and 5, and, to a lesser extent, between ARHL-simulation conditions 1 and 2. These decreases in performance are probably caused by the spectral smearing, which simulated the consequences of losses in frequency selectivity on speech perception. As shown in Table 1, going from ARHL-simulation conditions 1 to 2 and from 4 to 5 coincides with a change in the simulated severity of the loss of frequency selectivity. No comparable effect was observed in the human scores, consistent with results reported by Baer and Moore (1993), showing that the spectral-smearing algorithm had a significant effect on speech intelligibility only when stimuli were heard in noisy conditions. This matter warrants further investigation on the use of an ASR-based system to predict human processing performance for spectrally smeared speech presented in noise.
4. To further address the role of top-down effects on speech processing, future work will investigate different test materials and tasks from those used in the present study. For example, nonsense or low-predictable sentences such as those used in the Matrix test (Vlaming et al., 2011) could be used to eliminate the syntactic and semantic predictability present in the sentences used in IT2 and CT. Also, using sentences requiring the listener to process other linguistic cues to interpret the meaning of the sentences (e.g., thematic roles) could be relevant.
5. Finally, this research concentrated on correlations between machine and humans scores, that is, on the predictability of the trends observed in human speech intelligibility and comprehension. Further research is needed to assess the ability of the ASR system to predict actual intelligibility and comprehension scores. Also, in addition to the purely quantitative prediction, it would be of interest to investigate whether qualitative aspects of human speech processing can be predicted by the ASR system. For example, the analysis of the phonetic confusions predicted by the ASR system might provide insights into which acoustic features are misperceived by human listeners (Fontan, Ferrané, Farinas, Pinquier, & Aumont, 2016; e.g., predicting that with a specific HA setting the listener will tend to perceive stop consonants as their constrictive counterparts). This information might prove very helpful to audiologists/HA dispensers for the fine-tuning of HAs.
be seen with increasing levels of ARHL. In the future, this might help to optimize the fitting process of HAs in terms of the time necessary to find optimal HA settings and the amount of benefit derived from HAs, and therefore reduce their rejection by people experiencing ARHL.
Acknowledgments
This research was supported by the European Regional Development Fund within the framework of the
Occitanie/Pyrénées-Méditerranée French region’s AGILE-IT 2012 project grant.
The project, for which a European patent (Aumont & Wilhem-Jaureguiberry, 2009) has been filed, is led by Archean Technologies (France).
The project won the grand prize of the 2016 French Aviva Community Fund“La Fabrique”in the category of health-related innovations.
Parts of this study were presented at the INTERSPEECH 2015 conference (Fontan, Farinas, Ferrané, Pinquier, & Aumont, 2015) in Dresden (Germany) and at the INTERSPEECH 2016 conference (Fontan, Ferrané, Farinas, Pinquier, & Aumont, 2016) in San Francisco (USA).
The Medical Research Council Institute of Hearing Research is supported by the Medical Research Council (Grant U135097130).
References
Aumont, X., & Wilhem-Jaureguiberry, A.(2009).European Patent No. 2136359—Method and Device for Measuring the Intelligi-bility of a Sound Distribution System. Courbevoie, France: Institut National de la Propriété Industrielle.
Baer, T., & Moore, B.(1993). Effects of spectral smearing on the intelligibility of sentences in noise.Journal of the Acoustical Society of America, 94(3), 1229–1241. https://dx.doi.org/10.1121/ 1.408176
CHABA.(1988). Speech understanding and aging.Journal of the Acoustical Society of America, 83(3), 859–895. https://dx.doi. org/10.1121/1.395965
Cruickshanks, K., Wiley, T., Tweed, T., Klein, B., Klein, R., Mares-Perlman, J., & Nondahl, D.(1998). Prevalence of hear-ing loss in older adults in Beaver Dam, Wisconsin: The epidemi-ology of hearing loss study.American Journal of Epidemiology, 148(9), 879–886. https://dx.doi.org/10.1093/oxfordjournals.aje. a009713
Deléglise, P., Estève, Y., Meignier, S., & Merlin, T.(2005). The LIUM speech transcription system: A CMU Sphinx III-based system for French broadcast news. InProceedings of Inter-speech’05(pp. 1653–1656). Lisbon, Portugal: International Speech and Communication Association.
Estève, Y.(2009).Traitement automatique de la parole: Contribu-tions (Automatic speech processing: ContribuContribu-tions).(Thesis for theHabilitation à Diriger des Recherchesauthorization). Le Mans (France): Université du Maine.
Fontan, L.(2012).De la mesure de l’intelligibilité à l’évaluation de la compréhension de la parole pathologique en situation de communication(Doctoral dissertation). University of Toulouse, Toulouse, France.
Fontan, L., Farinas, J., Ferrané, I., Pinquier, J., & Aumont, X. (2015). Automatic intelligibility measures applied to speech signals simulating age-related hearing loss. InProceedings of Interspeech’15(pp. 663–667). Dresden, Germany: International Speech and Communication Association.
Fontan, L., Ferrané, I., Farinas, J., Pinquier, J., & Aumont, X. (2016). Using phonologically weighted Levenshtein distances for the prediction of microscopic intelligibility. InProceedings of Interspeech’16(pp. 650–654). San Francisco, CA: Inter-national Speech and Communication Association. Fontan, L., Gaillard, P., & Woisard, V.(2013). Comprendre et
agir: Les tests pragmatiques de compréhension de la parole et EloKanz. In R. Sock, B. Vaxelaire, & C. Fauth (Eds.),La voix et la parole perturbées(pp. 131–144). Mons, Belgium: CIPA.
Fontan, L., Pellegrini, T., Olcoz, J., & Abad, A.(2015). Predicting disordered speech comprehensibility from goodness of pronun-ciation scores. InSixth Workshop on Speech and Language Processing for Assistive Technologies: SLPAT 2015—Satellite workshop of Interspeech’15,Dresden, Germany. Retrieved from http://www.slpat.org/slpat2015/papers/fontan-pellegrini-olcoz-abad.pdf
Fontan, L., Tardieu, J., Gaillard, P., Woisard, V., & Ruiz, R. (2015). Relationship between speech intelligibility and speech comprehension in babble noise.Journal of Speech, Language, and Hearing Research, 58(3), 977–986. https://dx.doi.org/10.1044/ 2015_jslhr-h-13-0335
Fournier, J.(1951).Audiométrie vocale. Paris, France: Maloine. Füllgrabe, C.(2013). Age-dependent changes in
temporal-fine-structure processing in the absence of peripheral hearing loss.American Journal of Audiology, 22(2), 313–315. https:// dx.doi.org/10.1044/1059-0889(2013/12-0070)
Füllgrabe, C., Meyer, B., & Lorenzi, C.(2003). Effect of cochlear damage on the detection of complex temporal envelopes. Hearing Research, 178(1-2), 35–43.
Füllgrabe, C., Moore, B., & Stone, M.(2015). Age-group differences in speech identification despite matched audiometrically normal hearing: Contributions from auditory temporal processing and cognition.Frontiers in Aging Neuroscience, 6(347), 1–25. https://dx.doi.org/10.3389/fnagi.2014.00347
Füllgrabe, C., & Rosen, S.(2016a). Investigating the role of working memory in speech-in-noise identification for listeners
with normal hearing.Advances in Experimental Medicine
and Biology, 894,29–36. https://dx.doi.org/10.1007/978-3-319-25474-6_4
Füllgrabe, C., & Rosen, S.(2016b). On the (un)importance of working memory in speech-in-noise processing for listeners with normal hearing thresholds.Frontiers in Psychology, 7, 1268. https://doi.org/10.3389/fpsyg.2016.01268
Galliano, S., Geoffrois, E., Gravier, G., Bonastre, J. F., Mostefa, D., & Choukri, K.(2006). Corpus description of the ESTER evalua-tion campaign for the rich transcripevalua-tion of French broadcast news. InProceedings of the 5th international Conference on Language Resources and Evaluation: LREC 2006(pp. 315–320). Genova, Italy: European Language Resources Association. Galliano, S., Gravier, G., & Chaubard, L.(2009). The ESTER 2
evaluation campaign for the rich transcription of French radio broadcasts. InProceedings of Interspeech’09(pp. 2583–2586). Brighton, United Kingdom: International Speech and Com-munication Association.
Gopinath, B., Wang, J. J., Schneider, J., Burlutsky, G., Snowdon, J., McMahon, C. M., . . . Mitchell, P.(2009). Depressive symp-toms in older adults with hearing impairments: The Blue Mountains study.Journal of the American Geriatrics Society, 57(7), 1306–1308. https://dx.doi.org/10.1111/j.1532-5415.2009. 02317.x
He, N. J., Mills, J. H., Ahlstrom, J. B., & Dubno, J. R.(2008). Age-related differences in the temporal modulation transfer function with pure-tone carriers.Journal of the Acoustical Soci-ety of America, 124(6), 3841–3849. https://dx.doi.org/10.1121/ 1.2998779
Hermansky, H.(1990). Perceptual linear predictive (PLP) analysis of speech.Journal of the Acoustical Society of America, 87(4), 1738–1752. https://dx.doi.org/10.1121/1.399423
Hustad, K. C.(2008). The relationship between listener comprehen-sion and intelligibility scores for speakers with dysarthria.Journal of Speech, Language, and Hearing Research, 51,562–573. Hustad, K. C., & Cahill, M. A.(2003). Effects of presentation
mode and repeated familiarization on intelligibility of dysarth-ric speech.American Journal of Speech-Language Pathology, 12(2),198–208. https://dx.doi.org/10.1044/1058-0360(2003/066) Knudsen, L. V., Öberg, M., Nielsen, C., Naylor, G., & Kramer,
S. E.(2010). Factors influencing help seeking, hearing aid up-take, hearing aid use and satisfaction with hearing aids: A review of the literature.Trends in Amplification, 14(3), 127–154. https:// doi.org/10.1177/1084713810385712
Lee, I. A., & Preacher, K. J.(2013). Calculation for the test of the difference between two dependent correlations with one vari-able in common [Computer software]. Retrieved from http:// www.quantpsy.org.
Lin, F. R., Yaffe, K., Xia, J., Xue, Q. L., Harris, T. B., Purchase-Helzner, E., . . . Health ABC Study Group FT.(2013). Hearing loss and cognitive decline in older adults.JAMA Internal Mede-cine, 173(4), 293–299. https://dx.doi.org/10.1001/jamainternmed. 2013.1868
Lindblom, B.(1990). On the communication process: Speaker-listener interaction and the development of speech.Augmentative and Alternative Communication, 6,220–230. https://dx.doi.org/ 10.1080/07434619012331275504
Maier, A., Haderlein, T., Eysholdt, U., Rosanowski, F., Batliner, A., Schuster, M., & Nöth, E.(2009) PEAKS—A system for the automatic evaluation of voice and speech disorders.Speech Communication, 51(5), 425–437.
MathWorks.(2015). MATLAB [Computer software].MATLAB and statistics toolbox release. Natick, MA: Author.
Moore, B. C. J.(2007).Cochlear hearing loss: Physiological, psycho-logical and technical issues. Chichester, United Kingdom: Wiley. Moore, B. C. J., & Glasberg, B. R.(1993). Simulation of the
effects of loudness recruitment and threshold elevation on the intelligibility of speech in quiet and in a background of speech. Journal of the Acoustical Society of America, 94(4), 2050–2062. https://dx.doi.org/10.1121/1.407478
Moore, B. C. J., Glasberg, B. R., Stoev, M., Füllgrabe, C., & Hopkins, K.(2012). The influence of age and high-frequency hearing loss on sensitivity to temporal fine structure at low frequencies (L).Journal of the Acoustical Society of America, 131(2), 1003–1006. https://dx.doi.org/10.1121/1.3672808 Nejime, Y., & Moore, B. C. J.(1997). Simulation of the effect
of threshold elevation and loudness recruitment combined with reduced frequency selectivity on the intelligibility of speech in
noise.Journal of the Acoustical Society of America, 102(1), 603–615.
New, B., Brysbaert, M., Veronis, J., & Pallier, C.(2007). The use of film subtitles to estimate word frequencies.Applied Psycho-linguistics, 28(4), 661–677.
Park, D. C., Lautenschlager, G., Hedden, T., Davidson, N. S., Smith, A. D., & Smith, P. K.(2002). Models of visuospatial and verbal memory across the adult life span.Psychology and Aging, 17(2), 299–320.
Schuster, M., Maier, A., Haderlein, T., Nkenke, E., Wohlleben, U., Rosanowski, F., . . . Nöth, E.(2006). Evaluation of speech intel-ligibility for children with cleft lip and palate by means of automatic speech recognition.International Journal of Pediatric Otorhinolaryngology, 70(10), 1741–1747. https://dx.doi.org/ 10.1016/j.ijporl.2006.05.016
Seymore, K., Chen, S., Doh, S., Eskenazi, M., Gouvea, E., Raj, B., . . . Thayer, E.(1998). The 1997 CMU Sphinx-3 English broad-cast news transcription system. InProceedings of the 1998 DARPA Speech Recognition Workshop(pp. 55–59). Lansdowne, VA: Morgan Kaufmann Publishers.
Smith, L. E.(1992). Spread of English and issues of intelligibility. In B. B. Karhru (Ed.),The other tongue: English across cultures (pp. 75–90). Urbana, IL: University of Illinois Press.
Smith, L. E., & Nelson, C. L.(2008). World Englishes and issues of intelligibility. In B. Kachru, Y. Kachru, & C. L. Nelson (Eds.),The handbook of world Englishes(pp. 428–435). Malden: Blackwell Publishing.
Steiger, J. H.(1980). Tests for comparing elements of a correla-tion matrix.Psychological Bulletin, 87,245–251.
Strawbridge, W. J., Wallhagen, M. I., Shema, S. J., & Kaplan, G. A.(2000). Negative consequences of hearing impair-ment in old age: A longitudinal analysis.Gerontologist, 40(3), 320–326.
Studebaker, G. A.(1985). A“rationalized”arcsine transform. Journal of Speech and Hearing Research, 28,455–462. Vaillancourt, V., Laroche, C., Mayer, C., Basque, C., Nali, M.,
Eriks-Brophy, A., . . . Giguère, C.(2005). Adaptation of the HINT (hearing in noise test) for adult Canadian francophone populations.International Journal of Audiology, 44(6), 358–361. https://dx.doi.org/10.1080/14992020500060875
Vlaming, M. S. M. G., Kollmeier, B., Dreschler, W. A., Martin, R., Wouters, J., Grover, B., Mohammadh, Y., & Houtgast, T.
(2011). HearCom: Hearing in the communication society.Acta
Acustica United With Acustica, 97(2), 175–192. https://doi.org/ 10.3813/AAA.918397
Wegmann, S., McAllaster, D., Orloff, J., & Peskin, B.(1996). Speaker normalization on conversational telephone speech. In Proceedings of the IEEE International Conference on Acoustics, Speech and Signal Processing(pp. 339–341). Atlanta, GA: IEEE Signal Processing Society.


![Figure 5. Speech comprehension (for the Comprehension Test [CT])as a function of the condition of simulated age-related hearing loss(ARHL) for human listeners (filled circles) and the automatic speechrecognition (ASR) system, using different language model](https://thumb-us.123doks.com/thumbv2/123dok_us/8569386.368034/9.585.41.283.476.718/comprehension-comprehension-condition-simulated-listeners-automatic-speechrecognition-different.webp)
