STUDIES ON THE LAMPBRUSH CHROMOSOMES OF
THE AMERICAN NEWT NOTOPHTHALMUS
(TRITURUS) VIRIDESCENS
Sheila Hartley
A Thesis Submitted for the Degree of PhD
at the
University of St Andrews
1977
Full metadata for this item is available in
St Andrews Research Repository
at:
http://research-repository.st-andrews.ac.uk/
Please use this identifier to cite or link to this item:
http://hdl.handle.net/10023/13962
(STUDIES 01 THE MPBRÜSH OHROBÎOSOMES Of THE M E RIGM IBV7T
Hotophthalmus (TrituruB) viridescens
by
SHEILA B. HARTLEY
Department of Zoology University of St. Andrews
A thesis submitted for the Degree of Doctor of Biilosophy
1977-ProQuest Number: 10170755
All rights reserved
INFORMATION TO ALL USERS
The quality of this reproduction is dependent upon the quality of the copy submitted.
In the unlikely event that the author did not send a com plete manuscript and there are missing pages, these will be noted. Also, if material had to be removed,
a note will indicate the deletion.
uest
ProQuest 10170755
Published by ProQuest LLO (2017). Copyright of the Dissertation is held by the Author.
All rights reserved.
This work is protected against unauthorized copying under Title 17, United States C ode Microform Edition © ProQuest LLO.
ProQuest LLO.
789 East Eisenhower Parkway P.Q. Box 1346
DECLARATION
I hereby declare that this thesis is my o\m composition, and that the experimental work was performed by me alone, except for some of the data included in Chapter V which has been submitted for publication jointly with
Professor H.G. Callan in the Journal of Cell Science.
None of the material in this thesis has been submitted for any other degree.
SHEILA E. HARTLEY
CERTIFICATE
I certify that Miss Sheila Bcbaa Hartley has spent 12 terras at research work on the lamphrush chromosomes of the newt, Notophthalmus' : viridescens. that she has fulfilled conditions of Ordinance No. 12.
(St. Andrews) and that she is qualified to submit the accompanying thesis for the degree of Doctor of Philosophy.
ÏÏ.G. CALLAN,
TOIVBRSITY GARBER
I entered the University of St. Andrews in October 1969» and graduated with an upper second class Honours B.So. in June 1973.
In October 1973 I started post-graduate research in the Zoology Department of the University of St, Andrews on the lampbrush
chromosomes of the newt Notonhthalmus viridescens. The results of my work are presented here
0 0 N T E N T 8
ABSTRACT ... ...
C H A P T E R I,
GENERAL INTRODUCTION TO TEE LAMPBRU8E CHROMOSOMES OF
Notonhthalmus (Triturus) viridescens with special reference
to the giant loops on chromosome II, ... 3
MATERIALS AND METHODS
Annuals * ,.,,,,,4,,
Lamphrush Chromosomes Preparations:
OBSERVATIONS ....
0 H A P T E R II. PHYSIOLOGICAL EXPERIMENTS ...
INTRODUCTION
MATERIALS AND METHODS ... 12 (a) Hormone Treatmenb« . . . o . 12
(b) Gold Treatments ... 13
OBSERVATIONS ... 13
(a) Hormone Treatment : 13
11
.
C H A P T E R III.
M A SYNTHESIS ... 15
INTRODUCTION .... 15
MATERIALS AND METHODS ... 16
Administration of isotopei ... 16
Centrifuged chromosome preparations: ... 17
Autoradiography * ... 17
Analysis of Autoradiographsî ... 18
OBSERVATIONS ... 19
C H A P T E R IV. DISCUSSION ... ... ... .. 21
C H A P T E R V. INVERSION HETEROZYGOSITY AND CHIASM DISTRIBUTION ... 35
INTRODUCTION ... 35
MATERIALS AND METHODS ... 37
Squash preparations ; 37
OBSERVATIONS ... 38
DISCUSSION .... 40
SUMMARY ... 46
ACKNOWLEDGEMENTS ... 47
1
.
ABSTRACT
Observations have been carried out on the lampbrush chromosomes of Notophthalmus (Triturns) viridescens. the American newt; especially of chromosome II and XI. Chromosome II regularly bears two and occasionally three pairs of giant loops situated close to the centromere. The giant loops are distinguished from the majority of the nomal loops by the greater bulk of their matrix and their length, which may vary from 60 pm to 300 pi. The giant loops are usually observed as single loop pairs arising from a single ohromomere but occasionally they occur as multiple loop pairs from a single ohromomere. The giant loops also show variation in the distribution of their RNP matrix and more than one polarised matrix unit may be present on a single loop. The size of the loops and the
matrix distribution pattern around any one loop pair is constant in oocytes ranging in siae in any particular animal.
The effect of increasing and decreasing the metabolic rate of the newt, by using homione injections and cold treatment respectively, on the length and matrix distribution patterns of the giant loops was investigated.
Hormone injections may cause changes in loop length, usually an increase but in one case a decrease, or have no effect. This may be due to the initial loop length or the level of gonadotrophin already present in the animal. After hormone injections the matrix distribution pattern, in multipolarised loops, alters with an increase in the proportion of the
loop occupied by the first matrix unit* The constancy of loop characteristics over a range of oocyte sises and the effect of hormone treatment are dis
cussed in terms of matrix moving round a stationary loop axis.
Cold treatment causes a dramatic shortening of the majority of lateral loops but leaves the giant loops virtually unaltered. Autoradiographic
2
.
is half the rate of synthesis on the ordinary loops and that the BM. transcribed by the giant loops contains very little guanine. These results are discussed in terms of differing rates of R M polymerase movement or attachment, different types of RHA polymerase molecules and the organisation of highly repetitive sequences in the genome.
The effect of inversion heterozygc aity on chiasma distribution in bivalent XI was also studied, 15 out of 94 females studied were
heterozygous for an inversion involving almost the whole of the longer
arm of bivalent XI and including the sequentially labelling loops situated close to the end which are transferred, by the inversion, to a position close to the centromere. The chiasma distribution in normal bivalents XI was compared with that of nomal bivalents II and Inversion hétérozy gote bivalents XI. Normal bivalents XI have ohiasmata restricted to the chromosome ends while normal bivalents Hihave unrestricted distribution of ohiasmata. In inversion heterozygote bivalents XI no ohiasmata at all are formed in the longer inverted arm p#ir and ohiasmata become dis tributed throughout the length of the shorter non-inverted arm pair,
C H A P T E R I.
GENERAL INTRODUCTION TO THE LAMPBRU8H CHROMOSOMES OF
Notonlithalmua (Triturus) •viridescens with special reference to the giant loops on chromosome II,
Lamphrush chromosomes, which are characteristic of diplotene of 1st meiotic prophase, were first observed by Flemming (1882) in sections of
salamander oocytes and by Ruokert (l892), who gave them their name, in the oocytes of the shark Pristiurus. Until 1937, when Duryee developed a
tech-nique for isolating lampbrush chromosomes into an appropriate saline and observing them in an unfixed state, there was little interest in them.
Gall (1952, 1954) made important advances in teolmique by using phase-contrast
optics and inverting the train of his phase-contrast microscope, thus making observation of the unfixed chromosomes possible at high magnification.
Following these advances in tecliniquejf lampbrush chromosomes have been
observed in the oocytes\0f a wide range of animals including molluscs
(Callan, 1957; Ribbert & lüinz, 1969; Bottke, 1973), insects (Kunz 1967a and bî Bier, îûmz & Ribbert, 1969), fish (RÜckert, 1892; Dodson, 1948), Amphibia
(Flemming, 1882; Gall, 1952, 1954, 1966; Gall & Callan, 1962; Callan, 1963,
1966; Callan & Lloyd, 1960a and b; Muller, 1974) and man (Baker & Franchi,
1967), and in the spermatocytes of certain insects such as Chironomus (Keyl, 1975) and Drosophila (Meyer, 1963? Hess, 1965; Hennig, Mayer, Hennig &
Leoncini, 1973). Recently lampbrush-like chromosomes have been observed in some plants (Grun, 1958; Spring, 8cheer, Franke & Trendelenburg, 1975).
The lampbrush chromosomes found in amphibian oocytes have proved to be extremely amenable to study for several reasons. Oocytes are easily obtainable and lampbrush stages are found for several months each year. The chromosomes are large, ranging in size from 60 ji-m for the smallest
in. Triturus viridescens (Gall, 1954) and 1000 jiia for the longest chromosome in Salamandra salamandra (Mancino, Barsacchi & Nardi, 1969) and individual chromosomes within species may he recogniized on the bases of their relative lengths, centromere positions in cases where the centromeres can be distin guished, and positions of landmark structures such as spheres and loops
with special morphology. As lampbrush chromosomes are found during diplotene of 1st meiotic prophase, the homologous chromosomes are paired to form
bivalents and are held together at various points along their length which may be ohiasmata or places where "gene products" have fused e.g. inter- homologue fusion occurs between the "lumpy" loops around the centromere of ohicmosome II of Triturus cristatus carnifex and T.c. karelinii (Callan & Lloyd, 1960b).
have provided evidence that each loop axis is composed of one IMk double helix and that the inter-ohromomeric strands are composed of two such helices (Gall, 1963» Miller, 1965) i.e. each chromatid is a single double helix molecule of DNA. It sho^tld however be mentioned that Ullerich (1970) working on the Anura and Faberge (l970) on the newt Taricha describe segments in which the loop axis appears to be composed of two double helices.
In 1954, Gall characterized the chromosomes of Triturus viridescens (n » 11 ) in a lampbrush chromosome map on the basis of their lengths such that the chromosome with the longest arm was denoted chromosome 11. The centromeres in T. viridescens resemble normal chromomeres but are larger and although they do not bear lateral loops, they occasionally have spheres attached to them. The left arm of the chromosome was selected as the one which projects furthest from the centromere. In 1960, Callan à Lloyd
characterized the lampbrush chromosomes of four subspecies of Triturus cristatus: cristatus, carnifex, karelinii and danubialis (n = 12) and they numbered the chromosomes so that the longest chromosome was denoted chromo some I, Other workers have used this convention in constructing working maps of amphibian lampbrush chromosomes (Barsacchi, Busotti & Mancino,
1970} Callan, 1966; Giorgi & Galleni, 1972; Lacroix, 1968; Mancino & Barsacchi, 1965, 1966, 1969» Mancino et al., 1969; Muller, 1974; Mardi, Ra'gghianti & Mancino, 1972) and so with Dr* Gall’s agreement, the map of Notophthalmus (Triturus) viridescens has been redraim accordingly (Callan & Lloyd, 1975).
Pig, 1. Working map of the lampbrush chromosomes of Notophthalmus (Triturus) viridescens.
Numbers in brackets are Gall’s (1954) original numbers.
Arrows indicate the centromeres, n.o. = nucleolus organizer.
Fig.1
remainder of the chromosomes are distinguished by their relative lengths and centromere positions. In Gall’s (1954) original working map the giant loops on chromosome II were drawn at a single locus, 0.55* Loci of landmark structures are denoted in decimal fractions when the chromosome is taken to be of unit length and then divided into hundredths, with the end of the left arm being taken as aero. In Callan & Lloyd’s (19Î5) ajaended map two pairs of giant loops are draim at loci 0.60 and 0.66 on chromosome II. Callan (unpublished observation) has noted that the giant loops may exhibit multiple polarity i.e. more than one thin to thick matrix unit round each loop.
A study of the lampbrush chromosomes of K. viridescens and in particular chromosome II and its giant loops was undertaken in an effort to gain
further understanding of the fundamental structural and functional organiza tion of lampbrush chromosomes.
M I B R m S m P METHODS
Animals : Adult females of the .American red spotted newt, No t onhthalmua (Triturus) viridea cens were obtained from Lee's Newt Farm, Oak Ridge, Tennessee and kept in the laboratory at 18^0.
Lamnbruah Chromosome Preparations s To obtain oocytes a newt was anaesthe tized with MS 222 (Sandoz) at a concentration of 1 ^/litre, a small incision xfas made in the abdominal wall and part of the ovary removed* The piece of ovary was placed in an embryo cup which was sealed and kept on ice.
The techniques used for isolating oocyte nuclei and removing nuclear membranes were as described by Callan & Lloyd (1960a). Oocyte nuclei were
7. melting point paraffin wax,* containing a solution of this ”5 : 1” saline with oaloium chloride at some concentration between 0.5 z 10"^ M and 1.0 X 10”^ M. Calcium ions aid the dispersal of the nuclear sap but at concentrations above 1,0 x 10~^ H cause stiffening of the lateral loops of the lamphrush chromosomes. A coverslip was placed over the preparation and sealed in position with vaseline.
Preparations of lampbrush chromosomes were made from oocytes whose diameter was in the range 0.60 mm to 1.00 for it is at this stage that the lateral loops are maximally extended. The preparations were observed with a Zeiss inverted (plankton) phase-contrast microscope. Photographs were taken with a single exposure camera loaded with Pan P film and drawings were made with either a Zeiss or a Reichert camera lucida attached to the Zeiss microscope.
OBSERVATIONS
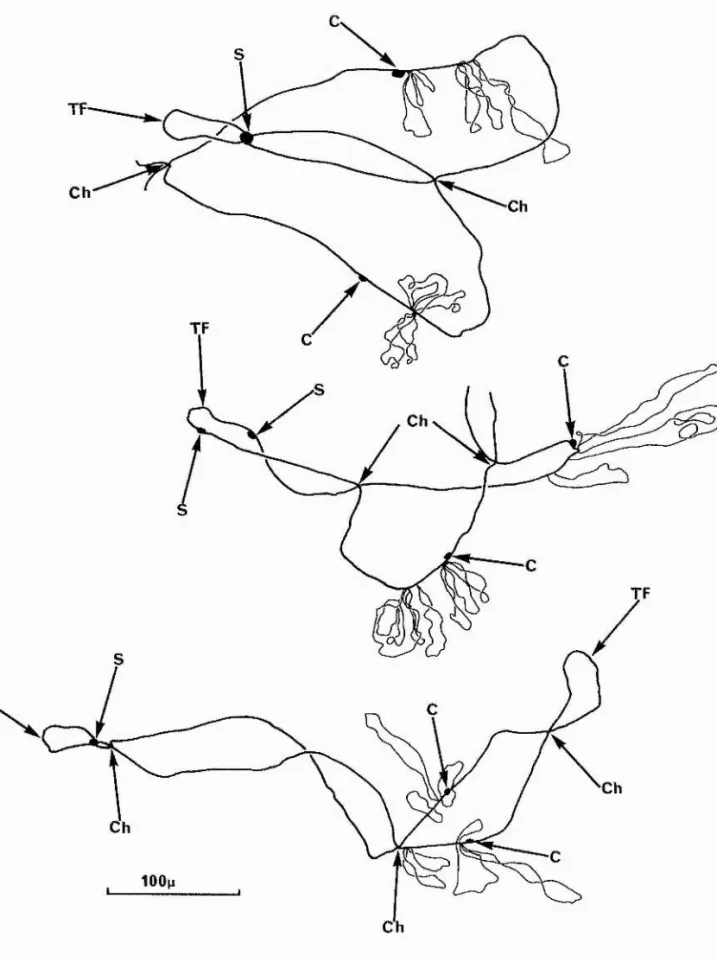
Fig* 2. Camera lucida drawings of chromosome II. C = centromere
Ch = chiasma S = sphere
TP ~ terminal fusion.
Top: Heterozygous for 3 pairs of giant loops; the pair nearest the centromere is missing on one homologue.
Middle: Heterozygous for 3 pairs of giant loops; the pair furthest from the centromere is missing on one homologue.
Fig. 2
TF
Ch
Ch
IF
Ch
TF
TF
Ch
Ch
lOOji
Fig. 5» Diagram of chromosome II to show the 5 possible loci for giant loops at 0.60* 0.63 and 0.67*
8
.
Although at each locus there is usually only a single loop pair (fig. 7a) there may, more rarely, he multiple loops coming from one locus (fig. 7h). The size of the giant loops ranges' from approximately 300 pm for very long examples (fig. 8a) to only 60 pm for small examples (fig. 8h) hut even these small examples are longer than the ordinary loops whose average length is between 40 pm and 50 pm. The matrix surrounding the loop axis may show interruptions and several different matrix distribution
patterns have been observed (fig. 9)* There may be a single polarised matrix unit running the length of the loop (fig. 9a), a single polarized matrix unit which stops abruptly, before the axis goes back into the chromo- mere (fig. 9b), or one or two interruptions in the matrix so that there are two or three polarized matrix units along the length of one loop i.e. a multipolarized loop (figs 8a & 9c)*
Oocytes have been examined within the size range 0.60 mm - 1.00 mm diameter and the matrix distribution pattern of any one pair of giant loops is the same throughout the size ranges in tm individual animal. Where
Fig* 4. Phase contrast photograph of entire chromosome II with 2 pairs of giant loops.
The arrows indicate the centromeres.
/-V
C:
Fig. 6, Phase contrast photographs to show the alternatives for the numher of giant loop loci.
a. Two pairs of giant loops whose points of origin are marked by the arrows.
Scale = 50
b. Three pairs of giant loops whose points of origin are marked by the arrowsi
Fig. 7. a* Phase contrast photograph of single loop pairs at the giant loop loci.
Scale - 50 (m
b. Phase contrast photograph of mnltiple loop pairs at the giant loop locus indicated by the arrow.
Fig. 8. Phase contrast photographs to show the differences in giant loop length.
Scale = 50 |im
Fig* 9« Phase contrast photographs to show the alternative patterns of matrix distribuion round the giant loops,
Scale - 50 (m
a. Single matrix unit running the entire length of the loop.
b. Single matrix unit which stops before the axis returns to the chromomere (arrowed).
0. Several matrix units in one loop.
o
9
.
0 H A P T E H II,
H-IYSIOLOGICAL EXPERIMMTS
INTRODUCTION
I'Jhen Callan & Lloyd (1960b) observed the polarissed asyiametry of the
ENP matrix which is attached along the lengths of the lateral loops of lampbrush chromosomes they proposed a theory to account for this polariza tion. They proposed (Callan & Lloyd, 1960a) that the thin end of the loop, with little matrix RNP, represented that part of the loop axis DNA which had most recently been extended from the parent'* chromomere, and that the thick endc>, with much matrix RNP, represented that part which had first extended and which therefore had been engaged longest in HNA synthesis. This model assumes that there are "new" and "old" regions of axis and
implies that the amount of matrix at any one point along the axis is directly related to the length of time that that point has been out of the chromomere, synthesizing RNA and accumulating matrix.
This model took no account of transcriptional movement (the nature of HNA transcription was ill-understood at the time) and is now known to
Fig* 10. Diagrams to show the two possible alternative explanations for matrix polarity.
The arrows indicate the direction of movement. A matrix packing factor (Miller & Beatty, 1969)
». :
TJ 0) C (@ "c (fl<i> c (4 E o c 0) a o > w o V a. E
>1 u </) c (0 Ifl X cr3 H n) <u
o> c >1 o o (4 c
o (0 0) rt .a a 5 (A a. u
(A E0) Co X C > a ig H
o E o> mE
10
.
Snow & Callan (1969) obtained evidence which might be used to support either theory following actinomycin D poisoning of the lateral loops of the lampbrush chromosomes of T.o. cristatus. They found that whilst most of the lateral loops recover their capacity to synthesise R M in full 2 days after treatment, there are occasional normal loops which do'.not recover completely and in which the HNA-synthesising capacity is restricted to a region adjoining the thinner insertion of the loop into the parent chromo mere, They also found that during the course of recovery following actino mycin D poisoning the giant granular loop on chromosome XII present at the time of treatment is progressively replaced by a new giant loop lying between the parent chromomere and the original loop’s dense tip. The filament that appears between the parent chromomere and the original loop’s dense tip may be "new" loop axis, or it may be axis that has been released as a result of matrix moving round a stationary axis. Snow & Callan were reluctant to
attribute the polarized asymmetry of loop matrix RNP to transcription alone because of the dimensions of the great majority of lateral loops* Many of the ordinary lateral loops of T.c. cristatus are well over 100 jjim long, yet the thickness of their loop matrix at its widest point may be no more than a micron or two. If the length of the transcribed R M molecules were, to a first approximation, equal to the length of D M traversed during trans cription, Snow & Callan envisaged that a "transcription only" explanation would require there to be much more bulky matrix on ordinary loops than is, in fact, found.
11
.
observation). There are multipolarized loops close to the left end of chromosome XII in T.c. cristatus (Makarov & Safronov, 1976) and the giant loops on chromosome II of N. viri des cens may also show multipolarity (see Chapter l). The interruptions in the matrix are thought to be initiation/ termination sites for HNA synthesis corresponding to multiple transcrip tion units in a single loop.
The majority of lateral loops label uniformly throughout their lengths if preparations are made a few hours after administration of tritiated
(%-)uridine but the giant granular loops on chromosome XII of T.c. cristatus show a sequential labelling pattern (Gall & Callan, 1962). Gall & Callan also found that injection of gonadotrophin into the newts increases the rate of travel of labelling in' the giant granular loops by a factor of 2. Macgregor (1965) investigated the effects of gonadotrophin injections on
the giant fusing loops of chromosomes X, XI and XII of T.c. carnifex. The giant fusing loops are so called because of the tendency for their matrices to fuse together; sister loop fusion is common and interhomologue fusion may occur. Intra-loop fusion of the matrix tends to obscure the underlying
ordinary structure of these loops which label uniformly after administration 3
of H-uridine. Macgregor found that, depending on their initial size, these loops remained unchanged or decreased in size, the changes being correlated with alteration of the metabolic activity of the oocytes as a result of increasing the hormone level in the anijmals.
Following on from these observations I conducted experiments to observe the effect of altering the metabolic activity on loopulength and on the position of the initiation/termination sites present in multipolarized
12
.
described in Chapter I could be attributed to physiological, rather than genetic, causes* Genetic experiments on N. viridescens are impracticable because of the "red eft" stage, a terrestrial phase lasting from 2r}r to 4
years, in the life history (Reinice & Chadwick, 1959).
MATERIALS AND METHODS
(a) Hormone Treatment; Lampbrush chromosome preparations were made according to the method described in Chapter I before and after animals received hormone injections. Each animal was given two subcutaneous injec tions of chorionic gonadotrophin (op. 776; Oiba, Aktiengesellschaft, Basel) two days apart; the first injection being given one 03? two days after an
initial examination of the chromosomes. Concentrations ranged from 10 I.ÏÏ. in 0.05 ml to 100 I.U. in 0.1 ml of distilled water or newt ringer (O.OI M 5:1 KCl:HaCl, 0.01 M Tris HCl pH 7*8). Samples of oocytes were taken at intervals following the second injection.
15
.
(b) Cold Treatment; Preparations of lampbmsh chromosomes were made according to the method outlined in Chapter I before and after the animals received cold treatment. Animals were given cold treatment by placing them at 5*^0 in a cold incubator for one week immediately following an initial examination of the chromosomes.
In these experiments again few animals survived the treatment, only 4 out of 15 experimental animals, which may have been due to placing them in the cold before they were completely recovered from the initial opera tion. However, when the reverse experiment was attempted i.e. placing animals at 5°C for one week and then observing recovery, none of the 4 experimental animals survived the cold shock. This is somewhat surprising as Call (1966) states that N« viridescens will survive quite well at
temperatures between 5° and 10®C, and both he and Dr. O.L. Miller Jr. (personal communication) store their newts at this temperature.
OBSERVATIONS
!
0 §1
0)i
i
%i
64 SCvJ ° S
M
m
N o g• *H CM o J4
CM
4J
en
o ?H
irv
IfS
H
H
CTi m§ d
4T» »H . . +*
H en
o «H
+» -p
•n> >r>
© <P a A
14
.
loop of the pair of giant loops examined. The effect of hormone treatment on matrix distribution can he seen in Table 2 and fig, 11. In both animals the length of the first matrix unit occupies a greater proportion of the loop length following hormone injections. In the case of h/i (figs 11a and 15) the first matrix unit occupies 20^5 more of the loop length than origin ally, although the actual loop length has been halved (fig, 15b), four days after the second injection. Seven days after the second in .ection the loop has recovered to its original length but the first matrix unit occupies
of the loop (fig, 15c) as compared to 45^^ before injection. At ten days after the second injection 55/^ of the loop is occupied by the first matrix unit (fig, 15d). In newt H/iI the proportion of the loop occupied by the first matrix unit alters significantly from 51^ before injection to 95fo two days after the second injection and 65^6 four days following injection but there was no accompanying change in overall loop length (fig. 11b).
(b) Oold Treatment; Pour animals survived the cold treatment that they were given. Before the treatment the giant loops on chromosome II were long, approximately 200 pm, and the normal loops were approximately 20 in length
(fig, l4a). After one week in the cold incubator at there was no signi ficant change in the appearance and length of the giant loops but the
ordinary loops appeared much shorter (fig. I4b). The chromosomes, in
general, had the appearance of those from mature oocytes in which the loops are beginning to retract into the chromomeres and the chromosome to condense, when in fact, the preparations were made from oocytes in the 0,60 - 0.80 mm
TABLE 2. Effect of hormone injection on loop len^cth and matrix distribution
Mean loop length
(i m)
Mean 1 1st
seg! (
ength of natrix nent
m )
1st segment as /6 of total
loop length H/I H/ii H/i H/II H/i H/ii Before
injection 241 190 104 97 45 51
2 days after
injection - 166 -, 158 - 95
4 days after
2nd injection 151 185 84 119 64 65
7 days after
2nd injection 250 - 157 - 60
-10 days.after
2nd injection 196 — 107 - 55 —
Fig, 11, Diagrams to show the effect of hormone injections on loop length and matrix distribution.
Arrows indicate the extent of the 1st matrix unit. a. Newt H/i
(i) The 1st matrix unit occupied 43^ of the total loop length prior to injection.
(ii) 4 days after the 2nd injection, the loop
length had been halved and the 1st matrix unit occupied 64^o of the total loop length.
(iii) 7 days after the 2nd injection, the loop length had returned to its original value but 60$^ of the loop was occupied by the 1st matrix unit.
(iv) 10 days after the 2nd injection there was
little change in loop length and the 1st matrix unit occupied 55^ of the loop.
b. Newt H/ii
(i) Prior to injection the 1st matrix unit occupied 51^ of the total loop length,
(ii) 2 days after the 2nd injection there had been no significant change in loop length but the 1st matrix unit occupied 95^ of the loop,
Pig, 13, Phase contrast photographs to show the effect of hormone injections on loop length and matrix distribution in newt H/I,
The same pair of giant loops is shown before injection (a) and at intervals following the 2nd hormone injection (b) 4 daysy (c) 7 days,
(d) 10 days.
The arrowheads mark the termination point of the 1st matrix unit.
Pig, 14. Phase contrast photographs to show the effect of cold treatment on loop length.
Scale == 50 Jim
a. Giant loops on chromosome II and surrounding ordinary loops before cold treatment,
b. Giant loops on chromosome II and surrounding ordinary loops after one week at 5^0, There has been little change in the length and
Pig, 13* Phase contrast photographs to show the effect of hormone injections on loop length and matrix distribution in newt h/i.
The same pair of giant loops is shorn before injection (a) and at intervals following the 2nd hormone injection (b) 4 days, (c) 7 days,
(d) 10 days.
The arrowheads mark the termination point of the 1st matrix unit.
Q)
Q) . (3^ O
Fig. 14. Blase contrast photographs to show the effect of cold treatment on loop length.
Scale = 50 pm
a. Giant loops on chromosome II and surrounding ordinary loops before cold treatment.
' ■ cr ■ ■ ' /)
15
.
C H A P T E R III.
RNA iSYHTHESIS
INTRODUCTION
The transcription of RNÀ by the lateral loops of amphibian lampbrush chromosomes is well established following the early observations of several groups ef workers (Call, 1958# 1963; Call & Callan, 1962; Izawa, Allfrey & Mirsky, 1963)*
Whilst the majority of lampbrush loops are uniformly labelled along their whole length an hour or two after the administration of radioactive isotope in the form of one of the precursors of RNA, there are some lampbrush loops which show different labelling patterns. Gall & Callan (1962) observed that the giant granular loops near the left end of chromosome XII in
T.o. cristatus show a sequential labelling pattern following the
administra-•5
tion of H-uridine by injection. A few hours after the injection of
H-uridine only a short region near the thin insertion was labelled, after two days the giant granular loops were labelled along l/5 of their length. Pour days after injection ^ the length of the loops was labelled, after
16
.
found that the fibrillar loops on chromosome X liave a low uptake of ^H-uridine when compared to the rest of the loops. In N. viridescens the sequential loops at the left end of chromosome XI are so called because of their labelling pattern with H-uridine; they behave just like the giant granular loop of T.o. cristatus (Gall, 1963b). In addition Gall (unpublished observations) has noticed that the rate of incorporation of ^H-uridine into the giant loops on chromosome II is considerably lower than the rate of
incorporation into the generality of the much smaller loops on the chromosomes.
In view of this observation of Gall's and my own observation that the giant loops show a lower response to cold treatment than the ordinary loops (see Chapter II), I undertook experiments to study the incorporation patterns of all four precursors of RNA into the RNA transcribed by the giant loops on chromosome II of N. viridescens.
MATERIALS AND METHODS
Administration of isotoneî Oocytes were incubated in vitro with the radioactive precursors of RNA separately, %-adenine (No. 408150B,
23 Ci/mM), &-oytidine (No. 401571, 27.3 Oi/mM), %-guanosine (no. 380302, 19 Oi/mM) and "^H-uridine (No, 345471, 25 Oi/mM) were obtained from the
17
.
Centrifuged chromosome preparations; Lampbrush chromosomes were isolated, as described in Chapter I, into a 25 mm diameter ring chamber suitable for centrifugation* These chambers were made by cutting and grinding a 3" by V* bored slide and then sealing a 22 mm circular ooverslip across the hole in the centre of the ring with low melting point paraffin wax* After isolation, the chromosome preparation was covered with a 22 mm diameter ooverslip. The ring chambers were placed in polypropylene centrifuge tubes containing
flat-topped Araldite plugs, and were spun at 3,000 rpm (1055 g) for 5 minutes in a Servall bench centrifuge fitted with a swii#ng head rotor. After
centrifugation the lateral loops of the lampbrush chromosomes are flat and anchored to the floor of the chamber.
Autoradioa'raphv; Centrifuged preparations of lampbrush chromosomes were made and fixed in a 4fo solution of commercial formalin for 15 minutes (they may be left overnight at this Stage if necessary). The ooverslip, with attached preparation, was removed from the ring chamber, washed in running filtered tap water to remove the formalin, placed for 5 minutes in freshly prepared ice-cold trichloroacetic acid for extraction of any unincorporated
precursors, again washed in running filtered tap water, followed by distilled water. The preparations were then taken through an alcohol series to two changes of xylene to remove the wax from the coverslips, two changes of acetone to remove the xylene and air-dried. The coverslips were attached to 3" by 1" microscope slides with the minimum amount of Canada Balsam necessary, with the chromosome preparation uppermost and exposed.
18
.
25«5 ml ^Vl5 KHgPO^^, 170 ml distilled water)'. They were left for 1 hour at 40^0, then washed in distilled water and air-dried.
All the preparations were filmed in a darkroom with Kodalc NTB-2
dipping emulsion diluted with distilled water to half its original strength. After drying in a stream of air, the preparations were placed in light-tight boxes sealed with adliesive tape, and stored in a refrigerator during exposure. The autoradiographs were developed for 2^ minutes in freshly prepared
Kodak D-19 at 20°0, washed in distilled water, fixed in Kodak Unlfix, washed in filtered tap water followed by distilled water and air-dried. Study of the autoradiographs was made by placing a drop of distilled water and then a ooverslip over the preparations and observing them under phase contrast optics using a Zeiss standard ¥-L microscope.
For photography the preparations were stained in 0.0375% toluidine blue for 45 minutes and photographed through an Ilford 404 green filter and a green Zeiss interference filter using a x 40 apochromatic oil immersion objective and bright field optics* Immersion oil placed directly on the preparation can be removed by petroleum ether followed by acetone and air-drying.
Analysis of Autoradiographs! Oocytes from five animals were allowed to incorporate the individual precursors. Test slides were developed at
intervals to ascertain appropriate exposure times, which varied from 7 - 17 days in the cases of adenine, cytidine and uridine; to achieve a comparable level of labelling for guanosine it was necessary to expose the slides for between 12 and 26 weeks.
The developed autoradiographs were analysed in the following way. Camera lucida drawings, using a Reichert camera lucida, were made of the giant loops on chromosome II and a number of unidentified ordinary loops
19
.
which happened to lie conveniently such that the total length of the ordinary loops which were dram exceeded that of the giant loops in each preparation analysed* The nunher of silver grains was counted over the dram loops. The average width of the giant loops was found to he 1,65 pm and that of the ordinary loops 0,83 pm. The correction for background was made by
multiplying the assumed area of the loops by the background correction factor to calculate the number of grains over the loops which could be attributed to background. This figure was then subtracted from the original grain count to give the corrected grain count. The background correction factor was derived by counting the number of grains in six different areas on each
2
slide, selected at random; each area measured 900 |m . Grains were counted within the area and lying on one vertical and one horizontal line bordering each area, the same lines being used for each area counted. The number of
2
grains per pm was calculated for each preparation and this was the background correction factor. The corrected grain count was then divided by the measured loop length to derive the number of grains per pm. A ratio of grains per |m for giant loops to ordinary loops was then calculated.
OBSERVATIONS
TIBIB 3. Incorporation of H-adenlne into the giant loopè on ohromoeome II and the ordinary loops of N. viriieacena Female Oocyte %ype of loop lengthTotal
drawn Total grain count Assumed ! loop area (»A^)
1 1 OL 815 335 1353
(Exposed Ordinary 769 605 638
17 days) 2 GL 804 266 1334
Ordinary 875 559 726
3 GL 344 130 572
Ordinaiy 1029 562 854
4. GL ,733 227 1219
Ordlnarv 1000 607 330
, 2 1 GL ' . 921 289 1529
(Exposed Ordinary 835 568 693
14 days) 2 GL , 414 273 688
Ordinary 693 853 575
3 GL , 738 556 1225
Ordinary 993 962 824
4 GL \ 316 196 526
Ordinary 773 659 642
5 GL \ 578 390 960
• Opdiiuarv 957 700 794
, 3 1 . GL 461 245 766
(Exposed Ordinaiy 1213 730 1006
14 days) 2, GL 367 206 609
Ordinary 1136 946 943
3 GL .. 462 . 222 767
Ordinaiy 1314 1201 1090
4 GL 365 153 607
6l4 540 509
, 4 1 GL . 822 73 1364
(Exposed Ordinary 901 159 748
10 days) 2 GL , 857 192 1422
■ Ordinary 941 444 781
3 GL , 861 103 1429
Ordinary 762 208 632
4 GL , 851 62 1413
OrdlnATv 850 139 705
, 5 1 GL 547 44 909
(ibcposed Ordinary 906 201 752
7 days) 2 GL ’ 803 396 1333
Ordinary 709 641 588
3 . GL 928 370 1541
Ordinary 918 505 762
4 GL 901 132 1496
Ordinaiy 747 . 170 620
5 GL 592 , 64 982
Ordinary 820 314 681
6 GL 675 221 1120 1
Ordinary 845 494 702
7 GL 368 83 612
Ordinary 831 315 690
8 GL 351 43 583 1
Background Applied Corrected Level Relative correction background grain of level of factor correction count labelling labelling (grains/ \^) (grains/n) (OLs/Ordinary)
0.02 27 ' 308 0.38 0,49
0,02 13 592 0,77
0,02 27 239 0.30 0,48
0,02 14 545 0.62
0,02
0,02 1117 545119 0,340.53 0,64
0,02 24 ■ 203 0,28 0.47
0.02 17 590 ___ 0.59
0,03 45 . 244 0.26 0.40
0.03 21 • 547 0.65
0,06 41 232 0,56 0.47
0.06 34 819 1.18
0,09 110 446 0,60 0.67
0,09 74 888 0,89
0,05 26 170 0.54 0.67
0,05 32 627 0.81
0,03 29 361 0.62 0.87
0i03 ...24... 676 0.71
0,02 15 230 0.50 0.85
0,02 20 710 0.59
0.02 12 194 0,53 0.65
0.02 19 927 0,82
0.06 46 176 0,38 0,44
0,06 65 1156 0,86
0,03 18 135 0,37 0,43
0.03 15 525 0.85
0.01 13 60 0.Û73 0.43
0.01 7 152 0.17
0.02 26 164 0,19 0.42
0.02 16 428 0,45
0,02 29 74 0,066 0.34
0,02 13 195 0,25
0.01 14 48 0,056 0.37
0.01 7 132 0.15
0.01
0,01 98 19335 0.0640.21 0.30
0.02 27 369 0,46 0.52
0,02 12 629 0.89
0.02 31 339 0.36 0.68
0.02 15 490 0.53
0,01 15 117 0.13 0.59
0.01 6 164 0.22
0.01 10 54 0.091 0.25
0.01 7 307 0,37
0.02 22 199 0,29 0.51
0.02 14 480 0.57
0.01
0.01 76 30877 0.210,37 0.57
1 0,01 6 37 0.10 0.32
1 0,01 6 223 0.31
TABIiS 4* Incorporation of ^B-cytidlne into the giant loop* on efaroBoaoBO II and the ordinary loops of w. vividmmcamm
Ibaala Oocyts ïype of loop lengthTotal drawn (li) Total grain count Asiuaad loop area (n^)
1 1 OL 270 114 449
(Exposed Ordinary 883 423 731
17 days) 2 01 $31 455 1047
Ordinary 1241 825 1030
3 01» 511 375 849
Ordinary 1184 869 983
4 GL 838 431 1'!02
Ordinary 1065 536 884
5 OL 922 410 1530
Ordinary 674 362 559
6 OL 569 290 945
Ordinary 1061 665 881
7 OL 463 206 768 Ordinary 711 369 590
8 CL 538 247 893
..893 462 ...741
^ 2 1 OL 593 439 965
(Sxposod Ordinary 842 731 699
14 days) 2 OL 619 506 1026
Ordinary 751 680 624
3 OL 891 663 1479
Ordinary 948 704 787
4 OL 413 383 686
Ordinary 833 766 691
5 OL 652 307 1082
Ordinary 822 419 682
6 OL 393 395 652
689 . 572...
1 CL 407 327 676
(Exposad Ordinary 943 909 782
14 days) 2 OL 486 364 806
Ordinary 975 802 809
3 GL 390 257 647
Ordinary 786 614 653
4 OL 514 387 853
Ordinary 803 713 667
5 GL 526 367 877
Ordinary 1175 902 975
6 OL 403 244 670
1034 758 859
, 4 1 OL 220 241 365
(Sxpossd Ordinary 555 592 461
10 days) 2 OL 496 301 324
Ordinary 615 409 510 i
3 OL 291 333 483
Ordinary 444 493 369 1
4 OL 384 304 605
660 772 548 __ _ I
, 5 1 OL 579 632 061
J
(atp<N9Sd Ordinary 711 1119 590 1
7 days) 2 OL 400 378 664 M
Ordinary 667 622 554 ■
3 OL 615 408 1022 ■
Ordinary 894 656 742 ■
4 GL 344 446 571 ■
Ordinary 760 1073
5 OL 461 237 765 M
Ordinary 847 521
6 GL 350 240 581
Ordinary 742 516
7 OL 376 235 624
Baokgrouad Applied Corrected level Relative oonreotion background grain of level of factor ocrreotioa count labelling labelling (gratna/|i^) (graina/p) (OLa/Ordinaaey)
0,01 4 110 0,41 0.87
0.01 7 416 0,47
0,01 10 445 0.71 1,06
0,01 10 615 0,66
0.02 17 356 0,70 0,97
0,02 20 849 0*72
0,03 42 369 0,46 0,96
0.03 27 509 0.46
0.05 46 364 0,39 0,76
0,03 17 345 0,51
0.01 9 281 0,49 0,79
0.01 9 656 0,62
0.02 15 191 0.41 0,82
0,02 12 357 0.50
0,02 16 229 0,43 0,86
0.02 15 447 0.50
0,03 30 409 0,69 0,62
0,03 21 710 0,64
0,04 41 467 0,75 0,86
0.04 25 655 0,87
0,03 44 619 0.69 0,96
0*09 24 660 0.72
0*03 21 362 0.86 0,96
0*03 21 747 0,90
0*01 11 296 0,45 0.90
0.01 7 412 0.50
0.04 26 369 0,94 0,76
0.04 23 653 1.21
0*02 13 314 0,77 0,81
0*02 16 893 0.95
0*03 24 340 0,70 0,88
0*03 24 776 0,60
0,02 13 244 0.63 0,63
0,02 13 601 0,76
0,03 26 361 0,70 0.81
0.03 20 693 0,86
0,03 26 341 0,65 0.86
0,03 29 673 0.74
0.01 7 237 0,59 0.62
0.01 9 •729 0.72
0,05 16 225 1.01 0.99
0,05 23 569 1,02
0,02 16 285 0.57 0,88
0,02 10 399 0,65
0.07 34 299 1*03 0,96
0,07 26 467 1,05
0.02 12 292 0,80 0,70
L 0.02 11 761 1.15
1 0.02 19 613 1,06 0,68
1
0,02 12 1107 1,56■ 0,01 7 371 0,93 1,01
■ 6 616 0.92
10 398 0,65 0,89
■ 0.01 7 649 0,73
0,01 6 440 1,28 0.91
6 1067 1,40
0,01
a
229 0.59 0,977 514 0.61
6 234 0.67 0.97
6 510 0.69
^ B
6 229 0,61 0,92^ B
7 520 0,66TABLE 5. Incorporation of H-guanosine into the giant loops on chromosome II and the ordinary loops of N. viridescens Female Oocyte Type of loop lengthTotal
drawn (w) Total grain count Assumed loop area (p2)
, 1 1 GL 793 83 1316
(Exposed Ordinary 1079 303 896
26 vks) 2 GL 307 30 509
Ordinary 721 221 598
3 GL 443 36 736
Ordinary 650 216 533
4 GL 253 55 420
Ordinary 706 255 586
5 GL 537 'Â 61 891
Ordinary 703 246 584
, 2 1 GL 764 108 1268
(Exposed Ordinary 1085 526 901
26 wks) 2 GL 976 207 1620
07*dlrmrv 1272 660 1056
fEfnnSAH 1 GL 234 23 388
25 wks) 2 OrdinaryGL 412302 17862 342502
Ordinary 682 479 566
3 GL 269 27 481
Ordinary 783 283 650
4 GL 318 33 529
Ordinary 544 155 452
5 GL 657 86 1091
850 494 ... . 705...
4 1 GL 549 38 912
(Exposed Ordinary 599 116 498
12 wks) 2 GL 626 83 1039
Ordinary 460 196 382
3 GL 544 19 903
Ordinary 596 45 495
4 GL 697 51 1158
Ordinary 584 182 485
5 GL 164 19 273
OrdinATv 391 117 324
, 5 1 GL 326 15 540
(Exposed Ordinary 889 106 738
12 wks) 2 GL 618 27 1026
Ordinary 729 68 605
3 GL 738 33 1225
Ordinary 744 93 618
4 GL 442 23 735
Ordinary 889 141 738
5 GL 439 16 730
Ordinary 786 82 652
6 GL 525 17 871
Ordinary 847 111 704
7 GL 326 25 540
Ordinary 789 100 655 1
8 GL 495 20 821 1
Ordinary 840 169 697 1
9 GL 368 20 611
J
Background Applied Corrected Level Relative correction background grain of level of factor correction count labelling labelling (grainà/*i^) (grains/^) (GLfl/Ordinaxy)
0.01 13 70 0,09 0,33
0.01 9 294 0,27
0,01 5 25 0,03 0,27
0.01 6 215 0.30
0.02 15 21 0.05 0.16
0.02 11 205 0,32
0.01 4 51 0.20 0.57
0.01 6 249 0,35
0.01 9 52 0.10 0.29
0.01 6 240 0.34
0.04 50 58 0.08 0,18
0.04 36 490 0.45
0,06 97 130 0.13 0,28
0.06 63 597 0.47
0.02 8 15 0,06 0,14
0.02 7 171 0,42
0,05 25 37 0,12 0.18
0.05 28 451 0,66
0,02 10 17 0,06 0.18
0.02 13 270 0,34
0.02 11 22 0,07 0.26
0.02 9 146 0.27
0.02 22 64 0,10 0.18
0.02 14 480 0.56
0.02 18 20 0,036 0,20
0.02 10 106 0.177
0.04 40 43 0,07 0,18
0,04 15 181 0.39
0.01 9 10 0,018 0.27
0.01 5 40 0.067
0,02 23 28 0.040 0.14
0,02 10 172 0,29
0,02 5 14 0,085 0.30
0.02 6 ill 0.28
0.01 5 10 0.031 0,28
0.01 7 99 0.11
0.01 10 17 0.027 0.32
0,01 6 62 0.085
0,01 12 21 0.028 0.23
0,01 6 87 0,12
0,01 7 16 0.036 0,24
0.01 7 134 0,15
0,01 7 9 0,021 0.22
0,01 7 75 0.0%
0,01 8 9 0,017 0,14
0.01 7 104 0,12
0.01 5 20 0.061 0.51
1 0.01 7 93 0,12
1 0,01 8 12 0,024 0,13
1 0.01 7 162 0,19
1 0,01 6 14 0.038 0.19
B 0,01 6 153 0,20
TABLE fi* Incorporation of H»nridlno into tho giant loop# oa chro#o#o— II and th# ordinary loop# of H- virldaacon#
Total Total Aaaumed foaal# Oooyt# lÿpa of loop length
drawn
(m)
grain
count awaloop (1*2)
1 1 GL 600 145 996
(l5q>0#ed Ordinary 892 412 741
17 day#) 2 GL 744 162 1235
Ordinary 792 372 656
5 GL 596 146 990
Ordinary 882 398 732
4 GL 558 104 926
Ordinary 927 313 769
5 GL 931 160 1545
Ordinary 873 243 724
6 GL 1292 306 2145
Ordinary 1173 465 973
7 GL 823 181 1366
1188 468 986
, 2 1 GL 1269 350 2106
(Ezpoaad Ordinary 1327 726 1102
14 day#) 2 GL 431 227 715
Ordinary 648 528 538
3 GL 564 182 937 Ordinary 1378 883 1144
4 GL 426 309 707
Ordinary 526 499 436
5 GL 520 166 863
750 438 622
(Expo##d
14 day#) 12 OrdinaryGLGL 1303862293 795239126 14641BB2487
Ordinary 696 490 578
3 GL 317 92 527
Ordinary 886 376 735
4 GL 353 65 587
Ordinary 726 245 604
5 GL 486 105 806
Ordinary 928 315 770
6 GL 425 52 705
566 172 486
, 4 1 GL 457 116 759
(Hxpo#ad Ordinary 772 300 640
10 day#) 2 GL 579 225 961
Ordinary 510 336 423
3 GL 917 316 1g22
810 441
, 5 1 OL 796 124 1325
(Kxpo#ad Ordinary 814 346 675
7 day#) 2 GL 484 112 803
Ordinary 700 289 561
3 GL 720 63 1195
Ordinary 978 240 812
4 GL 459 85 762 1
Ordinary 867 309 719 1
5 QL 604 47 1003 1
Ordinary 904 217 750
6 GL 586 69 974
Ordinary 863 285 733
7 QL 314 50 521 ^ B
Ordinary 694 271 576
8 GL 639 67 1061
Ordinary 1036 274 860
9 GL 357 31 583 ^ ^ B
Background Applied Corrected level Relative oorreotion background grain of level of factor oorrectiott count labelling labelling (graina/p^) (grain#/»*) (Oit/Ordixmry)
0.02 20 125 0,21 0,48
0.02 15 397 0,44
0,01
0,01 127 150365 0,200,46 0,43
0,01 10 136 0,23 0,52
0,01 7 391 0,44
0,01 9 95 0,17 0,51
0,01 8 305 0,53
0*01 15 145 0,16 0.59
0,01 7 236 0.27
0,02 23 283 0,22 0.58
0,02 19 446 0,38
0,01 14 167 0,20 0,53
0.01 ___ 10 458 0.38
0,01
0,01 2111 329715 0,260,54 0,48 0,01
0,01 75 220523 0.510,81 0.63 0.01
0.01 119 872173 0,310,63 0,49
0,02 14 295 0,69 0,74
0,02 9 490 0,93
0.01 9 157 0,30 0.52
0.01 6 432 0-58
0,01
0,01 1511 224784 0.250.60 0,42
0,02 10 116 0,40 0,58
0,02 12 478 0,69
0,01 5 87 0,27 0.64
0.01 7 369 0.42
0,01 6 59 0,17 0,51
0.01 6 239 0.33
0,01 6 97 0,20 0.61
0,01 8 307 0,33
0,01 7 45 0.11 0.39
5 167 0.28
0,01 8 108 0,24 0,63
0.01 -i6 294 0.38
0,02 19 206 0.36 0.56
0,02 8 328 0,64
0,02 30 286 0,31 0.58
13 428 0.53
0,01 13 111 0,14 0.33
0.01 7 339 0.42
0,01 8 104 0.21 0,52
0,01 6 285 0.40
0,01
0,01 126 23251 0,0710.24 0,30 1 0,01
1 0.01 87 30277 0.170.35 0,49
1 0.01 10 37 0,061 0,26
B 0.01 8 209 0,23
B 0.01
B 0.01 107 27859 0,310.10 0,32
B 0,01 5 45 0,14 0.37
6 265 0,38
11 56 0,088 0,34
^ B 9 265 0.26
^ B 6 25 0.071 0.42
^ B 0.01 3 67 0.17
20
.
(fig. 15b, Table 4) the ordinary loops incorporate 1.1 times as much, for guanosine (fig. 15c, Table 5) the ordinary loops incorporate 4 times as much label as the giant loops* By making the comparisons within single nuclei the precursor pool problem is circumvented as there is a common specific activity of precursor within a single nucleus (although this will vary from nucleus to nucleus).
Edstrom & Gall (1963) isolated chromosomal RNA from N. viridescens oocytes and analysed its base composition (column 3 of Table 7). Since the ratio for the level of label in the giant loops with respect to the ordinary loops is kjaoî-m, the base ratio of the RNA transcribed by the giant loops
can be calculated by multiplying the ratio for the level of label incorporated for each precursor by the amount of that residue as determined by Edstrom & Gall for the total chromosomal RNA (Table ?)* The 5th column of table 7 shows the base ratios of the giant loops' RNA expressed as percentages. There is an extreme imbalance between guanine (9.2^0 and cytidine (38.5%), which in turn implies a comparable imbalance between the transcribed and non-transcribed strands of the DNA in the giant loops' axes, with some 4 times more guanine residues in the former than the latter*
It will be recalled that Gall originally noted the relatively low rate 3