Asymmetrical temporal estimation error with two moving objects persists across different
absolute time-to-contact and vertical location
Simon J Bennett1, Makoto Uji1 & Robin Baurès2
1 Research Institute for Exercise & Sport Sciences, Faculty of Science, Liverpool John Moores
University, Liverpool, UK
2 CerCo, Université de Toulouse, CNRS, UPS, France
Address of the corresponding author:
Simon Bennett
Professor of Sensorimotor Neuroscience
School of Sport and Exercise Sciences
Tom Reilly Building, Byrom Street, Liverpool, L3 3AF
0151 904 6257
Abstract
1
Although human observers make temporal estimations regarding the approach of more than one
2
object, there is an asymmetric pattern of error consistent with prioritizing the lead object at the
3
expense of the trail object. We examined temporal estimation error in a prediction motion task where
4
two objects moved along horizontal trajectories (5 or 7.5 deg/s) that had different vertical separation,
5
and thus placed specific demands on visuospatial attention. Results showed that participants were
6
able to accurately judge arrival order, irrespective of vertical separation, in all but two conditions where
7
the object trajectories crossed close to the arrival location. Constant error was significantly higher for
8
the object that trailed, as opposed to led, by 250 or 500 ms. Asymmetry in constant error between the
9
lead and trail object was not influenced by vertical separation, and was also evident across a range of
10
arrival times. However, while the lag between concurrent temporal estimations was scaled to the
11
actual difference in object arrival times, lag did increase with vertical separation. Taken together, our
12
results confirm that temporal estimation of two moving objects in the prediction motion task suffers
13
from an asymmetrical interference, which is likely related to factors that influence attentional allocation.
14
15
16
17
Keywords: Time-to-Contact Estimation; Psychological Refractory Period, Multiple Objects; Attentional
18
Allocation
19
Asymmetrical temporal estimation error with two moving objects persists across different
1
absolute time-to-contact and vertical location
2
An individual’s capacity to estimate the arrival time of a moving object at a specific location,
3
which is also known as time-to-contact (TTC), has often been assessed with the prediction motion
4
(PM) task. Having seen the initial part of an object’s trajectory prior to occlusion, the participant is
5
required to make a response (e.g., button press) that coincides with arrival time of the unseen object
6
at a known target. Typically, there is a linear relationship between estimated and actual arrival-time,
7
with a slope that is less than unity (Caird & Hancock, 1994; Yakimoff, Bocheva, & Mitrani, 1987;
8
Yakimoff, Mateeff, Ehrenstein, & Hohnsbein, 1993), and a transition from overestimation to
9
underestimation of arrival time around 800-900 ms (Benguigui, Ripoll & Broderik, 2003; Manser &
10
Hancock, 1996; Schiff & Detwiler, 1979; Schiff & Oldak, 1990). Importantly, however, this linear
11
relationship does not hold when estimating the arrival time of two objects arriving consecutively at the
12
same location (Baurès, Oberfeld & Hecht, 2010; 2011). Temporal estimation is accurate for the lead
13
object (i.e., arrives first) but significantly overestimated for the trail object (i.e., arrives second) when it
14
trails by a short temporal delay (Baurès, DeLucia, & Olson, 2017).
15
The asymmetrical pattern of error when estimating the arrival time of two objects has been
16
described with reference to the Psychological Refractory Period (e.g., Pashler, 1994), according to
17
which the realization of a primary task (i.e., TTC estimation of the lead object) disrupts the completion
18
of a second task using the same central resource (i.e., TTC estimation of the trail object). As explained
19
by Baurès et al. (2011), TTC estimation in the PM task requires 4 steps: (1) sensory registration of the
20
TTC-relevant optical variables, (2) computation of an absolute TTC estimate on the basis of the
21
information about the objects' motion extracted at step 1, (3) preparation/timing of the motor response
22
to coincide with the estimated TTC, and (4) initiation and execution of the button press indicating the
23
estimated TTC. Using a Sperling-like (Sperling, 1960) variation of the PM task where a cue indicated
24
which of the two objects arrival time had to be estimated, Baurès et al. (2011) ruled out the
25
involvement of steps 3 and 4 in the occurrence of the PRP effect (i.e., only one motor response was
26
required). It was concluded that when two TTC estimations compete for the same limited resource
27
during steps 1 or 2, priority is given to the lead object at the expense of the trail object. In this respect,
28
the PRP effect in the PM task is consistent with over-allocation of attention rather than a capacity
29
limitation (Arend, Johnston & Shapiro, 2006; Martens & Wyble, 2010).
Unlike the rapid serial visual presentation (RSVP) task typically used to examine the PRP, in
1
the PM studies described above the two objects were both present, separated by 2 deg in the vertical
2
axis, during the initial visible period leading up to occlusion. In addition, the two objects were of
3
identical size, shape and color. Therefore, it remains an open question whether these stimulus
4
properties could have impacted upon the pattern of TTC estimation error in the PM task. For instance,
5
it is known that motion perception and pursuit eye movements both initially involve a process that
6
averages spatially separate inputs (see Heinen & Watamaniuk, 1998), with the weighting influenced by
7
spatial (Lisberger & Fererra, 1997) and temporal (Marinovic & Wallis, 2011) proximity. This averaging
8
process is subsequently surpassed by a winner-takes-all response once the decision has been made
9
to overtly attend to a particular (e.g., lead) object (for the locus of attention during smooth pursuit see
10
Khan, Lefèvre, Heinen & Blohm, 2010; Van Donkelaar & Drew, 2002). From this point onwards,
11
pursuit of a moving object places specific demands on visuospatial attention, which can influence
12
processing of other objects depending on their location (Kerzel & Ziegler, 2005; Müller, Mollenhauer,
13
Rösler, & Kleinschmidt, 2005). In the current study, therefore, we conducted two experiments that
14
examined the influence of vertical separation between two moving objects on accuracy of TTC
15
estimation. Importantly, the evolving horizontal separation depended only the respective velocity and
16
TTC of the two objects, and thus would not independently account for any differences as a function of
17
vertical separation.18
19
Experiment 120
Participants21
Fifteen male volunteers (Mage = 21 years) completed the experiment having provided written
22
consent. They had normal or corrected-to-normal vision, were healthy and without any known
23
oculomotor abnormalities. Participants were familiarized to the task and procedure, which in
24
accordance with the Declaration of Helsinki was approved by the host University local ethics
25
committee.
26
Materials and Procedure
27
Participants were sat in a purpose-built dark room, facing a 22” CRT monitor (Iiyama Vision
28
Master 505) located on a workbench at a viewing distance of 0.9 m. The head was supported with a
29
height-adjustable chin rest. Experimental stimuli were generated on a host PC (Dell Precision 670)
using the COGENT toolbox (developed by John Romaya at the Laboratory of Neurobiology at the
1
Wellcome Department of Imaging Neuroscience) implemented in MATLAB (Mathworks Inc). The
2
stimuli were presented with a spatial resolution of 1280x1024 pixels and a refresh rate of 85 Hz.
3
Estimation of TTC was determined from the moment the Y and B keys were pressed on a Razer
4
Arcosa keyboard (1000 Hz Ultrapolling) with a QWERTY key layout.
5
TTC estimates were obtained for two, black circular objects (diameter of 0.5 deg) moving at
6
constant velocity in the fronto-parallel plane against a white background. As shown in Figure 1, the
7
objects were initially presented on the left-hand side of the monitor for 2000 ms. At the same time, a
8
vertically-oriented black arrival line (0.3 deg wide and 8 deg long) was presented in a fixed location
9
(+11 deg from screen centre) on the right-hand side of the monitor. The vertical offset between the
10
objects was 0.5 or 3 deg relative to screen centre, while the horizontal offset varied on a trial-by-trial
11
basis in accord with the objects’ TTC and velocity. At the end of the 2000 ms stationary period both
12
objects moved on parallel horizontal trajectories from left to right at 5 or 7.5 deg/s. Objects’ velocities
13
were independent of each other and randomized on a trial-by-trial basis. During this time the two
14
objects did not cross paths in the horizontal axis. Then, after 600 ms the two objects passed behind an
15
invisible “occluder” and continued to move, unseen, toward the vertically-oriented black arrival line.
16
Insert Figure 1 About Here
17
TTC of one of the objects, hereafter referred to as the reference object, was fixed at 1900 ms.
18
TTC of the other object, hereafter referred to as the distractor object, was 1400, 1650, 2150 or 2400
19
ms. The reference object had a temporal difference of ±250 ms or ±500 ms relative to the distractor
20
object (hereafter referred to as ΔTTC). In half the trials the reference object arrived at the vertical line
21
first (lead), while in the other half the reference object arrived second (trail). The two objects did not
22
reappear after the occlusion. Participants were asked to press the Y key with the right index finger and
23
B key with the left index finger at the instant the upper and lower objects would have made contact
24
with the arrival line. The Y and B keys were used to ensure spatial compatibility with the vertical offset
25
between the two objects. No feedback on temporal estimation error was provided after the trial, which
26
had a fixed duration of 5000 ms. At the end of each trial a white screen was presented for 1000 ms,
27
after which the next trial commenced. No instructions were given to participants regarding how they
28
should move their eyes during the trials.
There were sixteen unique combinations of the two object velocities and four ΔTTC (see
1
Figure 2), each of which was presented 6 times (N=96). The presentation order was pseudo-randomly
2
arranged for each participant and then divided equally such that 32 trials were received in 3 separate
3
blocks. This was done for both conditions of vertical separation, thus requiring participants to complete
4
6 blocks in total (N=192). To control for potential effects of condition order, half of the participants
5
completed the three blocks with the two objects separated by 0.5 deg in the vertical axis followed three
6
blocks with the two objects separated by 3 deg. The condition order was reversed for the other
7
participants. To control for potential effects of the object’s position on the vertical axis, the reference
8
object was presented at the lower or upper vertical position on an equal number of trials.
9
Insert Figure 2 About Here
10
Data Analysis
11
Observation of the data indicated that arrival order was incorrectly perceived in 246 trials from
12
a total of 2826 trials (less than 9%). For each participant, the number of correct responses was
13
calculated for each combination of independent variables: 2 (vertical separation) x 4 (ΔTTC) x 2
14
(reference object velocity) x 2 (distractor object velocity). The data was then analysed in RStudio
15
(Version 0.99.902) using a generalized linear mixed model (R Core Team), with a binomial distribution
16
and logistic link function (i.e., binomial logistic regression). Starting with the full model, we followed an
17
iterative process in order to find the simplest model that accounted for the highest proportion of
18
variance in the data. We included only those terms involved with significant main and/or interaction
19
effects, determined by the Wald Chi Square tests (i.e., p > 0.05).
20
We used two approaches for quantifying error in TTC estimation. Similar to Baures et al.
21
(2010, 2011), we first calculated constant error (CE) for each of the two objects relative to their
22
respective arrival time (i.e., 1900ms for the reference, 1400, 1650, 2150 or 2400 ms for the distractor).
23
Positive CE indicates an overestimation of the objects arrival time, whereas negative CE indicates an
24
underestimation of the objects arrival time. According to the PRP effect reported in Baures et al.
25
(2010, 2011, 2017), we would expect much larger overestimation of the trail object compared to the
26
lead object. Second, we calculated the lag between the two TTC estimations (i.e., reference and
27
distractor object). The TTC estimation of the lead object was subtracted from the TTC estimation of
28
the trail object, thus giving a positive lag. Analysis of lag was important because it permitted us to
29
determine if participants were simply responding to the trail object at a fixed time after the lead object,
or if they were modulating the second response with respect to the actual difference in arrival times
1
between the two objects. To minimize the influence of errors in perceiving arrival order on the effects
2
of interest, such trials were excluded from the calculation of intra-participant mean data. CE and lag
3
were analysed using a linear mixed model (lme4 v1.1-7; Bates, Maechler, Bolker, Walker,
4
Christensen, Singmann & Dai, 2014), following the same iterative process described above in order to
5
determine the most parsimonious model. Participants were included as a random effect (i.e., intercept)
6
and the combination of independent variables input as fixed effects: 2 (vertical separation) x 4 (ΔTTC)
7
x 2 (reference object velocity) x 2 (distractor object velocity). The inclusion of random intercepts for
8
each participant was important in order to account for inter-participant variability in the magnitude of
9
TTC estimation error.
10
Results
11
Arrival Order
12
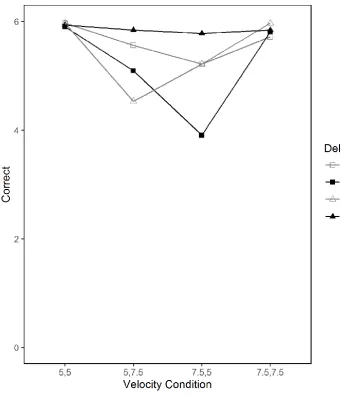
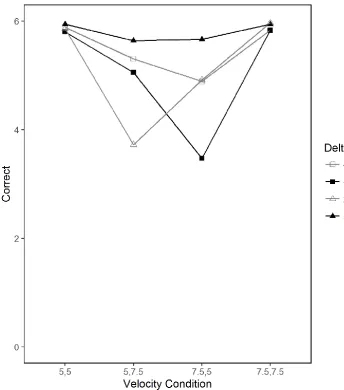
Arrival order was incorrectly perceived in 343 trials of a total 3072 trials (approximately 11%),
13
with 1 participant exhibiting no correct trials in two some of the conditions. As shown in Figure 3,
14
participants judged arrival order of the two objects with similar accuracy irrespective of vertical
15
separation. Mean number of correct responses was 5.5 (CI.95% = 4.2 : 6.8) in the 0.5 deg condition
16
and 5.5 (CI.95% = 4.2 : 6.8) in the 3 deg condition. The lack of moderation by vertical separation on
17
the number of correct responses was confirmed by binomial logistic regression, which indicated no
18
significant contribution from this factor when it was included as a main or interaction effect. The
19
removal of vertical separation produced a reduced model that fit the data better than the null model
20
(χ2
(15) = 339.69, p < .001), and accounted for 47% of the overall variance (conditional R-square). A
21
further reduction to a main effects only model produced a significantly worse fit of the data (χ2(10) =
22
213.9, p < .001) that accounted for only 29% of the overall variance. Therefore, the reduced model
23
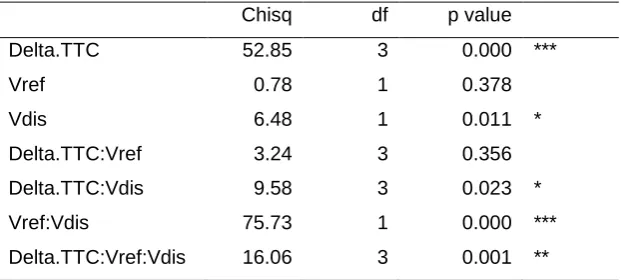
including main and interaction effects was accepted. As shown in Table 1, Wald Chi Square tests
24
indicated the number of correct responses was significantly affected by the interaction between ΔTTC,
25
reference object velocity and distractor object velocity. Tukey pairwise comparisons indicated that
26
participants made more errors in judging arrival order when the lead object moved at 7.5 deg/s and the
27
trail object moved at 5 deg/s with a delay of 250 ms (reference: M = 3.9; CI.95% = 1.6 : 6.2; distractor:
28
M = 4.4; CI.95% = 2.5 : 6.6).
29
Insert Table 1 About Here
Insert Figure 3 About Here
1
CE Reference Object
2
A full factorial model indicated that vertical separation did not moderate accuracy of estimated
3
arrival time of the reference object. Mean CE was 529 ms (CI.95% = 283 : 775) in the 0.5 deg vertical
4
separation condition and 500 ms (CI.95% = 254 : 747) in the 3 deg vertical separation condition. In a
5
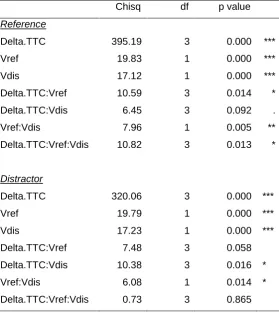
subsequent reduced factorial model, Wald Chi Square tests indicated there were main and interaction
6
effects for ΔTTC, reference object velocity and distractor object velocity (see Table 2 upper rows). The
7
reduced model produced an equally good fit as the full factorial model (χ2(16) = 5.73, p > .1) and a
8
significantly better fit of the data than the intercept-only model (χ2(15) = 336.78, p < .001). The reduced
9
model accounted for 76% of the overall variance (conditional R-square). Tukey pairwise comparisons
10
indicated that CE was greater (p < .0001) when both the reference and distractor object moved at 7.5
11
deg/s compared to all other combinations of object velocity. Independent of object velocity, there was
12
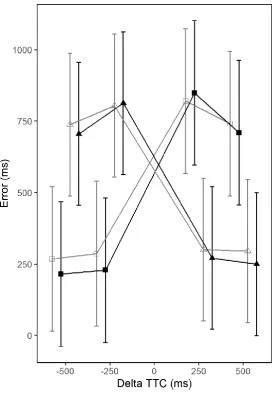
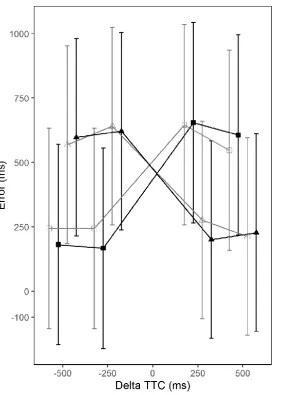
also a significant effect of ΔTTC (p < .0001). As can be seen in Figure 4, CE was significantly lower
13
when the reference object arrived before (ΔTTC -250: M = 257 ms; CI.95% = 9 : 506, ΔTTC -500: M =
14
242 ms; CI.95% = -7 : 490) compared to after (ΔTTC 250: M = 835 ms; CI.95% = 586 : 1083, ΔTTC
15
500: M = 725 ms; CI.95% = 477 : 974) the distractor object.
16
Insert Table 2 About Here
17
CE Distractor Object
18
Although the reference and distractor objects had identical visual features and an equal
19
probability of moving at 5 or 7.5 deg/s in the upper or lower vertical location, TTC of the reference
20
object was fixed at 1900 ms, whereas TTC of the distractor varied by ±250 ms or ±500 ms. Therefore,
21
the pattern of CE described above and reported in previous work (Baurès et al., 2010; 2011; 2017)
22
could be specific to TTC of the reference object, which was constant across all trial types. To examine
23
this issue, we repeated the same analysis on CE of the distractor object. The findings for the distractor
24
object mirrored those of the reference object, thus indicating the effects were not specific to a single
25
TTC (i.e., 1900ms). Once again we found no significant effect of vertical separation on CE for the
26
distractor object. Mean CE was 534 ms (CI.95% = 292 : 777) in the 0.5 deg vertical separation
27
condition and 509 ms (CI.95% = 267 : 752) in the 3 deg vertical separation condition. In a subsequent
28
reduced factorial model, there were main and interaction effects for ΔTTC, reference object velocity
29
and distractor object velocity (see Table 2 lower rows). The reduced model produced a significantly
better fit of the data than the intercept-only model (χ2
(15) = 289.57, p < .001) and accounted for 74% of
1
the overall variance (conditional R-square). CE was greater (p < .0001) when the reference and
2
distractor object both moved at 7.5 deg/s (M = 674 ms; CI.95% = 429 : 919) compared to all other
3
combinations of object velocity. As can be seen in Figure 4, CE was significantly lower when the
4
distractor object arrived before (ΔTTC -250: M = 286 ms; CI.95% = 41 : 531, ΔTTC -500: M = 272 ms;
5
CI.95% = 28 : 517) compared to after (ΔTTC 250: M = 808 ms; CI.95% = 564 : 1053, ΔTTC 500: M =
6
722 ms; CI.95% = 477 : 966) the reference object.
7
Insert Figure 4 About Here
8
Lag between TTC estimations
9
A full factorial model indicated significant main effects for all factors, and an interaction between
10
reference and distractor object velocities. A subsequent main-effects only model produced a better fit
11
than the full factorial model (χ2(25) = 45.29, p < .01), as well as the intercept-only model (χ2(6) = 184.61,
12
p < .001). The accepted main-effects model accounted for 63% of the overall variance (conditional
R-13
square). Tukey pairwise comparisons indicated that lag was shorter (p<0.01) when the objects were
14
located closer (M = 856 ms; CI.95% = 733 : 986) rather than further (M = 903 ms; CI.95% = 777 : 1030)
15
in the vertical axis. Also, lag was significantly shorter when the temporal separation between the
16
reference and distractor objects (ΔTTC) was -250 ms (M = 798 ms; CI.95% = 669 : 926) and 250 ms (M
17
= 795 ms; CI.95% = 666 : 924) compared to -500 ms (M = 980 ms; CI.95% = 852 : 1108) and 500 ms
18
(M = 953 ms; CI.95% = 825 : 1081). Therefore, while participants did not make their second TTC
19
estimation at a fixed time after the first TTC estimation, perceived lag between the two objects was
20
modulated by vertical separation (see Figure 4).
21
Discussion
22
While temporal proximity is undoubtedly a key factor in the PRP effect found when making two
23
successive TTC estimations in the PM task, here we examined if there was also an influence of
24
vertical separation between the two objects. Consistent with Baurès et al. (2010, 2011, 2017), we
25
found that temporal estimation was significantly more accurate for the lead object than the trail object.
26
Extending upon previous work, we also found that the overestimation in CE for the trail object
27
compared to the lead object was similar across a range of arrival times. Analysis of the lag between
28
the two successive TTC estimations ruled out the possibility that participants gave their second TTC
29
estimation at a fixed interval after the first estimation. Despite being overestimated per se, lag
increased in accord with the actual difference between the arrival times (i.e., 250 and 500ms).
1
Interestingly, however, we did find that lag was shorter when the objects were located closer together
2
in the vertical axis. It is not obvious from the CE data why this effect occurred. For instance, there was
3
no interaction between ΔTTC and vertical separation, whereby participants consistently
4
underestimated TTC of the lead object and/or overestimated TTC of the trail object. The finding that
5
vertical separation mediated participants’ overestimation of the interval between arrival of successive
6
objects warrants further investigation.
7
In a second experiment, we examined successive TTC estimations of two objects that were
8
either separated by 3 deg or aligned in the vertical axis. We decided not to simply increase the vertical
9
separation because it is well known processing at more eccentric locations can be less accurate
10
(Johnson, Keltner, & Balestrery, 1978; McKee and Nakayama, 1984) and/or suppressed (Kerzel &
11
Ziegler, 2005). Instead, we were interested to determine whether the absence of vertical separation
12
might influence the ability to individuate the motion paths of two objects due to overlapping attentional
13
foci at some point during their approach to arrival location (Shim, Alvarez, & Jiang, 2008; He,
14
Cavanagh, & Intriligator, 1997). Importantly, in order to minimize assimilation due to overlapping
15
attention in feature space (Blaser, Pylyshyn, & Holcombe, 2000), it was necessary to present a circular
16
and square object, which were matched with a particular key to ensure a clear stimulus-response
17
compatibility.18
Experiment 219
Participants20
Eighteen male volunteers (mean age: 21 years) completed the experiment having provided
21
written consent. They had normal or corrected-to-normal vision, were healthy and without any known
22
oculomotor abnormalities. Participants were familiarized to the task and procedure, which in
23
accordance with the Declaration of Helsinki was approved by the host University local ethics
24
committee.
25
Materials and Procedure
26
These were the same as experiment 1 except participants estimated TTC of a black circular
27
object (diameter of 0.5 deg) and black square (0.5 deg) that had vertical offset of 0 deg or 3 deg
28
relative to screen centre (Figure 1 right panel). Again, the Y key was associated with the upper object
29
and the B key with the lower object when there was a vertical separation. For half the participants, the
upper object was the square and for the others it was the circle. This ensured spatial compatibility and
1
minimized any unforeseen effects of object shape on TTC estimation when there was a vertical
2
separation. In addition, when there was a vertical separation, the reference object was presented at
3
the lower or upper position on an equal number of trials. The same association between keys and
4
object shape was used for each participant when the two objects were aligned in the vertical axis. To
5
control for potential effects of condition order, half of the participants completed the three blocks with
6
the two objects separated in the vertical axis followed three blocks with the two aligned in vertical axis.
7
The condition order was reversed for the other participants.
8
Results
9
Arrival Order
10
Arrival order was incorrectly perceived in 369 trials of a total 3456 trials (approximately 11%),
11
with 5 participants exhibiting no correct trials in some of the conditions. Analysis of the full model
12
indicated that arrival order was judged with similar accuracy irrespective of vertical separation. Mean
13
number of correct responses was 5.3 (CI.95% = 3.8 : 6.8) in the aligned condition and 5.4 (CI.95% =
14
3.9 : 6.8) in the 3° vertical separation condition. The removal of vertical separation produced a
15
reduced model that fit the data better than the null model (χ2(15) = 530.99, p < .001), and accounted for
16
47% of the overall variance (conditional R-square). A main effects only model was rejected as it
17
produced a significantly worse fit of the data than the reduced model (χ2(10) = 333.83, p < .001), and
18
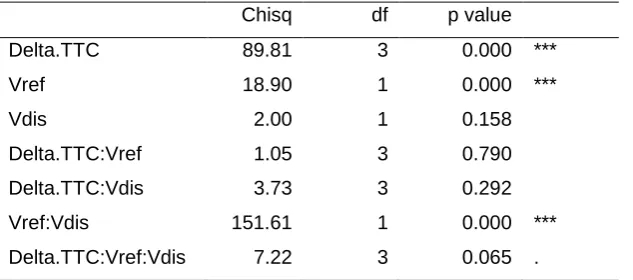
accounted for only 28% of the overall variance. Wald Chi Square tests on the reduced model indicated
19
the number of correct responses was significantly affected by ΔTTC, as well as the interaction
20
between reference object velocity and distractor object velocity. Tukey pairwise comparisons indicated
21
that participants made more errors in judging arrival order when the reference and distractor moved at
22
a different compared to same velocity. Although not quite reaching conventional levels of significance,
23
it can be seen in Figure 5 that participants again tended to make more errors in estimating arrival
24
order when the lead object moved at 7.5 deg/s and the trail object moved at 5 deg/s with a delay of
25
250 ms (reference: M = 3.5; CI.95% = 1.1 : 5.8; distractor: M = 3.7; CI.95% = 1.4 : 6.1.
26
27
Insert Table 3 About Here
28
Insert Figure 5 About Here
29
Reference Object
1
As can be seen in Figure 6, the results were very similar to those of Experiment 1, with
2
accuracy of estimated arrival time of both objects being unaffected by vertical separation. Mean CE
3
was 420 ms (CI.95% = 34 : 806) in the aligned condition and 402 ms (CI.95% = 16 : 788) in the 3°
4
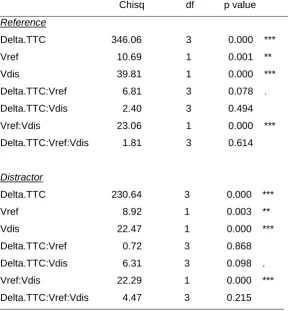
vertical separation condition. A reduced model (see Table 4) not including vertical separation
5
produced a significantly better fit of the data than the intercept-only model (χ2(15) = 324.33, p < .001)
6
and accounted for 91% of the overall variance (conditional R-square). Observation of the group mean
7
data (see Figure 6), and the outcome of Tukey pairwise comparisons, indicated that CE was greatest
8
(p < .0001) when the reference and distractor object both moved at 7.5 deg/s (M = 570 ms; CI.95% =
9
183 : 957). Independent of object velocity, there was also a significant effect of ΔTTC (p < .0001). As
10
can be seen in Figure 5, CE was significantly lower when the reference object arrived before (ΔTTC
-11
250: M = 206 ms; CI.95% = -181 : 593, ΔTTC -500: M = 212 ms; CI.95% = -175 : 599) compared to
12
after (ΔTTC 250: M = 650 ms; CI.95% = 263 : 1037, ΔTTC 500: M = 577 ms; CI.95% = 190 : 964) the
13
distractor object.
14
Insert Table 4 About Here
15
Distractor Object
16
The findings for the distractor object mirrored those of the reference object. There were no
17
significant main or interaction effects involving vertical separation. Mean CE was 424 ms (CI.95% = 45
18
: 804) in the 0.5 deg vertical separation condition and 412 ms (CI.95% = 32 : 791) in the 3 deg vertical
19
separation condition. In a subsequent reduced factorial model, there were main and interaction effects
20
for ΔTTC, reference object velocity and distractor object velocity (see Table 4). The reduced model
21
produced a significantly better fit of the data than the intercept-only model (χ2(15) = 243.43, p < .001)
22
and accounted for 88% of the overall variance (conditional R-square). CE was greater (p < .0001)
23
when the reference and distractor object both moved at 7.5 deg/s (M = 576 ms; CI.95% = 195 : 956).
24
CE was significantly lower when the distractor object arrived before (ΔTTC -250: M = 238 ms; CI.95%
25
= -143 : 619, ΔTTC -500: M = 220 ms; CI.95% = -161 : 601) compared to after (ΔTTC 250: M = 631
26
ms; CI.95% = 250 : 1012, ΔTTC 500: M = 583 ms; CI.95% = 202 : 963) the reference object (see
27
Figure 6).
28
Insert Figure 6 About Here
29
Lag between TTC estimations
1
A full factorial model indicated significant main effects for all factors, but no interactions. A
2
subsequent main-effects only model produced an equal fit as the full factorial model (χ2(25) = 12.49, p >
3
.1), and a significantly better fit than the intercept-only model (χ2(6) = 123.84, p < .001). The reduced
4
model accounted for 60% of the overall variance (conditional R-square). Tukey pairwise comparisons
5
indicated that lag was shorter (p < .01) when the objects were aligned (M = 729 ms; CI.95% = 595 :
6
862) rather than separated (M = 801 ms; CI.95% = 668 : 934) in the vertical axis. Also, lag was
7
significantly shorter when the temporal separation between the reference and distractor objects
8
(ΔTTC) was -250 ms (M = 672 ms; CI.95% = 536 : 807) and 250 ms (M = 662 ms; CI.95% = 526 :
9
797) compared to -500 ms (M = 869 ms; CI.95% = 733 : 1004) and 500 ms (M = 857 ms; CI.95% =
10
721 : 992). Again, while participants did not make their second TTC estimation at a fixed time after the
11
first TTC estimation, perceived lag between the two objects was modulated by vertical separation (see
12
Figure 6).
13
Discussion
14
We compared successive TTC estimations when two objects with different features (i.e., circle
15
and square) moved on horizontal trajectories that were aligned or separated in the vertical axis. Our
16
results confirmed the presence of a PRP effect, with more accurate TTC estimation for the lead object
17
than the trail object, across a range of absolute arrival times and irrespective of vertical separation.
18
Analysis of the lag between the two successive TTC estimations also confirmed that participants
19
moderated their response in accord with the difference between the object arrival times. However,
20
while participants waited on average and extra 170 ms between their two responses when ΔTTC was
21
500 compared to 250 ms, lag per se was largely overestimated. As can be seen in the CE data, this
22
was predominantly due to overestimating TTC of the trail object. We also found that vertical separation
23
moderated lag such that it was shorter when the objects were aligned. Observation of the CE data
24
indicated that this was not due to a systematic misestimation in TTC of either the lead or trail object. It
25
would seem, therefore, that vertical separation between two moving objects does exert a small but
26
significant on the delay between successive TTC estimations.
27
General Discussion
28
During our daily interactions within our normal surrounds, it is not unusual to make temporal
29
estimations regarding the approach of more than one object. For instance, while cycling in a town or
city one might follow the motion of other road users as they approach a junction or several pedestrians
1
while walking along a busy street (Gould, Poulter, Helman, & Wann, 2012; Baurès, Oberfeld, Tournier,
2
Hecht, & Cavallo, 2014). Such behaviours require attention to be allocated to multiple objects that can
3
have different spatiotemporal properties and physical features (for a commentary on different
4
attentional models see Tombu & Seiffert, 2008). Notably, while individuals are able to keep track of the
5
spatial evolution of multiple objects with reasonable accuracy (Cavanagh & Alvarez, 2005; Pylyshyn &
6
Storm, 1988), there is a systematic pattern of error when estimating the arrival time of two objects at a
7
known location. Specifically, it has been shown using a prediction motion (PM) task that while the
8
expected magnitude of error is made when estimating TTC of the lead object, error is significantly
9
greater if the trail object arrives within a short delay (Baurès et al., 2010, 2011, 2017). This pattern of
10
error is consistent with the well-known Psychological Refractory Period (PRP), which is thought to be a
11
result of attentional allocation rather than a capacity limitation (Arend et al., 2006; Martens & Wyble,
12
2010). In the PM task, for example, it is possible that participants increase overt attentional focus on
13
the lead object, to the detriment of the trail object, because the former demands the more behaviorally
14
urgent response (Lin, Franconeri, & Enns 2008).
15
The current study compared TTC estimation in two experiments where the two moving objects
16
had different vertical separation. The logic was that vertical separation might modulate allocation of
17
attention between the lead and trail object (He et al., 1997; Shim et al., 2008), thereby influencing the
18
pattern of TTC estimation error. In both experiments, each with different groups of participants, we
19
found the expected asymmetrical error in TTC estimation (Baures et al., 2010, 2011). As would be
20
predicted by a PRP effect, participants exhibited much larger error in estimating TTC of the trail object
21
compared to the lead object when they had close temporal proximity (i.e., <750 ms; Baures et al.,
22
2017). In addition, we showed here for the first time within a single study that this effect was not
23
specific to a single TTC. However, somewhat contrary to our initial expectation, we found no effect of
24
vertical separation between the two objects on their respective constant error.
25
The next part of our analysis examined if participants made their second response at a
26
constant delay after the first response, such as might be a strategy if they were only able to determine
27
arrival order. We ruled out this explanation by showing that participants modulated the lag between
28
successive responses in accord with the difference between the object arrival times (i.e., 250 or 500
29
ms). In other words, participants showed evidence of estimating TTC of the two objects and not TTC
of the lead object only. That said, lag per se was overestimated by approximately 300-600 ms,
1
predominantly due to greater error in response to the trail object (i.e., PRP effect). Moreover,
2
overestimation was reduced when the two objects were closer together or aligned in the vertical axis.
3
Despite being of small amplitude (i.e., approximately 60 ms), the effect of vertical separation on lag
4
was present in both experiments (with different participants) and was not due to a systematic
5
misestimation of either the lead or trail object.
6
In combination, we interpret the findings for constant error and lag between successive TTC
7
estimations as showing more effective allocation of attention when the two objects were located closer
8
together in the vertical axis. For example, having perceived object arrival order, it could be expected
9
that participants increase overt attentional focus on the lead object (Lin et al., 2008), thus leading to a
10
suppression in processing at the more peripheral vertical location Kerzel & Ziegler, 2005; Lisberger &
11
Fererra, 1997). Another, and potentially related explanation, is that having made their first response,
12
participants shifted overt attention to the trail object, which added more delay when the two objects
13
were located further apart in the vertical axis. In a single-object PM task, it has been shown that
14
participants pursue the moving object during the initial visible period and then make a horizontal
15
saccade to the arrival location, where the eye remains stationary until after the motor response
16
(Benguigui & Bennett, 2010). It would be instructive in future work with two moving objects to examine
17
if participants show the same pattern of eye movements up to the first response and then make a
18
vertical saccade that shifts overt attention to trail object. A shift of overt attention could interrupt
19
processing due to saccadic suppression, and would be more likely when the two objects are separated
20
in the vertical axis (Baurès et al., 2015).
21
When modifying velocity and TTC of two objects in the PM task, there will be a concomitant
22
and unique change in horizontal separation between the evolving trajectories (see Figure 2). The
23
influence of this spatial variable on accuracy of arrival order, and TTC estimation error, was indirectly
24
considered in our regression modelling. For estimation of arrival order in experiment 1, the significant
25
three-way interaction between velocity of the two objects and ΔTTC provided some indication that a
26
spatial variable could have been involved for specific combinations of our parameters. For instance,
27
participants made more errors in judging arrival order in trials where the lead object (i.e., reference or
28
distractor) moved at 7.5 deg/s and the trail object moved at 5 deg/s with a 250 ms delay. A similar
29
effect was evident in experiment 2, although the three-way interaction did not quite reach the
conventional level of significance. Notably, however, 3 of the 18 participants did in fact exhibit no
1
correct trials in these two conditions. It is possible, therefore, that participants failed to perceive the
2
horizontal motion paths of the two objects crossed late during the occlusion interval (see Figure 2),
3
and thus at a time when the ability to extrapolate object motion has begun to deteriorate (Bennett &
4
Benguigui, 2016; Tanaka, Worringham & Kerr, 2009; Wexler & Klam, 2001). Consequently, they may
5
have incorrectly estimated that the formerly closer object (in space) also had the shorter TTC. As often
6
found in children (Benguigui, Broderick, Baurès, & Amorim, 2008; Keshavarz, Landwehr, Baurès,
7
Oberfeld, Hecht, & Benguigui, 2010), one explanation is that adult participants used a heuristic (e.g.,
8
distance) that did not reliably provide accurate TTC information (DeLucia, 2004). That said, having
9
omitted these errorful trials, there was no effect of this particular combination of parameters on TTC
10
estimation error or lag between TTC estimations. It will be interesting in future work to a compare a
11
wider range of conditions in which the motion paths cross at different times during the occlusion
12
period, or during the initial visible period if this does not provide a reliable cue to arrival order (e.g.,
13
accelerating objects).
14
Together with the results of our recent series of studies, here we confirmed that participants
15
are unable to perform two concurrent TTC estimations with similarly high accuracy. Consistent with
16
over-allocation of attention on the most salient object, participants systematically overestimated TTC
17
of the trail object. While vertical separation did play a minor role, arrival order and temporal proximity
18
between the two objects appear to be the key factors that influence TTC estimation error in the PM
19
task. Further work is needed to investigate how attention is allocated when performing concurrent TTC
20
estimations, and whether it is possible to reduce the asymmetry in TTC estimation error.
Over-21
allocating attention on the lead object may prove successful in avoiding an initial collision but outside
22
of the laboratory this strategy could have serious consequences.
23
24
References
25
Arend, I., Johnston, S., & Shapiro, K. (2006). Task-irrelevant visual motion and flicker attenuate the
26
attentional blink. Psychonomic Bulletin & Review, 13(4), 600-607.
27
Bates, D., Maechler, M., Bolker, B., Walker, S., Christensen, R. H. B., Singmann, H., & Bolker, M. B.
28
(2012). Package ‘lme4’. CRAN. R Foundation for Statistical Computing, Vienna, Austria.
Baurès, R., DeLucia, P.R., & Olson, M. (2017). Asymmetric interference in concurrent time-to-contact
1
estimation: Cousin or twin of the psychological refractory period effect? Attention, Perception
2
& Psychophysics, 79(2), 698-711. doi:10.3758/s13414-016-1244-y
3
Baurès, R., Oberfeld, D., & Hecht, H. (2010). Judging the contact-times of multiple objects: Evidence
4
for asymmetric interference. Acta Psychologica, 134(3), 363-371.
5
doi:10.1016/j.actpsy.2010.03.009
6
Baurès, R., Oberfeld, D., & Hecht, H. (2011). Temporal-range estimation of multiple objects: Evidence
7
for an early bottleneck. Acta Psychologica, 137(1), 76-82. doi:10.1016/j.actpsy.2011.03.002.
8
Baurès, R., Oberfeld, D., Tournier, I., Hecht, H., & Cavallo, V. (2014). Arrival-time judgments on
9
multiple-lane streets: The failure to ignore irrelevant traffic. Accident Analysis & Prevention,
10
65, 72-84.
11
Benguigui, N., & Bennett, S. J. (2010). Ocular pursuit and the estimation of time-to-contact with
12
accelerating objects in prediction motion are controlled independently based on first-order
13
estimates. Experimental Brain Research, 202(2), 327-339.
14
Benguigui, N., Broderick, M. P., Baurès, R. and Amorim, M.-A. (2008). Motion prediction and the
15
velocity effect in children. British Journal of Developmental Psychology, 26, 389–407.
16
doi:10.1348/026151008X295146
17
Bennett, S. J., & Benguigui, N. (2016). Spatial Estimation of Accelerated Stimuli Is Based on a Linear
18
Extrapolation of First-Order Information. Experimental Psychology, 63(2), 98-106. doi:
19
10.1027/1618-3169/a000318
20
Blaser, E., Pylyshyn, Z. W., & Holcombe, A. O. (2000). Tracking an object through feature space.
21
Nature, 408(6809), 196-199.
22
Caird, J. K., & Hancock, P. A. (1994). The perception of arrival time for different oncoming vehicles at
23
an intersection. Ecological Psychology, 6, 83-109.
24
Cavanagh, P., & Alvarez, G. A. (2005). Tracking multiple targets with multifocal attention. Trends in
25
Cognitive Sciences, 9(7), 349-354.
26
DeLucia, P. R. (2004). Multiple sources of information influence time-to-contact judgments: Do
27
heuristics accommodate limits in sensory and cognitive processes? Advances in Psychology,
28
135, 243-285.
Gould, M., Poulter, D. R., Helman, S., & Wann, J. P. (2012). Errors in judging the approach rate of
1
motorcycles in nighttime conditions and the effect of an improved lighting configuration,
2
Accident Analysis & Prevention, 45, 432-437. doi: 10.1016/j.aap.2011.08.012.
3
He, S., Cavanagh, P., & Intriligator, J. (1997). Attentional resolution. Trends in Cognitive Sciences,
4
1(3), 115-121.
5
Heinen, S. J., & Watamaniuk, S. N. (1998). Spatial integration in human smooth pursuit. Vision
6
Research, 38(23), 3785-3794.
7
Johnson, C.A., Keltner, J. L., & Balestrery, F. (1978). Effects of target size and eccentricity on visual
8
detection and resolution. Vision Research, 18(9),1217-1222.
9
Kerzel, D., & Ziegler, N. E. (2005). Visual short-term memory during smooth pursuit eye movements.
10
Journal of Experimental Psychology: Human Perception and Performance, 31(2), 354.
11
Keshavarz, B., Landwehr, K., Baurès, R., Oberfeld, D., Hecht, H., & Benguigui, N. (2010).
Age-12
correlated incremental consideration of velocity information in relative time-to-arrival
13
judgments. Ecological Psychology, 22(3), 212-221.
14
Khan, A. Z., Lefèvre, P., Heinen, S. J., & Blohm, G. (2010). The default allocation of attention is
15
broadly ahead of smooth pursuit. Journal of Vision, 10(13), 1-17.
16
Lin, J.Y., Franconeri, S., & Enns, J.T. (2008) Objects on a collision path with the observer demand
17
attention. Psychological Science, 19, 686–692.
18
Lisberger, S. G., & Ferrera, V. P. (1997). Vector averaging for smooth pursuit eye movements initiated
19
by two moving targets in monkeys. Journal of Neuroscience, 17(19), 7490-7502.
20
Manser, M.P., & Hancock, P.A. (1996). Influence of approach angle on estimates of time-to-contact.
21
Ecolological Psychology, 8, 71–99.
22
Marinovic, W., & Wallis, G. (2011). Visual attention affects temporal estimation in anticipatory motor
23
actions. Experimental Brain Research, 212, 613–621.
24
Martens, S., & Wyble, B. (2010). The attentional blink: Past, present, and future of a blind spot in
25
perceptual awareness. Neuroscience and Biobehavioural Reviews, 34, 947-957.
26
McKee, S.P., & Nakayama, K. (1984). The detection of motion in the peripheral field. Vision Research,
27
24(1), 25-32.
28
Müller, N. G., Mollenhauer, M., Rösler, A., & Kleinschmidt, A. (2005). The attentional field has a
29
Mexican hat distribution. Vision Research, 45(9), 1129-1137.
Pashler, H. (1994). Dual-task interference in simple tasks: Data and theory. Psychological Bulletin,
1
116(2), 220−244. doi:10.1037/0033-2909.116.2.220.
2
Pylyshyn, Z. W., & Storm, R. W. (1988). Tracking multiple independent targets: Evidence for a parallel
3
tracking mechanism. Spatial Vision, 3(3), 179-197.
4
Schiff, W., & Oldak, R. (1990). Accuracy of judging time to arrival: Effects of modularity, trajectory, and
5
gender. Journal of Experimental Psychology: Human Perception and Performance, 16, 303–
6
316.
7
Schiff, W., & Detwiler, M. L. (1979). Information used in judging impending collision. Perception, 8(6),
8
647-658. doi:10.1068/p080647.
9
Shim, W. M., Alvarez, G. A., & Jiang, Y. V. (2008). Spatial separation between targets constrains
10
maintenance of attention on multiple objects. Psychonomic Bulletin & Review, 15(2), 390-397.
11
Sperling, G. (1960). The information available in brief visual presentations. Psychological Monographs:
12
General and Applied, 74(11), 1−30.
13
Tanaka, H., Worringham, C., & Kerr, G. (2009). Contributions of vision–proprioception interactions to
14
the estimation of time-varying hand and target locations. Experimental Brain Research, 195,
15
371-382.
16
Tombu, M., & Seiffert, A. E. (2008). Attentional costs in multiple-object tracking. Cognition, 108(1),
1-17
25.
18
Van Donkelaar, P., & Drew, A. S. (2002). The allocation of attention during smooth pursuit eye
19
movements. Progress in Brain Research, 140, 267-277.
20
Wexler, M., & Klam, F. (2001). Movement prediction and movement production. Journal of
21
Experimental Psychology: Human Perception and Performance, 27, 48-64.
22
Yakimoff, N., Bocheva. N., & Mitrani, L. (1987). A linear model for the response time in motion
23
prediction. Acta Neurobiologiae Experimentalis, 47, 55-62.
24
Yakimoff, N., Mateeff, S., Ehrenstein, W. H., & Hohnsbein, J. (1993). Motion extrapolation
25
performance: a linear model approach. Human Factors, 35, 501-510.
Table 1: Type II Wald Chi-Square tests for thefixedeffects included in the binomial logistic regression
on number of correct responses in experiment 1. The accepted reduced model is shown.
Chisq df p value
Delta.TTC 52.85 3 0.000 ***
Vref 0.78 1 0.378
Vdis 6.48 1 0.011 *
Delta.TTC:Vref 3.24 3 0.356
Delta.TTC:Vdis 9.58 3 0.023 *
Vref:Vdis 75.73 1 0.000 ***
Table 2: Type II Wald Chi-Square tests for thefixedeffects included in linear mixed model regression
on constant error of the reference (upper rows) and distractor (lower rows) object in experiment 1. The
accepted reduced model is shown.
Chisq df p value
Reference
Delta.TTC 395.19 3 0.000 ***
Vref 19.83 1 0.000 ***
Vdis 17.12 1 0.000 ***
Delta.TTC:Vref 10.59 3 0.014 *
Delta.TTC:Vdis 6.45 3 0.092 .
Vref:Vdis 7.96 1 0.005 **
Delta.TTC:Vref:Vdis 10.82 3 0.013 *
Distractor
Delta.TTC 320.06 3 0.000 ***
Vref 19.79 1 0.000 ***
Vdis 17.23 1 0.000 ***
Delta.TTC:Vref 7.48 3 0.058
Delta.TTC:Vdis 10.38 3 0.016 *
Vref:Vdis 6.08 1 0.014 *
Table 3: Type II Wald Chi-Square tests for thefixedeffects included in the binomial logistic regression
on number of correct responses in experiment 2. The accepted reduced model is shown
Chisq df p value
Delta.TTC 89.81 3 0.000 ***
Vref 18.90 1 0.000 ***
Vdis 2.00 1 0.158
Delta.TTC:Vref 1.05 3 0.790
Delta.TTC:Vdis 3.73 3 0.292
Vref:Vdis 151.61 1 0.000 ***
Table 4: Type II Wald Chi-Square tests for thefixedeffects included in linear mixed model regression
on constant error of the reference (upper rows) and distractor (lower rows) object in experiment 2. The
accepted reduced model is shown.
Chisq df p value
Reference
Delta.TTC 346.06 3 0.000 ***
Vref 10.69 1 0.001 **
Vdis 39.81 1 0.000 ***
Delta.TTC:Vref 6.81 3 0.078 .
Delta.TTC:Vdis 2.40 3 0.494
Vref:Vdis 23.06 1 0.000 ***
Delta.TTC:Vref:Vdis 1.81 3 0.614
Distractor
Delta.TTC 230.64 3 0.000 ***
Vref 8.92 1 0.003 **
Vdis 22.47 1 0.000 ***
Delta.TTC:Vref 0.72 3 0.868
Delta.TTC:Vdis 6.31 3 0.098 .
Vref:Vdis 22.29 1 0.000 ***
Figure Legends
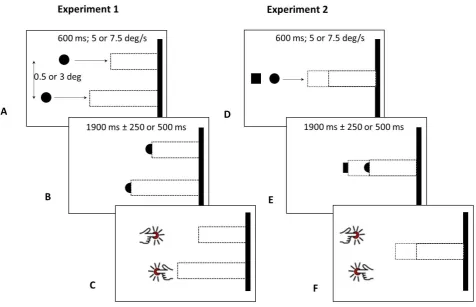
1
2
Figure 1. Representation of the visual stimulus in experiment 1 (left panel) and experiment 2 (right
3
panel). A. The visual scene initially contains two stationary objects and an arrival line (full black
4
rectangle). The two dashed rectangles represent the forthcoming occlusion of the objects, but were
5
not visible to the participants during the experiment. The two objects then move rightwards for 600 ms
6
toward the arrival line with a velocity of either 5 or 7.5 deg/s independently of each other. B. Both
7
objects are occluded at the same time, with the reference object reaching the arrival line after 1900 ms
8
and the distractor object arriving either earlier or later by 250 or 500 ms. C. Participants press a key
9
with the right and left index finger to coincide with the moment each object would have made contact
10
with the arrival line. In experiment 1, the two objects are separated in the vertical axis by 0.5 or 3 deg.
11
In experiment 2, the two objects are aligned or separated in the vertical axis by 3 deg (NB. not shown
12
to avoid replication). To avoid feature assimilation the two objects are either a circle or square.
13
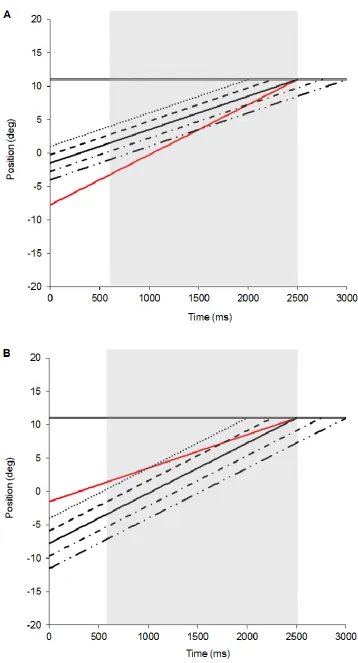
14
Figure 2. Horizontal object position as a function of time. The solid black and red lines depict the
15
reference object, which has a TTC of 1900 ms and was presented in every trial. The broken black
16
lines depict the distractor object, which has ΔTTC of ± 250 or 500 ms. Panel A shows all position
17
trajectories that included the 5 deg/s object. Panel B shows all position trajectories that included the
18
7.5 deg/s object. The light grey bar in each panel represents the onset of occlusion (600 ms) and
19
arrival time of the reference object. NB. None of the objects became visible after they reached the
20
arrival line. The double horizontal lines represent the location of the arrival line, which was constant at
21
11 deg from screen centre.
22
23
Figure 3. Group mean number of correct responses in experiment 1 as a function of ΔTTC and
24
velocity of the two objects (reference, distractor). NB. Negative ΔTTC indicates that the reference was
25
the lead object, whereas positive ΔTTC indicates that the reference was the trail object.
26
27
Figure 4. Group mean CE (± 95% CI) as a function of Delta TTC, Vertical Separation (Close = 0.5 deg;
28
Far = 3 deg) for the reference object (squares on black and grey lines) and distractor object (triangles
29
on black and grey lines). NB. Delta TTC is expressed relative to the reference object. Accordingly, -500
30
and -250 ms indicate the reference was the lead object and the distractor was the trail object.
31
Conversely, 500 and 250 ms indicate the reference was the trail object and the distractor was the lead
32
object.
33
34
Figure 5. Group mean number of correct responses in experiment 2 as a function of ΔTTC and
35
velocity of the two objects (reference, distractor). NB. Negative ΔTTC indicates that the reference was
36
the lead object, whereas positive ΔTTC indicates that the reference was the trail object.
37
38
Figure 6. Group mean CE (± 95% CI) as a function of Delta TTC, Vertical Separation (Close = 0.5 deg;
39
Far = 3 deg) for the reference object (squares on black and grey lines) and distractor object (triangles
on black and grey lines). NB. Delta TTC is expressed relative to the reference object. Accordingly, -500
1
and -250 ms indicate the reference was the lead object and the distractor was the trail object.
2
Conversely, 500 and 250 ms indicate the reference was the trail object and the distractor was the lead
3
object.