ISSN Online: 2164-2869 ISSN Print: 2164-2842
DOI: 10.4236/ojneph.2019.94011 Oct. 23, 2019 97 Open Journal of Nephrology
Acute Effects of Tolvaptan on Renal
Hemodynamics in Autosomal Dominant
Polycystic Kidney Disease
—A Randomized, Cross-Over, Double Blind, Placebo-Controlled Study of
Renal Plasma Flow and Glomerular Filtration Rate
My Helbo Malmberg
1,2*, Frank Holden Mose
1,2, Rikke Lund Sønderbæk
1,2, June Anita Ejlersen
2,3,
Jens Jørgen Jensen
3, Erling Bjerregaard Pedersen
1,2, Jesper Nørgaard Bech
1,21University Clinic in Nephrology and Hypertension, Regional Hospital Jutland West, Holstebro, Denmark 2University of Aarhus, Aarhus, Denmark
3Department of Nuclear Medicine, Regional Hospital Jutland West, Holstebro, Denmark
Abstract
Background: Previous studies have shown that reduced renal plasma flow (RPF) may play a role in progression of renal disease in autosomal dominant polycystic kidney disease (ADPKD). Tolvaptan, a vasopressin 2 antagonist, reduces growth of total kidney volume and slows the decrease in estimated glomerular filtration rate (eGFR) in ADPKD. The purpose of this rando-mized, cross-over, double-blind, placebo-controlled study was to investigate if acute tolvaptan treatment increases RPF in ADPKD patients. Methods: Eighteen ADPKD patients (chronic kidney disease stages I-III) were investi-gated twice (min. 10 days apart) after acute treatment with either tolvaptan 60 mg or placebo. Two hours after treatment RPF and GFR were estimated by Technetium-99m diethylenetriamine penta-acetic acid (99-mTc-DTPA) re-nography. During the examination day, central and brachial blood pressures (BP) were measured using Mobil-O-Graph PWA. We also measured plasma concentrations of vasopressin (p-AVP), renin (PRC), angiotensin II (p-AngII) and aldosterone (p-Aldo), urine excretion of aquaporin 2 (u-AQP2), urine output (OU), urine osmolality (u-Osm) and fractional excretion of sodium (FENa). Results: 99-mTc-DTPA renography showed a similar RPF (673 ± 262
ml/min after tolvaptan vs. 650 ± 209 ml/min after placebo, p = 0.571) and GFR (78 ± 26 ml/min after tolvaptan vs. 79 ± 21 ml/min after placebo p = 0.774) after tolvaptan and placebo treatment. P-AVP and UO increased and u-Osm decreased after tolvaptan and remained unchanged during placebo. Systolic BP tended to decrease during renography during tolvaptan. Very How to cite this paper: Malmberg, M.H.,
Mose, F.H., Sønderbæk, R.L., Ejlersen, J.A., Jensen, J.J., Pedersen, E.B. and Bech, J.N. (2019) Acute Effects of Tolvaptan on Renal Hemodynamics in Autosomal Dominant Polycystic Kidney Disease. Open Journal of Nephrology, 9, 97-114.
https://doi.org/10.4236/ojneph.2019.94011
Received: September 19, 2019 Accepted: October 20, 2019 Published: October 23, 2019
Copyright © 2019 by author(s) and Scientific Research Publishing Inc. This work is licensed under the Creative Commons Attribution International License (CC BY 4.0).
DOI: 10.4236/ojneph.2019.94011 98 Open Journal of Nephrology small or insignificant changes were seen in PRC, p-AngII and p-Aldo. Con-clusions:Acute tolvaptan treatment did not change renal hemodynamics in ADPKD.
Keywords
Autosomal Dominant Polycystic Kidney Disease, Renal Plasma Flow, Glomerular Filtration Rate, Renography, Brachial Blood Pressure, Central Blood Pressure, Vasopressin, Renin, Angiotensin II, Aldosterone
1. Background
Autosomal dominant polycystic kidney disease (ADPKD) is a common genetic disorder, characterized by formation of cysts in the kidneys, causing gradual renal failure [1] [2].
Several factors play a role in the progression of kidney disease in ADPKD pa-tients. Factors worsening the progression include mutation in the polycystin 1 gene (PKD1) compared to mutation in the PKD2 gene, male gender, early hypertension, early and frequent incidence of hematuria, three or more preg-nancies, increased total kidney volume (TKV), reduced glomerular filtration rate (GFR) and reduced renal plasma flow (RPF) [3] [4]. Patients with early-stage ADPKD had reduced RPF and increased filtration fraction (FF) [5].
A previous study has shown that tolvaptan reduced TKV growth and induced a decrease in GFR decline, estimated by the CKD-EPI-formula, in ADPKD pa-tients [6] [7]. Tolvaptan, a vasopressin 2 antagonist, dilutes urine via a reduction in adenosine 3’,5’-cyclic monophosphate (cAMP) mediated translocation of intracellular aquaporin-2 (AQP2) water channels to the apical plasma mem-brane of the collecting duct principal cells [8] [9] [10]. Tolvaptan’s effect on TKV is thought to be mediated by a reduction in cAMP, i.e. the effect should be a reduction in urine concentration ability, which is already reduced in ADPKD patients [11]. Another explanation could be that tolvaptan increased renal plas-ma flow and thereby improved the glomerulo-tubular balance. The effect of tol-vaptan on RPF has not been clarified, but previous studies have suggested that RPF remained unchanged and GFR decreased after a few weeks of treatment [12] [13]. We hypothesized that the beneficial effects of tolvaptan on ADPKD at least partly could be explained by an increase in RPF.
DOI: 10.4236/ojneph.2019.94011 99 Open Journal of Nephrology
2. Material and Methods
2.1. Study Design
In this randomized, double-blinded, placebo-controlled, crossover study, we studied patients with ADPKD after acute treatment with tolvaptan 60 mg and placebo. Each patient participated in two identical examinations on separate days with an intermediate wash-out period of at least 10 days to eliminate any carryover effects.
2.2. Randomization and Blinding
The Department of Hospital Pharmacy, Regional Hospital Jutland West coated, randomized and distributed the trial medication.
2.3. Recruitment
Eligible ADPKD patients were recruited from the Outpatients’ Clinic in Univer-sity Clinic in Nephrology and Hypertension, Regional Hospital Jutland West and University of Aarhus.
2.4. Subjects
Inclusion Criteria
ADPKD patients meeting the following inclusion criteria were included: Age 18 - 67 years. Both genders. Unfertile women or fertile women using safe con-traception throughout the trial period (safe concon-traception was defined as: birth control pills, spiral, depot injection of progestogen, subdermal implantation, hormonal vaginal ring, transdermal patch, sexual abstinence or sterilization). ADPKD diagnosed by genetic testing for PKD1 and PKD2 mutations. Presence of one of the following ultrasonographic findings in accordance with the classic Ravine criteria [14]: 1) patients with a negative family history of ADPKD with more than 10 cysts in each kidney, and exclusion of other causes of extra renal or renal cyst formations, 2) patients with a family history of ADPKD: 18 - 39 yrs. and 3 cysts or more unilaterally or bilaterally/40 - 59 yrs. and 2 or more cysts in each kidney/≥60 yrs. and at least 4 cysts in each kidney. Kidney function corres-ponding to chronic kidney disease (CKD) stages I-III (eGFR > 30 mL/min/1.73 m2).
Exclusion Criteria
DOI: 10.4236/ojneph.2019.94011 100 Open Journal of Nephrology
Withdrawal Criteria
Development of exclusion criteria, non-compliance or withdrawal of consent.
2.5. Effect Variables
The primary effect variable was RPF. The secondary effect variables were 1)
Ren-al function (GFR, FF UO, FENa, u-Osm and u-AQP-2), 2) systemic
hemodynam-ics (bBP and cBP), 3) Renovascular resistance (RVR), and 4) vasoactive hor-mones (PRC, p-AngII, p-Aldo and p- AVP).
2.6. Number of Subjects
With a minimal relevant difference of 77 ml/min in RPF and an estimated stan-dard deviation (SD) of 67 ml/min, 18 subjects were needed using a level of signi-ficance of 5% and a statistical power of 90%. Twenty subjects were included to allow for possible drop-outs.
2.7. Study Medications
Tolvaptan (SAMSCA, Otsuka, Tokyo, Japan) 60 mg and placebo were coated in identical gelatin capsules and were orally administered 2 hours before posterior Technetium-99m diethylenetriamine penta-acetic acid (99-mTc-DTPA) reno-graphy.
2.8. Antihypertensive Medications
Antihypertensive medications including diuretics, angiotensin-converting en-zyme inhibitors and angiotensin-II inhibitors were discontinued or substituted with metoprolol succinate 25 mg and/or amlodipine 5 mg 14 days prior to each examination day. During the study period, bBP was monitored using a home blood pressure monitor. At a blood pressure higher than 170/105 mmHg, meto-prolol succinate 25 mg and/or amlodipine 5 mg was given and increased up to metoprolol succinate 100 mg and/or amlodipine 10 mg. Subjects were with-drawn from the study, if the blood pressure remained higher than 170/105 mmHg despite treatment with metoprolol succinate 100 mg and/or amlodipine 10 mg. The usual antihypertensive treatment was resumed immediately after the 2. examination day. Patients were given the same dose of metoprolol succinate and/or amlodipine 14 days prior to both examination days.
2.9. Ethics
The study was approved by the Regional Committee on Health Research Ethics (case number: 1-10-72-373-14), and the Danish Health and Medicines Authority (EudraCT number: 2015-001903-30). The study was done in agreement with the Declaration of Helsinki and was registered at clinicaltrials.gov (identifier: NCT03803124). Written informed consent was obtained from each subject.
2.10. Diet
DOI: 10.4236/ojneph.2019.94011 101 Open Journal of Nephrology study period. Alcohol was prohibited on the day prior to and on the examination days.
2.11. Experimental Procedure
Procedures were identical on the two examination days. Before each examina-tion, a fasting period of 8 hours was required, and a 24-hour urine sample was collected and completed just before medicine intake. The two examination days were conducted at the Department of Nuclear Medicine, Regional Hospital Jut-land West, Denmark and on both days tolvaptan/placebo were given orally with 175 ml water before renography. Three hours before the renography, an intra-venous catheter was placed in one arm to collect blood samples. Blood pressure was measured every 15 minutes during the examination day. Blood samples were drawn 2 hours before and 1 hour after renography, and were analysed for PRC, p-Aldo, p-AngII, and p-AVP, and for plasma concentrations of sodium, potas-sium, creatinine and albumin. Urine samples were collected by voiding in standing or sitting position right before medicine intake and 1 hour after reno-graphy after blood samples had been collected. Otherwise, patients were kept in a sitting position in a quiet and temperature-controlled room (22˚C - 25˚C). Urine samples were analysed for volume, sodium, albumin, creatinine, osmolal-ity and AQP2. A 24-hour urine sample was collected immediate before trial medicine intake. The followed up period for each examination day were 3 hours after tolvaptan intake.
2.12. Measurements and Calculations
Renal function
Indirect and non-invasive measurements of the kidney parameters were esti-mated from renographies obtained by a two-headed gamma camera (Phillips Brightview SPECT or Siemens Symbia T16 SPECT/CT) positioned over the low-er thoracic/upplow-er abdominal area with the patient in the supine projection. At the time of the bolus injection (6 MBq Tc99m-diethylenetriaminepentaacetic acid (DTPA)/kg bodyweight in a cubital veina dynamic acquisition was com-menced: In the first minute, one frame per second and during the rest of the examination, one frame/10 seconds was obtained. Only images from the post-erior projections were used for the subsequent analysis. Data processing was performed in the commercial software MEDIC 2000 XP, ver. 5.9.1. As DTPA is handled almost exclusively by free filtration and no reuptake or excretion by the tubular system, the clearance of the tracer approaches GFR. Single kidney GFR was calculated from the uptake index in each kidney using a modification of the Rutland-Patlak method [15].
DOI: 10.4236/ojneph.2019.94011 102 Open Journal of Nephrology background corrected kidney activity with the calculated activity from the con-volution integral, minimizing the sum of squared differences. The analyses were performed by two nuclear medicine physicians blinded to knowledge of whether the patient had received placebo or tolvaptan.
Repeatability of the kidney parameters was calculated from a blinded re-analysis of the renographies after 1 month.
The inter- and intra-assay variation coefficient was calculated as SD/X × 100, where X denotes mean value of GFR, RPF or FF. SD denotes standard deviation, which is calculated as
(
∑d2 2k)
, where d denotes the difference between the duplicates, k denotes number of duplicates. The inter-assay variation coefficient for GFR during tolvaptan and placebo treatment was 9%, for RPF it was 17% during tolvaptan treatment and 16% during placebo treatment. The inter-assay variation coefficient for FF was 12% during tolvaptan treatment and 18% during placebo treatment. The intra-assay variation coefficient was 7.2% for GFR, 7.7% for RPF and 8.9% for FF.Clearance (C) of substance X was calculated as CX = UX/(PX × UO), where UX
denotes concentration of x in urine, PX denotes concentration of x in plasma and
UO is urine excretion rate.
FENa was determined according to the following formula: FENa = 100 × ((uNa
× pCr))/((pNa × uCr)).
Kidney volume was estimated by presuming that the kidneys had an ellipsoid volume using the formula: 4/3πabc, where “a” denotes the kidney length, “b” denotes the kidney’s width and “c” denotes the kidney’s depth. The length and width were estimated by one of the two nuclear medicine physicians, using the posterior renography projection images from both placebo and tolvaptan treat-ment day. It was assumed that the kidney depth was equal to their width. In or-der to compare TKV impact on tolvaptan’s effect on GFR and RPF, we divided the ADPKD patients into two equally sized groups, the 9 with the largest and the 9 whit the smallest TKV.
Urinary excretion of AQP2
Urine samples were kept frozen at −20˚C until assayed. U-AQP2 were meas-ured by RIA as previously described [16] [17]. The AQP2 antibody was a gift from Professor Soren Nielsen and Professor Robert Fenton, The Water and Salt Centre, Aarhus University, Denmark. Minimal detection level was 32 pg/tube. The coefficients of variation were 11.7% (inter-assay) and 5.9% (intra-assay).
Vasoactive hormones in plasma
(in-DOI: 10.4236/ojneph.2019.94011 103 Open Journal of Nephrology tra-assay). P-AngII and p-AVP were extracted from plasma with C18 Sep-Pak
(Water associates, Milford; MA, USA) and subsequently determined by ra-dioimmunoassay [18] [19]. The antibody against AngII was obtained from the Department of Clinical Physiology (Glostrup Hospital, Denmark). The minimal detection level was 2 pmol/L. The coefficients of variation were 12% for the in-ter-assay and 8% for the intra-assay. The antibody against AVP was a gift from Jacques Dürr, Miami, Fl, USA. The minimal detection level was 0.5 pmol/L. The coefficients of variation were 13% for the inter-assay and 9% for the intra-assay.
Other biochemical measurements
U-Osm was measured using A2O Advanced Automated Osmometer
(Ad-vanced Instruments, MA, USA). Plasma concentration of sodium, potassium, albumin, hemoglobin, leukocytes, platelets, creatinine, bilirubin, ALAT, alkaline phosphatase, cholesterol, calcium, phosphate, parathyroid hormone (PTH), thyroid-stimulating hormone (TSH) and glycosylated hemoglobin A1c (HbA1c) were measured using routine methods at the Department of Clinical Biochemi-stry, Regional Hospital Jutland West, Denmark.
Brachial and central blood pressure
BP was measured every fifteen minutes throughout the day. bBP and cBP was measured using an oscillometric device on the participants upper arm (Mo-bil-O-Graph PWA).
Renal vascular resistance
Renal vascular resistance (RVR) was estimated by the equation mean arterial pressure (MAP)/RPF. MAP was estimated by the Mobil-O-Graph PWA during renography.
2.13. Statistics
Statistical analyses were performed using IBM SPSS statistics version 20 (SPSS Inc., Chicago, IL, USA). Data were tested for normal distribution. A paired t-test was used for paired comparison between two groups, if data showed normal dis-tribution, otherwise Wilcoxon’s signed rank test was used. Correlation was ana-lysed by Spearman’s test. Data are given as means ± SD and or as medians with 25% and 75% percentiles in brackets.
3. Results
3.1. Demographics
Twenty ADPKD patients with CKD stage I-III were included in the study. Two of the patients were excluded due to withdrawal of consent. Eighteen patients (11 females and 7 males) with a median age of 51 (range 19 - 67 years), body mass index of 29 ± 7 kg/m2, eGFR of 82 ± 26 ml/min/1.73 m2, office systolic bBP
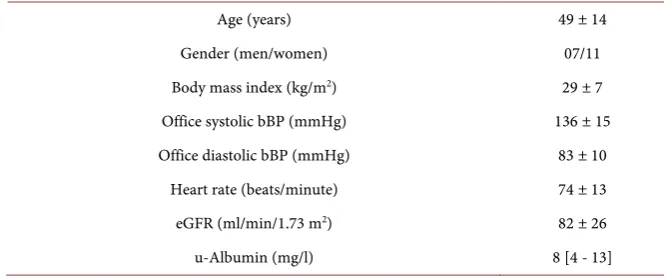
DOI: 10.4236/ojneph.2019.94011 104 Open Journal of Nephrology Table 1. Baseline demographics and clinical characteristics of the eighteen ADPKD pa-tients who completed the study.
Age (years) 49 ± 14
Gender (men/women) 07/11
Body mass index (kg/m2) 29 ± 7
Office systolic bBP (mmHg) 136 ± 15
Office diastolic bBP (mmHg) 83 ± 10
Heart rate (beats/minute) 74 ± 13
eGFR (ml/min/1.73 m2) 82 ± 26
u-Albumin (mg/l) 8 [4 - 13]
Values represent n in either group or mean ± SD or median with 25% and 75% percentiles in brackets. eGFR = estimated glomerular filtration rate. bBP = brachial blood pressure.
pmol/l] and b-hemoglobin 8.72 [8.25; 9.18 mmol/l]. There was no anamnestic or clinical signs of heart or lung disease.
3.2. Renal Hemodynamics
99-mTc-DTPA renography showed a similar total RPF after tolvaptan and pla-cebo treatment (673 ± 262 ml/min vs. 650 ± 209 ml/min p = 0.571, which is a difference of 3.5% NS) Figure 1(a) shows single kidney RPF, with no difference between the two kidneys comparing tolvaptan and placebo treatment. GFR es-timated by 99-mTc-DTPA renography was also unchanged after tolvaptan (78 ± 26 ml/min after tolvaptan vs. 79 ± 21 ml/min after placebo, p = 0.774, which is a difference of 1.3% NS, Figure 1(b)). FF did not change after tolvaptan treatment (13% ± 4% vs. 13% ± 4% p = 0.861, which is a difference of 0% NS, Figure 1(c)).
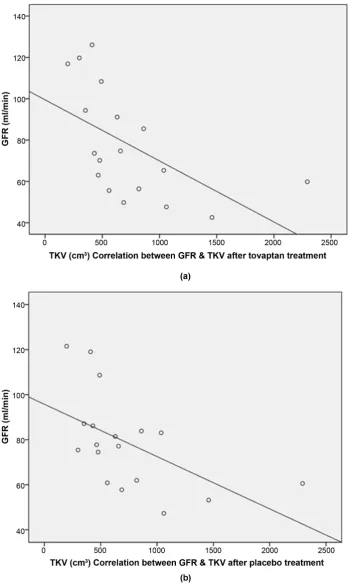
Two groups were created according to kidney size (large TKV 1056 ± 531 cm3
(n = 9) vs. small TKV 409 ± 110 cm3 (n = 9), p-value 0.006). A negative
correla-tion between TKV and GFR was detected, i.e. ADPKD patients with large kid-neys tended to have a lower GFR than ADPKD patients with small kidkid-neys (Figure 2(a) and Figure 2(b)). No correlation between TKV and RPF was noted (Rs = −0.317, p = 0.200 after tolvaptan treatment and Rs = −0.346, p = 0.160 after
placebo treatment). The results are shown in Table 2 and correspond with the correlation analyses. There were no significant differences in GFR or RPF be-tween treatments.
Blood pressure
DOI: 10.4236/ojneph.2019.94011 105 Open Journal of Nephrology (a)
(b)
[image:9.595.223.526.65.671.2](c)
Figure 1. (a)-(c) Renal plasma flow (RPF) and glomerular filtration rate (GFR) estimated by renography in right and left kidney after tolvaptan and placebo treatment in eighteen ADPKD patients. Filtration fraction (FF) from both kidneys estimated by renography af-ter tolvaptan and placebo treatment. Values represent mean ± SD.
0 50 100 150 200 250 300 350 400 450 500
Right kidney Left kidney
m
l/m
in
a
tolvaptan placebo
RPF
0 10 20 30 40 50 60
Right kidney Left kidney
m
l/m
in
b
tolvaptan placebo
GFR
0 2 4 6 8 10 12 14 16 18
Both kidneys
%
c
tolvaptan placebo
DOI: 10.4236/ojneph.2019.94011 106 Open Journal of Nephrology Figure 2. (a) & (b) Correlation between TKV and GFR after tolvaptan (RS = −0.728, p < 0.05)
and placebo treatment (RS = −0.657, p < 0.05). GFR = glomerular filtration rate. TKV = total
DOI: 10.4236/ojneph.2019.94011 107 Open Journal of Nephrology Table 2. Tolvaptan’s effect on RPF, GFR and FF in large vs. small TKV.
large TKV
(n = 9) small TKV (n = 9)
RPF (ml/min) - tolvaptan 594 ± 268 713 ± 204
- placebo 572 ± 217 729 ± 177
GFR (ml/min) - tolvaptan 64 ± 17 92 ± 27
#
- placebo 67 ± 14 90 ± 21
FF (%) - tolvaptan 13 ± 5 13 ± 3
- placebo 13 ± 4 13 ± 4
Values represent mean ± SD. # = p < 0.05 between GFR in large vs. small TKV after tolvaptan treatment. RPF = renal plasma flow. GFR = glomerular filtration rate. FF = filtration fraction. TKV = total kidney vo-lume.
Table 3. Tolvaptan’s effect on blood pressure throughout the examination day.
Trial medicine intake
Timeline 0 h 1 h 3 h 3.5 h 4 h
Baseline Trial medicine treatment Supine BP during renography
After renography
Changes between baseline and
supine BP
Systolic (mmHg)
bBP - tolvaptan 137 ± 12 138 ± 12 135 ± 13* 140 ± 16 2 ± 10 - placebo 138 ± 18 141 ± 16 141 ± 18 144 ± 21 −3 ± 15
cBP - tolvaptan 126 ± 11 127 ± 9 125 ± 13 131 ± 14 2 ± 11 - placebo 128 ± 16 130 ± 15 131 ± 19 134 ± 21 −3 ± 15
Diastolic (mmHg)
bBP - tolvaptan 92 ± 9 94 ± 9 87 ± 10 96 ± 11 5 ± 6 - placebo 92 ± 10 95 ± 12 89 ± 14 96 ± 16 4 ± 8
cBP - tolvaptan 93 ± 9 95 ± 9 88 ± 10 98 ± 11 5 ± 7 - placebo 93 ± 10 97 ± 12 90 ± 13 98 ± 15 5 ± 8
Values represent mean ± SD. * = p <0.05 between tolvaptan and placebo treatment. bBP = brachial blood pressure, cBP = central blood pressure.
tolvaptan and placebo. Thus, the fall in systolic BP during renography seems to be marginal or by chance.
Renal vascular resistance
Estimated RVR during renography was unchanged after tolvaptan (0.40 ± 0.23 mmHg∙ml−1 min) vs. placebo (0.38 ± 0.17 mmHg ml−1 min after placebo
treat-ment, p = 0.743).
3.3. Sodium, Water and Albumin Excretion
UO, u-Osm, FENa and u-Alb are presented in Table 4.FENa remained unchanged during the examination day during both treatments
[image:11.595.210.540.278.510.2]DOI: 10.4236/ojneph.2019.94011 108 Open Journal of Nephrology Table 4. Tolvaptan’s effect on UO, U-Osm, FENa, U-Alb, U-AQP2.
Baseline (24 h urine sample)
After treatment (urine sample collected during a 3-hour period after trial medicine intake)
Changes between Baseline and after
Treatment
U-Osm (mosmol/kg) - tolvaptan 433 ± 166 127 ± 36* 295 ± 146
#
- placebo 424 ± 174 376 ± 139 27 ± 97
U-AQP2 (ng/ml) - tolvaptan 0.6 ± 0.3 0.2 ± 0.1* 0.5 ± 0.3
#
- placebo 0.7 ± 0.3 0.5 ± 0.3 0.0 ± 0.3
U-AQP2 (ng/mmolCr)
- tolvaptan 107.5 ± 28.7 92.3 ± 21.6* 14.6 ± 20.9#
- placebo 108.0 ± 34.4 97.7 ± 25.9 9.1 ± 16.1#
U-AQP2 (ng/min) - tolvaptan 0.5 ± 0.3 0.0 ± 0.0* 0.4 ± 0.3
#
- placebo 0.5 ± 0.3 0.4 ± 0.3 0.1 ± 0.3
FENa (%)
- tolvaptan 0.9 ± 0.3 0.8 ± 0.4 0.1 ± 0.2 - placebo 0.8 ± 0.2 0.8 ± 0.3 0.0 ± 0.3
UO (ml/min) - tolvaptan 1.6 ± 0.5 5.5 ± 0.4* −3.8 ± 1.5
#
- placebo 1.5 ± 0.4 1.8 ± 0.7 −0.2 ± 0.2
Albuminexcretion rate (mg/min)
- tolvaptan 0.01 [0.00; 0.03] 0.02 [0.01; 0.04]* −0.01 [−0.01; −0.00]#
- placebo 0.01 [0.00; 0.02] 0.01 [0.00; 0.02] −0.00 [−0.00; 0.01]
U-albumin (mg/mmolCr)
- tolvaptan 1.4 [0.5; 3.8] 2.5 [1.4; 4.8]* −0.9 [−1.7; −0.1]#
- placebo 1.3 [0.3; 2.7] 1.2 [0.4; 2.9] −0.1 [−0.4; 0.9]
Values represent mean ± SD or median with 25% and 75% percentiles in brackets * = <0.05 between tol-vaptan and placebo treatment. # = p < 0.05 between baseline and after treatment. U-Osm = urine osmolali-ty. U-AQP2 = aquaporin-2. FENa = fractional excretion of sodium. UO = urine flow.
After tolvaptan treatment, UO increased, but was unchanged during placebo treatment (5.5 ml/min after tolvaptan treatment vs. 1.8 ml/min after placebo treatment, p < 0.001). After tolvaptan treatment, u-Osm decreased, but did not change after placebo treatment (127 mosmol/kg vs. 376 mosmol/kg, p < 0.001).
Albumin excretion increased during tolvaptan treatment but stayed un-changed during placebo treatment and was significant higher during tolvaptan treatment in compare to placebo (0.02 mg/min vs. 0.01 mg/min, p = 0.001). Sim-ilar results were found after adjusting to creatinine excretion (2.5 mg/mmol Cr during tolvaptan treatment vs. 1.2 mg/mmol Cr after placebo treatment, p = 0.001).
3.4. U-AQP2
DOI: 10.4236/ojneph.2019.94011 109 Open Journal of Nephrology and u-AQP2 excretion rate. However, no significant difference was measured for u-AQP2 adjusted to creatinine excretion, which most likely is by change.
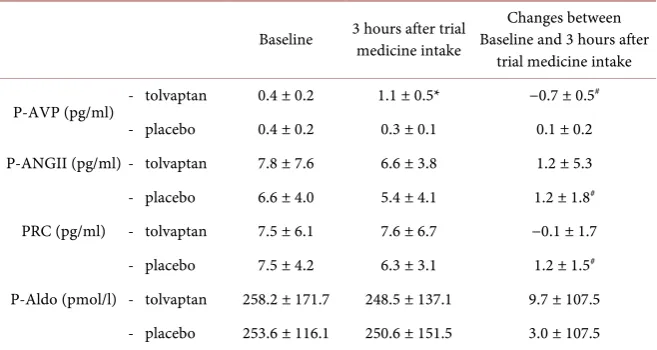
3.5. Vasoactive Hormones
Table 5 shows that there were no differences in baseline p-AVP, p-Aldo, PRC or p-AngII. After tolvaptan treatment, there were no changes in p-Aldo, PRC or p-AngII. However, p-AVP increased after tolvaptan treatment, while stayed un-changed during placebo treatment (1.1 pg/ml vs. 0.3 pg/ml, p < 0.001). When changes from baseline to after treatment were compared, the change in p-AVP was maintained. Although significant differences were seen between changes in PRC and p-AngII, these changes were extremely small and most likely by chance.
4. Discussion
The present paper reports acute effects of tolvaptan on renal hemodynamics and vasoactive hormones in ADPKD patients. Using 99-mTc-DTPA renography, one dose of tolvaptan did not increase RPF or GFR compared to placebo as hy-pothesized. However, UO, AVP increased and u-Osm decreased after one dose of tolvaptan treatment as expected.
4.1. Renal Hemodynamics and Glomerular Filtration Rate
[image:13.595.210.539.516.691.2]We found no change in RPF after acute tolvaptan treatment, which is in agree-ment with results reported by Irazabal et al. and Boertien et al. using MRI and PAH clearance to determine RPF [12] [13]. In previous short-term studies, tol-vaptan decreased GFR [12] [13], but in contrast to these studies, our results in-dicate that acute tolvaptan treatment has no immediate effect on GFR. These discrepancies in results could be due to several factors. Firstly, it may be attri-buted to renal autoregulation, which may obscure a possible effect of tolvaptan
Table 5. Tolvaptan’s effect on vasoactive hormones.
Baseline 3 hours after trial medicine intake Baseline and 3 hours after Changes between trial medicine intake
P-AVP (pg/ml) - tolvaptan 0.4 ± 0.2 1.1 ± 0.5* −0.7 ± 0.5
#
- placebo 0.4 ± 0.2 0.3 ± 0.1 0.1 ± 0.2 P-ANGII (pg/ml) - tolvaptan 7.8 ± 7.6 6.6 ± 3.8 1.2 ± 5.3 - placebo 6.6 ± 4.0 5.4 ± 4.1 1.2 ± 1.8#
PRC (pg/ml) - tolvaptan 7.5 ± 6.1 7.6 ± 6.7 −0.1 ± 1.7 - placebo 7.5 ± 4.2 6.3 ± 3.1 1.2 ± 1.5#
P-Aldo (pmol/l) - tolvaptan 258.2 ± 171.7 248.5 ± 137.1 9.7 ± 107.5 - placebo 253.6 ± 116.1 250.6 ± 151.5 3.0 ± 107.5
DOI: 10.4236/ojneph.2019.94011 110 Open Journal of Nephrology on renal hemodynamics. Thus, in our study, an acute, small decline in brachial systolic blood pressure after tolvaptan treatment did not alter either GFR or RPF. The effect of renal autoregulation on change in GFR and RPF is well known from previous studies during alteration in blood pressure [20]. Secondly, the discrepancies could be due to difference in tolvaptan doses used in different studies, since tolvaptan’s effect on GFR may be dose dependent. In the study of Boertien et al., the patients received 90 - 120 mg tolvaptan daily in a period of 3 weeks, while Irazabal et al. used 20 mg tolvaptan daily for 7 days [12] [13]. In our study, the patients received one dose of 60 mg tolvaptan, which also was the dose used by Therwani et al. [12] [13] [21]. Thirdly, we cannot rule out a type II error in our study, since we used a smaller SD in our power calculation than we observed in the study. However, previous studies had a similar sample sizes (Boertien et al. studied 27 ADPKD patients, Irazabal et al. studied 20 patients, and Therwani et al. studied 18 patients) [12] [13] [21]. Fourthly, it is possible that the disagreements between the studies could be due to difference in the method of estimating GFR. In our study, we used Posterior 99-mTc-DTPA re-nography, while Therwani et al. used 51Cr-EDTA, Boertien et al. and Irazabal et
al. used 125I-iothalamate. Overall, we were unable to falsify the 0-hypothesis of no
change in RPF after tolvaptan treatment in ADPKD patients. Our conclusion is that tolvaptan does not change renal hemodynamics when administrated acute-ly.
4.2. Kidney Size
A previous study suggests that ADPKD patients with large TKV have an added benefit of tolvaptan treatment [6]. The ERA-EDTA Working Groups on Inhe-rited Kidney Disorders and European Renal Best Practice has defined rapid pro-gressive ADPKD as patients with large TKV, or rapid increase in TKV, or de-crease in GFR at a young age and recommends tolvaptan treatment to these pa-tients [22]. Therefore, we divided our papa-tients into two subgroups, i.e. large TKV versus small. Our results showed no difference in effect of tolvaptan on GFR or RPF between the two groups. However, we measured only the immediate and acute effect of tolvaptan, while the previous study investigated the long-term ef-fect of tolvaptan treatment [6].
4.3. Sodium and Water Excretion, u-AQP2 and Vasoactive
Hormones
DOI: 10.4236/ojneph.2019.94011 111 Open Journal of Nephrology which is in good agreement with a previous study [21]. Thus, it seems unlikely that changes in the RAAS have influenced our results. We found no change in fractional excretion of sodium (FENa) after tolvaptan treatment, which is
consis-tent with an earlier long-term study [26]. The unchanged FENa is probably due to
the fact that tolvaptan’s effects are mainly in the distal part of the nephron, and the effect is primarily on renal water handling and very modest on renal sodium excretion.
4.4. Albumin Excretion Rate
Our results show an increase in albumin excretion rate after acute tolvaptan treatment. In the post hoc analysis of the TEMPO 3:4 trial there was a tendency to increase in albuminuria in the initiation of the treatment [27]. However, after continuation of tolvaptan treatment, albuminuria decreased. The increase in al-bumin excretion rate may be due to an increase in urine flow per se or a tempo-rary leak in the glomeruli.
4.5. Strengths and Limitations
The study design as a randomized, placebo-controlled, double-blinded, crossov-er is one of the major strengths of the present study. A proportion of the patients were treated with antihypertensives during the examination period, since com-plete withdrawal of antihypertensive treatment was not ethically justified. Since the medical treatment was identical during placebo and tolvaptan treatment, a possible difference due to use of antihypertensive therapy is expected to be mi-nimal. We found satisfying inter- and intra-assay variation coefficient using 99-mTc-DTPA renography for estimating RPF and GFR.
5. Conclusion
Our results do not support the hypothesis that the effect of tolvaptan on ADPKD progression is mediated by changes in renal perfusion. Our findings express short-term effects of tolvaptan treatment. A long-term tolvaptan study is needed to clarify whether a long-term effect exists of tolvaptan on renal hemodynamics.
Acknowledgements
The authors thank Otsuka for financial support to the study via an Investigator Sponsored Study Agreement. We thank our laboratory technicians, including Anne Mette Ravn, Henriette Vorup Simonsen and Kirsten Nyggard for their skillful assistance.
Conflicts of Interest
The authors declare no conflicts of interest regarding the publication of this paper.
References
DOI: 10.4236/ojneph.2019.94011 112 Open Journal of Nephrology 284 Patients and Their Families. Danish Medical Journal, 4, 128-133.
[2] Gabow, P.A. (1993) Autosomal Dominant Polycystic Kidney Disease. The New England Journal of Medicine, 329, 332-342.
https://doi.org/10.1056/NEJM199307293290508
[3] Schrier, R.W., Brosnahan, G., Cadnapaphornchai, M.A., Chonchol, M., Friend, K., Gitomer, B. and Rossetti, S. (2014) Predictors of Autosomal Dominant Polycystic Kidney Disease Progression. Journal of the American Society of Nephrology, 25, 2399-2418. https://doi.org/10.1681/ASN.2013111184
[4] King, B.F., Torres, V.E., Brummer, M.E., Chapman, A.B., Bae, K.T., Glockner, J.F., Arya, K., Felmlee, J.P., Grantham, J.J., Guay-Woodford, L.M., Bennett, W.M., Klahr, S., Hirschman, G.H., Kimmel, P.L., Thompson, P.A. and Miller, J.P. (2003) Consortium for Radiologic Imaging Studies of Polycystic Kidney Disease (CRISP): Magnetic Resonance Measurements of Renal Blood Flow as a Marker of Disease Severity in Autosomal-Dominant Polycystic Kidney Disease. Kidney International, 64, 2214-2221. https://doi.org/10.1046/j.1523-1755.2003.00326.x
[5] Meijer, E., Rook, M., Tent, H., Navis, G., van der Jagt, E.J., de Jong, P.E. and Gan-sevoort, R.T. (2010) Early Renal Abnormalities in Autosomal Dominant Polycystic Kidney Disease. The Clinical Journal of the American Society of Nephrology, 5, 1091-1098. https://doi.org/10.2215/CJN.00360110
[6] Torres, V.E., Chapman, A.B., Devuyst, O., Gansevoort, R.T., Grantham, J.J., Higa-shihara, E., Perrone, R.D., Krasa, H.B., Ouyang, J. and Czerwiec, F.S. (2012) TEMPO 3:4 Trial Investigators: Tolvaptan in Patients with Autosomal Dominant Polycystic Kidney Disease. The New England Journal of Medicine, 367, 2407-2418. https://doi.org/10.1056/NEJMoa1205511
[7] Torres, V.E., Higashihara, E., Devuyst, O., Chapman, A.B., Gansevoort, R.T., Gran-tham, J.J., Perrone, R.D., Ouyang, J., Blais, J.D. and Czerwiec, F.S. (2016) TEMPO 3:4 Trial Investigators: Effect of Tolvaptan in Autosomal Dominant Polycystic Kid-ney Disease by CKD Stage: Results from the TEMPO 3:4 Trial. The Clinical Journal of the American Society of Nephrology, 11, 803-811.
https://doi.org/10.2215/CJN.06300615
[8] Knepper, M.A. (1997) Molecular Physiology of Urinary Concentrating Mechanism: Regulation of Aquaporin Water Channels by Vasopressin. American Journal of Physiology, 272, F3-F12. https://doi.org/10.1152/ajprenal.1997.272.1.F3
[9] Marples, D., Knepper, M.A., Christensen, E.I. and Nielsen, S. (1995) Redistribution of Aquaporin-2 Water Channels Induced by Vasopressin in Rat Kidney Inner Me-dullary Collecting Duct. American Journal of Physiology, 269, C655-C664. https://doi.org/10.1152/ajpcell.1995.269.3.C655
[10] Stefan, E., Wiesner, B., Baillie, G.S., Mollajew, R., Henn, V., Lorenz, D., Furkert, J., Santamaria, K., Nedvetsky, P., Hundsrucker, C., Beyermann, M., Krause, E., Pohl, P., Gall, I., MacIntyre, A.N., Bachmann, S., Houslay, M.D., Rosenthal, W. and Klussmann, E. (2007) Compartmentalization of cAMP-Dependent Signaling by Phosphodiesterase-4D Is Involved in the Regulation of Vasopressin-Mediated Wa-ter Reabsorption in Renal Principal Cells. Journal of the American Society of Nephrology, 18, 199-212. https://doi.org/10.1681/ASN.2006020132
DOI: 10.4236/ojneph.2019.94011 113 Open Journal of Nephrology [12] Irazabal, M.V., Torres, V.E., Hogan, M.C., Glockner, J., King, B.F., Ofstie, T.G., Krasa, H.B., Ouyang, J. and Czerwiec, F.S. (2011) Short-Term Effects of Tolvaptan on Renal Function and Volume in Patients with Autosomal Dominant Polycystic Kidney Disease. KidneyInternational, 80, 295-301.
https://doi.org/10.1038/ki.2011.119
[13] Boertien, W.E., Meijer, E., de Jong, P.E., Bakker, S.J., Czerwiec, F.S., Struck, J., Ob-erdhan, D., Shoaf, S.E., Krasa, H.B. and Gansevoort, R.T. (2013) Short-Term Renal Hemodynamic Effects of Tolvaptan in Subjects with Autosomal Dominant Polycys-tic Kidney Disease at Various Stages of Chronic Kidney Disease. Kidney Interna-tional, 84, 1278-1286. https://doi.org/10.1038/ki.2013.285
[14] Ravine, D., Gibson, R.N., Walker, R.G., Sheffield, L.J., Kincaid-Smith, P. and Danks, D.M. (1994) Evaluation of Ultrasonographic Diagnostic Criteria for Autosomal Dominant Polycystic Kidney Disease. TheLancet, 343, 824-827.
https://doi.org/10.1016/S0140-6736(94)92026-5
[15] Petersen, L.J., Petersen, J.R., Talleruphuus, U., Moller, M.L., Ladefoged, S.D., Mehl-sen, J. and JenMehl-sen, H.A. (1999) Glomerular Filtration Rate Estimated from the Up-take Phase of 99mTc-DTPA Renography in Chronic Renal Failure. Nephrology Di-alysis Transplantation, 14, 1673-1678. https://doi.org/10.1093/ndt/14.7.1673 [16] Pedersen, R.S., Bentzen, H., Bech, J.N. and Pedersen, E.B. (2001) Effect of Water
Deprivation and Hypertonic Saline Infusion on Urinary AQP2 Excretion in Healthy Humans. American Journal of Physiology-Renal Physiology, 280, F860-F867. https://doi.org/10.1152/ajprenal.2001.280.5.F860
[17] Pedersen, E.B., Thomsen, I.M. and Lauridsen, T.G. (2010) Abnormal Function of the Vasopressin-Cyclic-AMP-Aquaporin2 Axis during Urine Concentrating and Diluting in Patients with Reduced Renal Function. A Case Control Study. BMC Nephrology, 11, 26. https://doi.org/10.1186/1471-2369-11-26
[18] Pedersen, E.B., Danielsen, H. and Spencer, E.S. (1984) Effect of Indapamide on Renal Plasma Flow, Glomerular Filtration Rate and Arginine Vasopressin in Plasma in Essential Hypertension. European Journal of Clinical Pharmacology, 26, 543-547. https://doi.org/10.1007/BF00543482
[19] Pedersen, E.B. (1993) Effect of Captopril on Renal Extraction of Renin, Angiotensin II, Atrial Natriuretic Peptide and Vasopressin, and Renal Vein Renin Ratio in Pa-tients with Arterial Hypertension and Unilateral Renal Artery Disease. Nephrology, Dialysis, Transplantation, 8, 1064-1070.
[20] Carlstrom, M., Wilcox, C.S. and Arendshorst, W.J. (2015) Renal Autoregulation in Health and Disease. Physiological Reviews, 95, 405-511.
https://doi.org/10.1152/physrev.00042.2012
[21] Al Therwani, S., Malmberg, M.E.S., Rosenbaek, J.B., Bech, J.N. and Pedersen, E.B. (2017) Effect of Tolvaptan on Renal Handling of Water and Sodium, GFR and Cen-tral Hemodynamics in Autosomal Dominant Polycystic Kidney Disease during In-hibition of the Nitric Oxide System: A Randomized, Placebo-Controlled, Double Blind, Crossover Study. BMC Nephrology, 18, 268.
https://doi.org/10.1186/s12882-017-0686-3
[22] Gansevoort, R.T. (2016) Recommendations for the Use of Tolvaptan in Autosomal Dominant Polycystic Kidney Disease: A Position Statement on Behalf of the ERA-EDTA Working Groups on Inherited Kidney Disorders and European Renal Best Practice. Nephrology, Dialysis, Transplantation, 31, 337-348.
https://doi.org/10.22141/2307-1257.3.17.2016.76538
DOI: 10.4236/ojneph.2019.94011 114 Open Journal of Nephrology G. (2017) The V2 Receptor Antagonist Tolvaptan Raises Cytosolic Calcium and Prevents AQP2 Trafficking and Function: An in Vitro and in Vivo Assessment. Journal of Cellular and Molecular Medicine, 21, 1767-1780.
https://doi.org/10.1111/jcmm.13098
[24] Chapman, A.B., Johnson, A., Gabow, P.A. and Schrier, R.W. (1990) The Re-nin-Angiotensin-Aldosterone System and Autosomal Dominant Polycystic Kidney Disease. The New England Journal of Medicine, 323, 1091-1096.
https://doi.org/10.1056/NEJM199010183231602
[25] Chapman, A.B., Stepniakowski, K. and Rahbari-Oskoui, F. (2010) Hypertension in Autosomal Dominant Polycystic Kidney Disease. Advances in Chronic Kidney Dis-ease, 17, 153-163. https://doi.org/10.1053/j.ackd.2010.01.001
[26] Muto, S. (2017) Long-Term Safety Profile of Tolvaptan in Autosomal Dominant Polycystic Kidney Disease Patients: TEMPO Extension Japan Trial. Drug, Health-care and Patient Safety, 9, 93-104. https://doi.org/10.2147/DHPS.S142825
[27] Gansevoort, R.T., Meijer, E., Chapman, A.B., Czerwiec, F.S., Devuyst, O., Gran-tham, J.J., Higashihara, E., Krasa, H.B., Ouyang, J., Perrone, R.D. and Torres, V.E. (2016) TEMPO 3:4 Investigators: Albuminuria and Tolvaptan in Autosom-al-Dominant Polycystic Kidney Disease: Results of the TEMPO 3:4 Trial. Nephrol-ogy Dialysis Transplantation, 31, 1887-1894.https://doi.org/10.1093/ndt/gfv422
List of Abbreviations
ADPKD: Autosomal dominant polycystic kidney disease. AQP2: aquaporin-2.
bBP: brachial blood pressure. cBP: central blood pressure.
cAMP: adenosine 3’,5’-cyclic monophosphate.
CKD: chronic kidney disease. eGFR: estimated glomerular filtration rate. FENa: fractional excretion of sodium.
FF: filtration fraction. P: p-value.
p-Aldo: plasma aldosterone. p-AngII: plasma angiotensin. p-AVP: plasma vasopressin. PKD1: polycystin 1 gene. RC: plasma renin. RPF: renal plasma flow. RVR: renal vascular resistance. SD: standard deviation. TKV: total kidney volume. UO: urine output.
u-Osm: u-osmolality.
6 MBq/kg: 6 megabecquerel per kg body weight.