Models of diffuse H
α
in the interstellar medium: the relative
contributions from
in situ
ionization and dust scattering
Joanna E. Barnes,
1‹Kenneth Wood,
1Alex S. Hill
2†
and L. Matthew Haffner
3,4 1School of Physics & Astronomy, University of St Andrews, North Haugh, St Andrews, Fife, KY16 9SS, UK2CSIRO Astronomy & Space Science, Marsfield, NSW 2122, Australia
3Department of Astronomy, University of Wisconsin Madison, 475 North Charter Street, Madison, WI 53706, USA 4Space Science Institute, 4750 Walnut Street, Suite 205, Boulder, CO 80301, USA
Accepted 2014 November 17. Received 2014 October 21; in original form 2014 June 30
A B S T R A C T
Using three-dimensional Monte Carlo radiation transfer models of photoionization and dust scattering, we explore different components of the widespread diffuse Hαemission observed in the interstellar medium of the Milky Way and other galaxies. We investigate the relative contributions of Hαfrom recombination emission in ionized gas and Hα that originates in HIIregions near the Galactic mid-plane and scatters off high-altitude dust in the diffuse
in-terstellar medium. For the radiation transfer simulations, we consider two geometries for the interstellar medium: a three-dimensional fractal geometry that reproduces the average density structure inferred for hydrogen in the Milky Way, and a density structure from a magnetohy-drodynamic simulation of a supernova-driven turbulent interstellar medium. Although some sight lines that are close to HIIregions can be dominated by scattered light, overall we find
that less than∼20 per cent of the total Hαintensity in our simulations can be attributed to dust scattering. Our findings on the relative contribution of scattered Hαare consistent with previous observational and theoretical analyses. We also investigate the relative contributions of dust scattering andin situionization of high-density dust clouds in the diffuse gas. Dust scattering in these partially ionized clouds contribute∼40 per cent to the total intensity of Hα.
Key words: ISM: general – Galaxies: ISM.
1 I N T R O D U C T I O N
Widespread diffuse Hαemission is observed along all sight lines in the Milky Way and is ubiquitous in the interstellar medium (ISM) of other galaxies (see the extensive review by Haffner et al.2009). The Hαintensity is attributed to recombination emission from diffuse ionized gas (DIG, also known as the warm ionized medium) in the ISM (e.g. Miller & Cox 1993; Dove & Shull 1994) with a contribution from Hαphotons that originate in HIIregions close
to the Galactic mid-plane, and are scattered towards us by dust in the diffuse ISM (e.g. Jura1979; Wood & Reynolds1999). Power requirements for the DIG point to OB stars as the most likely source of its ionizing photons (e.g. Reynolds1990). Observational and theoretical studies suggest that dust scattering is a relatively small component of the diffuse Hαemission, typically less than 20 per cent of the total.
E-mail:[email protected]
†Current address: Departments of Physics and Astronomy, Haverford College, Haverford, PA, USA.
Reynolds (1988) studied the [SII]/Hαoptical line ratio and found
it to be larger in the Galactic DIG than in HIIregions. If scattered
light were the dominant source of Hαand [SII] in the DIG then
the line ratios would be similar to those observed in HIIregions.
In addition, observations of the DIG in the Milky Way and other galaxies show that line ratios of [SII]/Hαand [NII]/Hα increase with distance from the galactic mid-plane (e.g. Rand1998; Haffner, Reynolds & Tufte1999; Otte, Gallagher & Reynolds2002; Hill et al.2014). Observations of the Perseus Arm show that [SII]/Hα
increases with decreasing Hα intensity (Haffner et al.1999). In analysing recent observations of the Scutum–Centaurus Arm, Hill et al. (2014) found that the increase in the [SII]/Hαline ratios better
correlate with decreasing Hαintensity than with height above the plane, suggesting that the trend in line ratios and accompanying changes in physical conditions are primarily a function of density, not the ionizing radiation field. The observed line ratios can be attributed to an increase in the temperature of the gas and has led to the suggestion that heating beyond that provided by photoionization is acting in the DIG (e.g. Bland-Hawthorn, Freeman & Quinn1997; Reynolds, Haffner & Tufte1999; Haffner et al.2009).
Seon & Witt (2012) suggested that the elevated line ratios present in the ionized–neutral transition zone towards the edges of
HIIregions could be responsible for the observed line ratios in the
DIG, if dust scattering of light from HIIregions was a large
compo-nent of the DIG emission. However the transition zone comprises a very small component of the total emission from the HIIregion, so
if dust scattering were dominant in the DIG we would expect HII
region-like line ratios, as originally discussed by Reynolds (1988). It has also been suggested that stellar Hα absorption lines are able to impact on observed emission lines, substantially increasing [SII]/Hαand [NII]/Hαline ratios in the DIG (Seon & Witt2012).
Other stellar absorption lines not coincident with ISM emission
lines are also seen in WHAM (Wisconsin Hα Mapper)
observa-tions when the one-degree beam contains bright stars (V<7 mag). However, these lines are not detectable in the∼90 per cent of obser-vations that contain only fainter sources, especially at moderate to high latitudes where diffuse stellar light is negligible. Further, Otte et al. (2001) and Otte et al. (2002) considered the effects of stellar absorption lines in edge-on galaxies and found no need for correc-tion in DIG regions, only in those regions closer to the mid-plane. Finally, the scaleheight of stellar absorption and Hαemission are not comparable, and therefore, the effect of stellar absorption lines is unable to explain the observed increase with height in line ratios of [NII]/Hαand [SII]/Hα.
Using observations of the high-altitude cloud LDN 1780, Witt et al. (2010) derived a relation between the intensities of Hαand 100μm thermal dust emission to estimate the dust-scattered Hα contribution. They extrapolated their results for the LDN 1780 cloud to the high-latitude (|b|>10◦) sky to determine that the most prob-able scattered Hαintensity (0.1R1) is about 19 per cent of the most
probable total Hαintensity in this portion of the sky (0.52R). This estimate for the dust-scattered Hαintensity agrees with estimates from Wood & Reynolds (1999), Reynolds, Scherb & Roesler (1973) and Brandt & Draine (2012).
From a theoretical perspective, Monte Carlo scattering simula-tions by Wood & Reynolds (1999) using a smooth ISM density structure (and assumed Hαemissivity from the DIG) found that less than 20 per cent of the total Hαintensity from the DIG is a result of dust-scattered Hα from HII regions. Their simulations
showed spatial variations, with the scattered light component being smallest at high altitudes and with some sight lines towards the galactic mid-plane exhibiting a much larger scattered light compo-nent. The results from the smooth density ISM models of Wood & Reynolds (1999) are in broad agreement with other estimates of the dust-scattered contribution to the observed diffuse Hα(e.g. Reynolds1988). If scattered light were a significant contributor to the observed Hαintensity it would complicate the interpretation of the observed Hαintensity as a tracer of the electron density along the line of sight. This would have significant implications for the understanding of both the energy transport in the ISM and for the use of Hαas a template for the Galactic foreground free–free contribution to the cosmic microwave background.
In this paper, we extend the work of Wood & Reynolds (1999) to study Hα emission and scattering in three-dimensional (3D) ISM density structures. Our models employ 3D Monte Carlo radia-tion transfer codes to compute the photoionizaradia-tion and temperature structure of the DIG and thus the 3D Hαemissivity fromin situ
recombinations. We then use a separate scattering code to com-pute the total intensity of Hαfromin siturecombinations and Hα that originates in HIIregions and is scattered by dust in the
dif-fuse ISM. The setup of our simulations and methods are outlined in
11R=106/4πHαphotons cm−2s−1sr−1.
Section 2, our results are presented in Section 3, and our conclusions are presented in Section 4.
2 M O D E L S
2.1 Photoionization models
For our study of photoionization and scattering in the DIG, we adopt two density structures. First, we consider a subsection of a supernova-driven, magnetohydrodynamic (MHD) simulation of the ISM that extends to|z| = ±2 kpc with width 1 kpc (Hill et al.
2012). The density in these simulations is strongly peaked around the mid-plane and has a small scaleheight, such that the density above∼300 pc is smaller than inferred in the Galaxy. The MHD simulations include Type Ia and core-collapse supernovae set off at the average galactic supernova rate without knowledge of the gas distribution. They do not include photoionization; therefore, we post-process the density grids using our photoionization and scattered light codes.
Due to the small density scaleheight in the MHD simulations, we also consider a fractal density structure that has a vertical density distribution closer to that inferred for our Galaxy (Barnes et al.2014). To create this model ISM we convert a smooth four-component density distribution to a fractal structure (see below). The smooth density comprises a Dickey–Lockman distribution (Dickey & Lockman1990) plus an extended component:
n(z)=0.4e−(|z|/90)2/2+0.11e−(|z|/225)2/2
+0.06e−|z|/400+0.04e−|z|/1000, (1)
where the heightzis in pc and number densities are in cm−3.
When converted to a 3D fractal structure, this density is the input for our Monte Carlo photoionization and scattering simula-tions. The gas is initially assumed to be neutral and at the end of the photoionization simulations will comprise ionized and neu-tral components. The first three terms in equation (1) represent a Dickey–Lockman distribution for the average density of the neutral hydrogen. The fourth component is more vertically extended, and for fractal models is almost fully ionized at the end of our pho-toionization simulation, thus representing the density of the warm ionized medium with a 1 kpc scaleheight (Haffner et al.1999).
To allow ionizing photons to propagate and reach gas at high altitudes, we convert the smooth structure to a fractal one using the algorithm of Elmegreen (1997) as described in Wood et al. (2005) where this algorithm has been scaled to the box size used here (1 kpc×1 kpc×4 kpc). We adopt a five-level clumping algorithm and arrange the density structure such that one-third of the mass is distributed smoothly, with the remainder in fractal clumps. The fractal algorithm maintains the total mass and average density with height. In both the smooth and fractal photoionization simulations, we begin by assuming all of the hydrogen is neutral, and then allow the gas to be ionized.
The resolution in both the MHD and fractal ISM models is 15.6 pc per grid cell, and we therefore do not resolve traditional parsec-scale HIIregions around OB stars. We have investigated photoionization
simulations with higher resolution and find there is little differ-ence in the large-scale ionization and temperature structure between high- and low-resolution runs.
above, the sources of ionizing radiation in our simulations repre-sent photons escaping from HIIregions. We reproduce the Galactic
surface density of O stars in the solar neighbourhood (Garmany, Conti & Chiosi1982) by randomly placing 24 sources in thexy
plane with a scaleheight of 63 pc in|z| (Ma´ız-Apell´aniz 2001). Since our simulations do not resolve the HIIregions, we treat such
regions as ‘point sources’ located at the source positions. In what follows, these sources will be referred to as ‘HIIregions’.
The spectrum of the sources in our ionization simulations is as-sumed to be that of a typical O star withT=35 000 K. Although altering the type of O star will lead to small changes in the tempera-ture of the gas (and therefore the Hαemissivity) the most important variable is the ionizing luminosity (Wood et al.2010).
We find from our ionization simulations that the ionizing lumi-nosity that produces the extended DIG isQ=1×1049s−1 for
the MHD andQ= 1.6×1050s−1 for the fractal structure. Our
photoionization code computes the gas temperature and ionization state of H, He, C, S, N, O and Ne in each cell. For an input density structure, we calculate the ionization and temperature structures arising from photoionization only, without considering photoelec-tric or shock heating, the two major heating mechanisms in the MHD simulations. The 3D Hαemissivity of the DIG then follows from our photoionized density grid.
Observations of ionized gas in other galaxies indicate that the
Hα emission from the DIG is approximately equal to that from
traditional HIIregions (e.g. Ferguson et al.1996; Zurita, Rozas &
Beckman2000; Thilker et al.2002; Oey et al.2007). We therefore calculate the Hαluminosity of the DIG in the photoionization sim-ulations and set the Hαluminosity from the point sources equal to this. For the MHD simulations, the total Hαluminosity from HIIregions, isLHα=2.5×1048s−1and for the fractal simulations
it isLHα=6.5×1049s−1. We adopt this approach for assigning the Hαluminosity from HIIregions, but note that a fully self-consistent model would require subgrid resolution to compute the ionization structure and resulting Hαluminosity from the HIIregions as well
as the DIG.
The Hαemission in the DIG is a result of recombinations in the ionized gas. The number of Lyman continuum photons that can reach the DIG and ionize it depends on the number of photons that are able to escape HIIregions and how many of these photons then escape the galaxy.
It is thought that globally 5 per cent of the Lyman continuum photons from OB stars escape the Galaxy (e.g. Barger, Haffner & Bland-Hawthorn2013; Kim et al.2013), 15 per cent produce the DIG (Reynolds1990) and the remaining 80 per cent produce local HIIregions close to sources. However, there is certainly local
varia-tion in these fracvaria-tions, which we explore by varying the luminosity available to ionize the DIG versus HIIregions. Rogers & Pittard
(2013) used hydrodynamic models of massive star clusters to esti-mate that the percentage of ionizing photons that escape the cluster increases with age from 1 to 60 per cent over the first 4Myr of the cluster’s evolution. Therefore, in addition to a model where the Hα flux from the DIG and HIIregions are equal, we also investigate
simulations where 30 per cent of the Hαflux originates in HII
re-gions and 70 per cent in the DIG, and simulations where 70 per cent of the Hαflux originates in HIIregions and 30 per cent in the DIG.
2.2 Scattered light models
To simulate the scattering of Hαphotons we use the Monte Carlo scattering code described by Wood & Reynolds (1999). We as-sume that the dust and gas are well mixed and represented by
a Mathis, Rumpl & Nordsieck (1977) mixture with total opacity
κ=220 cm2g−1and scattering albedoa=0.5 appropriate for Hα
photons. To describe the angular shape of the dust scattering we use a forward throwing Henyey–Greenstein phase function HG(θ) with anisotropy parameterg=0.44,
HG(θ)= 1
4π
1−g2
(1+g2−2gcosθ)3/2. (2)
We use a ‘forced first scattering’ so every photon contributes to the scattered light intensity and a ‘peeling off’ algorithm forcing photons towards the observer with appropriate weights. We adopt the forced first scattering procedure to investigate scattered light in optically thin gas. Our scattered light models simulate the scattering of Hαphotons that originate in both HIIregions and the DIG.
3 R E S U LT S
The Monte Carlo scattering code computes the Hαintensity com-prising photons that reach the observer without scattering from the
DIG and point source HII regions. The code also computes the
contributions from Hαphotons that originate in the DIG and HII
regions and are scattered into our line of sight. Therefore, there are four types of Hαphotons present in our simulations as follows.
(i) Those that originate in HIIregions and reach the observer without scattering.
(ii) Those that originate in HIIregions and scatter off dust in the
DIG before reaching the observer.
(iii) Those that originate in the DIG from recombinations and reach the observer without scattering.
(iv) Those that originate in the DIG from recombinations and scatter off dust before reaching the observer.
Because we wish to determine the relative contribution to the Hαintensity from photons that originate in HIIregions and scatter
in the DIG, we hereafter refer to case (ii) photons as ‘scattered light’ and photons in cases (iii) and (iv) as‘diffuse’. We do not differentiate between Hα photons that originate in the DIG and reach the observer without scattering and those that originate in the DIG and are subsequently scattered.
3.1 Edge-on viewing
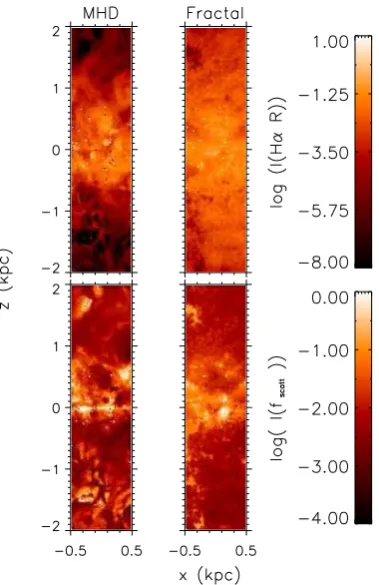
The upper panels of Fig.1show the total Hαintensity (photons that originate in the DIG plus those from HII regions including
scattered photons) and the lower panels show the ratio of scattered to total intensity (photons from case (ii)/total Hαintensity). The fraction of scattered light appears to decrease with distance from the mid-plane; however, there are regions where the contribution from scattered light is large, particularly noticeable in the MHD simulations.
The fractal density structure (right-hand panels of Fig.1) has a larger density scaleheight than that of the MHD simulations. This density structure is less centrally peaked than the MHD simulations and has higher density at large|z|(see fig. 1 in Barnes et al.2014). The right-hand panel of Fig.1shows maps of the total Hα inten-sity and the ratio of scattered to total inteninten-sity in a fractal deninten-sity structure. Comparing the fractal models to the MHD density grid, we see that the total Hαintensity is higher above the mid-plane in the fractal models and the overall fraction of intensity that is dust scattered from HIIregions is smaller.
Figure 1. Maps showing total Hαintensity (top row) and fraction of scat-tered light that originates in HIIregions (bottom row). Left: MHD simula-tions, right: fractal models using the HG scattering phase function.
scales asn2. At low densities, dust scattering may therefore
con-tribute a large fraction of the total Hαintensity. This results in the smaller fraction of scattered light in the fractal models.
Fig.2shows the fraction of scattered light intensity to total inten-sity for every 1-pixel-wide slice (grey lines) through the simulation box and the average fraction (black line). We find that on average the largest fraction (∼40 per cent) of scattered light is located close to the mid-plane of the simulation, where the density is highest. This is a result of the close proximity of the mid-plane dust to the HIIregions and the 1/r2dependence of scattered light. In the
MHD simulations, the fraction of scattered light then decreases as the density decreases to below∼10 per cent above|z| ∼300 pc and below∼5 per cent in the fractal models.
The large peaks in scattered light fraction above the mid-plane in the MHD simulations arise because of the very low density in individual cells resulting in low DIG emissivity. Since the DIG emissivity scales as∼n2and scattered light scales asn, scattered
light will dominate in these low-density cells. However in the MHD simulations, the total Hαintensity in the majority of the low-density regions is extremely faint and below the WHAM detection limit of 0.1R.
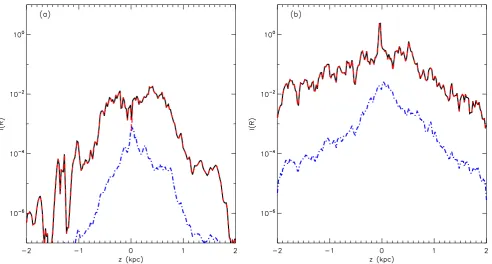
Fig.3shows the total Hαintensity (black), intensity of Hα orig-inating in the DIG (red) and intensity of dust-scattered Hαfrom HIIregions (blue) for a 1-pixel-wide slice through the MHD and
fractal simulations. The intensities of both the DIG and scattered light from HIIregions peak close to the mid-plane of the simulation,
where the density is highest and the dust is closest to the sources. We have investigated models where we distribute the Hα lumi-nosity such that 30 per cent of the total Hαflux originates in HII
regions. The peak fraction of scattered light in these simulations decreases by between∼10 and 20 per cent. If we distribute the Hα flux so 70 per cent originates in HIIregions, then the peak fraction
[image:4.595.71.261.55.348.2]of scattered light increases by 10 per cent. In both cases the fraction
[image:4.595.47.540.436.705.2]Figure 3. Intensity of total Hα(black), Hαin a 1-pixel-wide slice from photoionized DIG (red dashed), intensity of Hαfrom HIIregions scattered in to the DIG (blue dot–dashed) for (a) MHD simulations, (b) fractal simulations with the HG phase function.
of scattered light still decreases to below∼20 per cent in the MHD simulations. However, when the majority of the Hαflux originates in HIIregions, the fraction of scattered light above the mid-plane increases to∼10 per cent in the fractal models.
We have also investigated simulations using different albedo and scattering phase functions (a=0.67, 0.77 andg=0.5, 0.55 taken from Weingartner & Draine2001). We find that altering the albedo and scattering phase function has qualitatively little effect on our simulations, with the greatest difference occurring whena=0.77 and g = 0.5 where the fraction of scattered light is increased
to∼15 per cent above the mid-plane in MHD simulations.
How-ever, this does not significantly alter our results with the largest average fraction of scattered light increasing from 40 to 50 per cent.
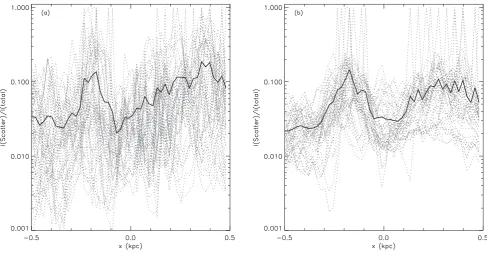
3.2 Face-on viewing
Figs4and5show a face-on view of the Hαintensity of scattered light and the ratio of scattered light to total intensity. Face-on and edge-on viewing gives ratios of scattered to total Hα. Fig.5shows that in the MHD simulations the fraction of scattered light is typ-ically below 20 per cent while it is below 10 per cent in the fractal models, consistent with our results from edge-on visualizations and with previous results (Reynolds1988; Ferrara et al.1996; Wood & Reynolds1999)
3.3 Galactic cirrus
High-density clouds hundreds of parsecs above the mid-plane could have an effect on the fraction of total Hαintensity due to scattered light. Observations of the cloud LDN1780 led Witt et al. (2010) to determine that dust-scattered Hαaccounts for∼19 per cent of the Hαemission at high altitudes in the Galaxy. LDN 1780 is lo-cated approximate 110 pc above the mid-plane of the galaxy (Franco
1989), is approximately 1.2 pc in diameter and has an average den-sity of∼103cm−3. To determine the contribution of dust-scattered
light from such clouds, we estimate the thickness and Hαintensity of the ionized shell that results from photoionization using the fol-lowing analysis. We assume a slab geometry for the cloud and plane parallel illumination.
The ionizing luminosity needed to ionize a volumeδVis deter-mined by
Q=n2α
BδV (3)
whereQis the number of ionizing photons per second incident on volumeδV,nis the density of the gas (cm−3),α
Bis the
recombina-tion coefficient assuming Case B recombinarecombina-tion. This can also be written in terms of the total ionizing flux available from O stars in the galaxyFLyC:
FLyCf δA=n2αBδAδl, (4)
whereδAis the area of the cloud exposed to the ionizing radiation,f
is the fraction of ionizing photons that escape HIIregions to produce
the DIG andδlis the depth of the ionized volume in the cloud. Given an ionizing flux, the depth to which a cloud can be ionized is
δl= FLyCf
n2α B
. (5)
The intensity of Hαemission in Rayleighs is related to the emission measure by
EM=
n2dl=2.75T0.9
4 IHα(R) cm−6pc (6) (Haffner et al.1999). The Hαintensity can therefore be found using
IHα(R)=
n2dl
2.75T0.9 4
Figure 4. Maps showing total Hαintensity (top row) and fraction of scattered light that originates in HIIregions (bottom row) for face-on views of our simulations. Left: MHD simulations and right: fractal simulations.
assuming the density is constant along the path dlthis can be sim-plified to
IHα(R)=
n2δl
2.75T0.9 4
, (8)
whereT4is the temperature of the gas in units ofT/104K andIHα is the intensity of Hαin Rayleighs (R).
Adopting f = 0.15, we would expect a cloud with density
n = 103cm−3 and T = 104K, ionized by the galactic ionizing
flux from O stars,FLyC=3×107cm−2s−1(Reynolds et al.1995),
would be ionized to a depth of 6 ×10⁻⁶pc and produce an Hα
intensity of 2.2Rfromin siturecombinations.
Since we are unable to resolve an ionized skin of this thickness in the large-scale simulation presented in Section 2, we explore scattering on smaller scales with a model of a single cloud. The total Lyman continuum flux in the Galaxy is 3.74×107cm−2s−1
(Vacca, Garmany & Shull1996). We assume that half of this flux travels upwards from the mid-plane of the Galaxy, towards the cir-rus cloud, while the other half travels downwards, away from the cloud. We assume that 5 per cent of the Lyman continuum pho-tons from each source escape the galaxy (e.g. Barger et al.2013; Kim et al. 2013), 15 per cent produce the DIG (Reynolds 1990) and the remaining 80 per cent produce local HII regions around
each source. We are considering the scattering of Hα photons
that originate in HIIregions, which are produced by 80 per cent
of the total ionizing luminosity. Assuming Case B recombination,
each Lyman continuum photon produces 0.46 Hαphotons (Martin
1988). Therefore, the Hαflux impinging on galactic cirrus clouds is 0.46×0.8FLyC=0.37FLyC=6.9×106cm−2s−1.
To determine the contribution of dust scattering in this cloud, we create simulations of a spherical cloud with r = 0.5 pc and
n= 103cm−3 using a 2003 pixel grid. The Hαflux incident on
the cloud in this simulation is assumed to be directed upwards from HIIregions close to the mid-plane of the Galaxy. We then
run the scattered light simulations described above and find that the intensity of Hαscattered by the cloud is 1.4R, which is about 40 per cent of the total Hαintensity from the cloud. These results indicate that the presence of high-density galactic cirrus can increase the contribution of dust-scattered light to the total Hαintensity we observe in the Galaxy. However, the intensity of Hαemission that results from ionization is still larger than that from scattering.
4 C O N C L U S I O N S
Using MHD and analytic fractal models for the 3D density structure appropriate for the ISM in the outer disc of a spiral galaxy, we have investigated the relative contributions to the Hαintensity from
Figure 5. Face-on view of the ratio of scattered to total light versus distance from mid-plane. The solid line shows the average ratio and the dotted grey lines show every sight line through the simulations box for (a) MHD simulations and (b) fractal simulations with the HG phase function.
Hαemissivity from DIG. We do not resolve small-scale HIIregions
within our photoionization simulations, so make the assumption that the Hαluminosity from HIIregions is equal to what we compute from the DIG. The main results of our combined photoionization and Hα-scattered light models are as follows.
(i) The intensity of scattered Hαoriginating from HIIregions
differs depending on the density structure. In both fractal and MHD structures, the intensity of scattered light peaks around the mid-plane of the simulation closest to the HIIregions and where the gas
density is highest. The intensity of scattered light then decreases away from the mid-plane to less than about∼10 per cent in the MHD and∼5 per cent in fractal models. The larger scattered light fraction in the MHD simulations is due to the very low densities and hence low intrinsic Hαemissivity at large heights in those models. (ii) In low-density regions, a large fraction of the Hα in our simulations is dust-scattered light that originates in HIIregions, a
result of the small Hαemissivity from the lowest density DIG. (iii) Different scattering phase functions and albedo affect the intensity of scattered light in the models; however, this does not significantly change our results, increasing the largest fraction of scattered light by 10 per cent.
(iv) Scattering of Hαphotons from HIIregions off high-density
cirrus in the ISM can dominate over the Hαintensity from pho-toionization, contributing 40 per cent of the total Hα. However, the covering fraction of such clouds is∼50 per cent (Gillmon & Shull
2006), so such clouds would not affect all sight lines through the Galaxy.
AC K N OW L E D G E M E N T S
The authors would like to thank Kwang Il-Seon and Adolf Witt for their helpful comments on an early version manuscript. JB ac-knowledges the support of an STFC studentship. LMH
acknowl-edges support from the US National Science Foundation through award AST-1108911.
R E F E R E N C E S
Barger K. A., Haffner L. M., Bland-Hawthorn J., 2013, ApJ, 771, 132 Barnes J. E., Wood K., Hill A. S., Haffner L. M., 2014, MNRAS, 440, 3027 Bland-Hawthorn J., Freeman K. C., Quinn P. J., 1997, ApJ, 490, 143 Brandt T. D., Draine B. T., 2012, ApJ, 744, 129
Dickey J. M., Lockman F. J., 1990, ARA&A, 28, 215 Dove J. B., Shull J. M., 1994, ApJ, 430, 222 Elmegreen B. G., 1997, ApJ, 477, 196
Ferguson A. M. N., Wyse R. F. G., Gallagher J. S., III, Hunter D. A., 1996, AJ, 111, 2265
Ferrara A., Bianchi S., Dettmar R.-J., Giovanardi C., 1996, ApJ, 467, L69 Franco G. A. P., 1989, A&A, 223, 313
Garmany C. D., Conti P. S., Chiosi C., 1982, ApJ, 263, 777 Gillmon K., Shull J. M., 2006, ApJ, 636, 908
Haffner L. M., Reynolds R. J., Tufte S. L., 1999, ApJ, 523, 223 Haffner L. M. et al., 2009, Rev. Mod. Phys., 81, 969
Hill A. S., Joung M. R., Mac Low M.-M., Benjamin R. A., Haffner L. M., Klingenberg C., Waagan K., 2012, ApJ, 750, 104
Hill A. S., Benjamin R. A., Haffner L. M., Gostisha M. C., Barger K. A., 2014, ApJ, 787, 106
Jura M., 1979, ApJ, 227, 798
Kim J.-h., Krumholz M. R., Wise J. H., Turk M. J., Goldbaum N. J., Abel T., 2013, ApJ, 775, 109
Ma´ız-Apell´aniz J., 2001, AJ, 121, 2737 Martin P. G., 1988, ApJS, 66, 125
Mathis J. S., Rumpl W., Nordsieck K. H., 1977, ApJ, 217, 425 Miller W. W., III, Cox D. P., 1993, ApJ, 417, 579
Oey M. S. et al., 2007, ApJ, 661, 801
Otte B., Reynolds R. J., Gallagher J. S., III, Ferguson A. M. N., 2001, ApJ, 560, 207
Otte B., Gallagher J. S., III, Reynolds R. J., 2002, ApJ, 572, 823 Rand R. J., 1998, ApJ, 501, 137
Reynolds R. J., 1990, ApJ, 349, L17
Reynolds R. J., Scherb F., Roesler F. L., 1973, ApJ, 185, 869
Reynolds R. J., Tufte S. L., Kung D. T., McCullough P. R., Heiles C., 1995, ApJ, 448, 715
Reynolds R. J., Haffner L. M., Tufte S. L., 1999, ApJ, 525, L21 Rogers H., Pittard J. M., 2013, MNRAS, 431, 1337
Seon K.-I., Witt A. N., 2012, ApJ, 758, 109
Thilker D. A., Walterbos R. A. M., Braun R., Hoopes C. G., 2002, AJ, 124, 3118
Vacca W. D., Garmany C. D., Shull J. M., 1996, ApJ, 460, 914 Weingartner J. C., Draine B. T., 2001, ApJS, 134, 263
Witt A. N., Gold B., Barnes F. S., III, DeRoo C. T., Vijh U. P., Madsen G. J., 2010, ApJ, 724, 1551
Wood K., Reynolds R. J., 1999, ApJ, 525, 799
Wood K., Mathis J. S., Ercolano B., 2004, MNRAS, 348, 1337
Wood K., Haffner L. M., Reynolds R. J., Mathis J. S., Madsen G., 2005, ApJ, 633, 295
Wood K., Hill A. S., Joung M. R., Mac Low M.-M., Benjamin R. A., Haffner L. M., Reynolds R. J., Madsen G. J., 2010, ApJ, 721, 1397
Zurita A., Rozas M., Beckman J. E., 2000, A&A, 363, 9