doi:10.4236/jbise.2011.412095 Published Online December 2011 (http://www.SciRP.org/journal/jbise/).
Ovulation detection mechanism—a microcomputer based
approach
Olugbenga K. Ogidan1*, Ayodeji J. Bamisaye2, Olawumi Adetan3
1
Information Communications Unit, Ondo State University of Science and Technology (OSUSTECH), Okitipupa, Nigeria;
2
Department of Electrical and Electronics Engineering, Federal University of Technology, Akure, Nigeria;
3
Department of Electrical and Electronics Engineering, University of Ado Ekiti, Ado Ekiti, Nigeria. E-mail: *[email protected], [email protected], [email protected]
Received 8 June 2011; revised 2 August 2011; accepted 9 November 2011.
ABSTRACT
This paper presents a real-time microcomputer-based logger for measuring basal body temperature (BBT). BBT is the normal resting body temperature of a healthy person immediately upon waking in the morning. The temperature for women normally rises after ovulation due to hormonal changes. The tem-perature is logged real-time into the computer over a period and the BBT chart produced is used to predict ovulation. There is high correlation between the ap-proach developed by this study and other standard measuring equipments—correlation of 0.9945with standard thermistor, and correlation of 0.9977 with standard thermocouple. This development enables privacy of use, allowing women to predict their ovu-lation status at a personal level.
Keywords: Basal Body Temperature (BBT); Microcom- puter-Based Logger, Ovulation, Thermistor, Thermocou- ple and Correlation
1. INTRODUCTION
Infertility is the inability of a couple to obtain a clinical recognizable pregnancy after 12 months of unprotected intercourse. The alarming rate of infertility among cou-ples calls for serious efforts and attention from any woman who is serious about getting pregnant. Most women, and sometimes their partners, would want to learn when ovulation and implantation occurs and what is the best time for intercourse to achieve pregnancy. Timing the ovulation period is a very important step towards getting pregnant. With the latest scientific im-provements, several methods and tests are available for determining, with a high degree of certainty, when your ovulation occurs. These include [1,2]:
Calendar Charting/Ovulation Calculator: Using this method, a woman uses her past menstrual cycle as a
guide. This is done by calculating the average number of days in her cycle, to estimate the future fertile times.
Cervical Mucus Monitoring: In this method, the cervical fluid is monitored each day.At the beginning of ovulation, the cervical fluid will go from dry or sticky to creamy like a lotion, and finally will become like egg white. Many women compare mucus at this stage to raw egg whites. A woman is most fertile during the egg white phase.
Cervical Observation: The position of a woman’s cervix is used to determine ovulation. During and in the first few days after menstruation, the cervix is fairly low and firm like the tip of a nose. When the wet cervical fluid begins to show, the cervix begins to move up, be-comes more soft, wet and open. During ovulation, the cervix is at its highest and most open. After ovulation, the cervix returns to its low, firm and closed position.
Lower Abdominal Discomfort: About one-fifth of women actually feel ovulatory activity, which can range from mild achiness to twinges of pain. The condition, called mittelschmerz, may last a few minutes to a few hours [3].
the performance testing and analysis, while the result and conclusion drawn are presented in Sections 4 and 5 respectively.
2. MATERIALS AND METHODS
A simple but sensitive temperature sensory device (called data-logger) was designed to measure basal body tem-perature (BBT). The device is portable and battery pow-ered. This device contains a temperature sensor—ne- gative temperature coefficient (NTC) thermistor, which transduces the temperature into electronic analog signal. The analog signal is then passed into an analog to digital converter (ADC). The converted signal is then received and transmitted (using a transceiver) to the microcom-puter through the parallel port [7]. In the laboratory set-ting, a personal computer is used. The arrangement is illustrated in Figure 1. A computer program in Visual Basic 6.0 was then written to address the parallel port and to log the data into a user-friendly interface where the temperature is both interpreted and analyzed. The circuit diagram is shown in Figure 2, while Figure 3 presents how the device is interfaced with a personal computer.
3. PERFORMANCE TESTING AND
ANALYSIS
After, the individual circuit stages and the software
were tested; the assembly was then tested connecting to a human being (a lady of 21 yr). The temperature was logged into the computer over a period of time. This was done also with a mercury thermometer and the readings were found to be almost the same with a difference of
Temperature sensor
NTC thermistor ADC
[image:2.595.313.539.159.364.2]Micro Computer Interface Transceiver
Figure 1. Block diagram of a Basal Body Temperature (BBT) Microcomputer Logger. Let Figure 2 be labelled as Circuit diagram showing NTC thermistor with a PC parallel port.
F
Figure 3. Diagram of a basal body temperature (BBT) logger interfaced with a personal computer.
0.02˚C.
The software was tested and found to be able to: Measure and log human temperature into the
com-puter real-time;
Start and stop logging automatically and raise an au-dible alarm or give a visual message when the reading is beyond a pre-set (threshold) value.
Give the temperature reading as well as details of the date, time (minute, second)
It must be noted however that the temperature sensor would have to be attached to the body under examina-
[image:3.595.60.540.416.691.2]tion in order to take the reading for a period of time. In this paper, the temperature measurement device was calibrated against two known standard digital ther-mometers using thermistor and thermocouple as sensors. The correlation with thermistor and thermocouple was 0.9945 and 0.9977 respectively. Therefore, calibration can be defined as the process of determining the charac-teristic relationship between the values of the physical quantity applied to an instrument and the corresponding positions of the display [6].
Table 1 shows the table of data recorded every 120 seconds.
4. RESULTS AND DISCUSSION
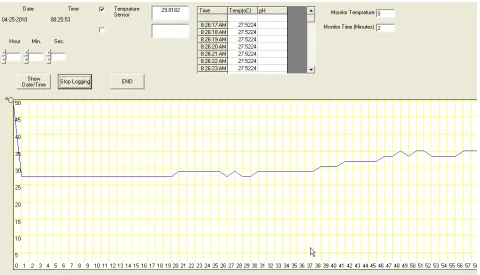
The basal body temperature (BBT) measured was logged into a user-friendly interface that facilitates the viewing, digital recording and graphical representation of the measured temperature was presented in Figure 4, any change (rise or low) in temperature for a specific period of time can easily be detected and analyzed. The devel-oped logger was used (at room temperature) to measure atmospheric temperature alongside standard temperature sensors (thermistor and thermocouple) for about one hour(between 8 am and 9 am). The correlation with thermistor was 0.9945 and 0.9977 with thermocouple. The results tend to unity thus showing a high degree of measurement reliability. Figure 5 shows the graph of the
F
Table 1. Data recorded every 120 seconds from 8 am to 9 am using standard thermistor, standard thermocouple and Devel-oped data logger.
Time (secs)
8 am - 9 am Develop Standard TH Standard THC
120 25.62 25.69 25.67
240 27.54 27.58 27.55
360 27.60 27.64 27.55
480 27.68 27.58 27.68
600 27.72 27.60 27.55
720 27.72 27.60 27.55
840 28.71 28.60 28.67
960 28.50 28.55 28.50
1080 28.44 28.55 28.50
1200 28.50 28.55 28.50
1320 28.52 28.55 28.50
1440 28.66 28.63 28.67
1560 28.88 28.71 28.84
1680 28.60 28.63 28.66
1800 28.82 28.71 28.84
1920 28.66 28.63 28.67
2040 28.66 28.63 28.67
2160 28.60 28.63 28.66
2280 28.84 28.71 28.84
2400 28.66 28.63 28.67
2520 28.62 28.63 28.66
2640 28.86 28.71 28.84
2760 28.44 28.55 28.50
2880 28.64 28.62 28.65
3000 28.46 28.55 28.50
3120 28.66 28.63 28.67
3240 28.64 28.62 28.65
3360 28.66 28.63 28.66
3480 28.64 28.62 28.65
3600 28.66 28.63 28.67
Correlation with develop
[image:4.595.59.281.115.720.2]thermometer 0.9945748 0.997785
Figure 5. Graph of developed BBT logger compared with standard thermistor and thermocouple when used to measure atmospheric temperature.
comparison.
5. CONCLUSION
This study has developed a Basal Body Temperature (BBT) logging system, which makes fertility charting very easy. The system has been calibrated and is being put to clinical use. The developed logger compares fa-vourably with standard thermistor with a correlation of 0.9945, and with standard thermocouple with a correla-tion of 0.9977. This device has many advantages in-cluding enabling privacy, provides non-intrusive method of ovulation detection; provides data easily to physicians which could be interpreted for diagnosis and treatment of their patients; and has a good potential for telemedi-cine.
6. ACKNOLEDGEMENTS
The researchers acknowledge Prof. M.O Kolawole and Dr V.S.A Adeloye for their immense assistance and contribution and also The Federal University of Technology, Akure, Nigeria.
REFERENCES
[1] Feminist Women’s Health Centerv (FWHC) (2004), acces- sed 23 December 2009. http://www.fwhc.org/
[2] WHO, (2004) Medical eligibility criteria for contracep- tive use: fertility awareness-based methods. World Health Organization,Retrieved 2010.
[3] Ross, M.H. and Pawlina, W. (2006) Histology: A text and Atlas. Lippincott Williams & Wilkins, Philadelphia. [4] Moghissi, K.S. (1976) Accuracy of basal body
tempera-ture for fertility detection. Fertil Steril, 27, 1415-1421. [5] Weschler, T. (2002) Taking charge of your fertility. Har-
per Collins, New York.
Technology, Akure, Nigeria.
[7] Axelson, (2000) Parallel port complete. Lakeview