ISSN Online: 2327-5960 ISSN Print: 2327-5952
DOI: 10.4236/jss.2019.71008 Jan. 14, 2019 85 Open Journal of Social Sciences
Customized Production Project Risk
Management with Analytic Hierarchy Process
Junxin Zhong
1,2, Jintai Lv
1,3, Ying Zhang
1,41School of Business Administration, South China University of Technology, Guangzhou, China 2Engineering, Ji Neng Composite Material & Products (Guangzhou) Ltd., Guangzhou, China 3Service Center, Guangzhou Tianwei Information Technology Co. Ltd., Guangzhou, China 4General Management, GRG Banking I.T. Co. Ltd., Guangzhou, China
Abstract
Based on the PMBOK risk management frame, this paper collects the poten-tial risk factors of the customized project of company T with Delphi method. After several rounds of research, we get 22 level three factors from the origi-nal 6 level one factor. Then we filtrate all the 22 level three factors to identify the TOP10 factors with Analytic Hierarchy Process (AHP). This method is qualitative and quantitative. The project manager can find out the critical factors quickly. It’s very helpful to analyze and solve issues during project management.
Keywords
Customized Production Project, Risk Management, Research on Critical Factors, Analytic Hierarchy Process, Lean Production, Delphi Method
1. Introduction
As a brand new production mode, customized production aims to produce cus-tomized products under acceptable cost and time line. Enormous investment is also required for the new technology and equipments. The internal and external environment changes very quickly as well. The risk happens everywhere, which is believed that a valid risk management is very critical to the success of the project [1]. While the current risk management effect depends on the experience of the project manager. All the arrangements and decisions made under this sit-uation are very subjective. Besides, it’s very difficult to find out and focus on the most critical factors when all of them come to you in the same time. There is a big challenge to transfer the risk management knowledge to your peers as well. It How to cite this paper: Zhong, J.X., Lv, J.T.
and Zhang, Y. (2019) Customized Produc-tion Project Risk Management with Analytic Hierarchy Process. Open Journal of Social Sciences, 7, 85-95.
https://doi.org/10.4236/jss.2019.71008
Received: December 20, 2018 Accepted: January 11, 2019 Published: January 14, 2019
Copyright © 2019 by author(s) and Scientific Research Publishing Inc. This work is licensed under the Creative Commons Attribution International License (CC BY 4.0).
http://creativecommons.org/licenses/by/4.0/
DOI: 10.4236/jss.2019.71008 86 Open Journal of Social Sciences is a big waste to the company.
This paper uses AHP to calculate the weight of each critical factor and rank them. It’s quantitative and qualitative which can help avoid the subjective deci-sions. It’s also very easy for the project managers to find out the important fac-tors to help improve the efficiency of the project risk management. The project management knowledge with the AHP can be stored and transferred as well.
2. Literature Review
In the 1960s, risk management becomes a subject. The purpose of the traditional risk management is to decrease the negative effect to the business operation and sustainable development. The primary strategy is to avoid or transfer the risk [2] [3]. Insurance is the most important tool in this period. The risk management research focus on the credits risk and financial risk [4]. The Global Association of Risk Professionals (GARP) established in 1996. It drives the establishing and perfecting of the certification and qualification examination system. The GARP is accepted and recommended by the financial industry in many countries. It becomes the principle standard to measure the risk management ability of the employee. In the same year, Project Management Institute (PMI) issues the first edition of PMBOK. Risk management is one of the nine knowledge field and never been removed since that [5] [6]. Project risk is defined as an uncertain event or condition by PMBOK the 5th edition. It will create positive effect or negative effect to the project objective once happened. The target of project risk management is to enhance the percentage and effect of the positive events and lower them on the negative events. The risk management is divided into six processes by PMBOK risk management frame. They are plan the risk manage-ment, identify the risk, implement qualitative risk analysis, implement quantita-tive risk analysis, plan the risk response and control the risk [7].
AHP (Analytic Hierarchy Process) is suggested by Professor T.L. Saaty from University of Pittsburgh in the early 1970s. It’s an easy and flexible quantitative decision-making method to qualitative questions. It can divide various factors from complicated problems into different levels to make them more systematical
[8].
According to the subjective judgment of the objective reality, the AHP com-bines the expert advice and analysis judgment effectively. First of all, make quantitative description of the importance between different factors in the same level. Then calculate each factor’s weight of importance. At last, rank the factor based on the weight of importance. The AHP combines the qualitative and quantitative analysis, flexible and systematical to deal with different kinds of problems, which help it get widely attention and application quickly.
3. Identify Risk Factors
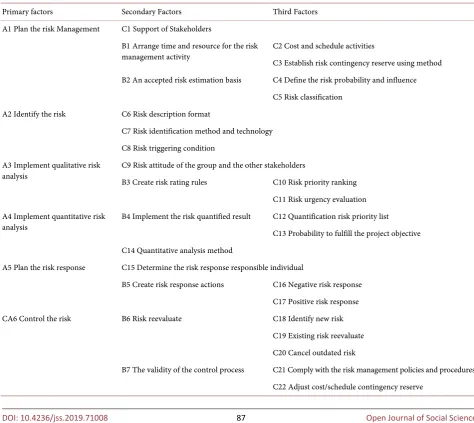
DOI: 10.4236/jss.2019.71008 87 Open Journal of Social Sciences open research, we identify the secondary factor from A1 plan the risk manage-ment、A3 implement qualitative risk analysis、A4 implement quantitative risk analysis、A5 plan the risk response and A6 control the risk. We get 11 secondary factors. In the second round evaluation research, we identify the secondary fac-tor from A2 identify the risk and identify the third facfac-tor from 11 secondary factors in the meantime. It totally takes 3 rounds. We get 7 secondary factors and 22 third factors from original 6 primary factors. Establish the critical factor evaluation system of customized production project. See Table 1.
4. Rank Risk Factors with AHP
4.1. AHP Procedure
In order to find out the top 10 critical risk factors, this paper analysis all the 22 risk factors with AHP, below is the procedure:
[image:3.595.56.531.329.752.2]1) Create hierarchy structure model 2) Construct comparison matrix
Table 1. Critical factor evaluation system of customized production project.
Primary factors Secondary Factors Third Factors
A1 Plan the risk Management C1 Support of Stakeholders
B1 Arrange time and resource for the risk
management activity C2 Cost and schedule activities
C3 Establish risk contingency reserve using method B2 An accepted risk estimation basis C4 Define the risk probability and influence
C5 Risk classification A2 Identify the risk C6 Risk description format
C7 Risk identification method and technology C8 Risk triggering condition
A3 Implement qualitative risk
analysis C9 Risk attitude of the group and the other stakeholders B3 Create risk rating rules C10 Risk priority ranking
C11 Risk urgency evaluation A4 Implement quantitative risk
analysis B4 Implement the risk quantified result C12 Quantification risk priority list C13 Probability to fulfill the project objective
C14 Quantitative analysis method
A5 Plan the risk response C15 Determine the risk response responsible individual
B5 Create risk response actions C16 Negative risk response C17 Positive risk response CA6 Control the risk B6 Risk reevaluate C18 Identify new risk
C19 Existing risk reevaluate C20 Cancel outdated risk
DOI: 10.4236/jss.2019.71008 88 Open Journal of Social Sciences 3) Check consistency
4) Calculate the final weight value.
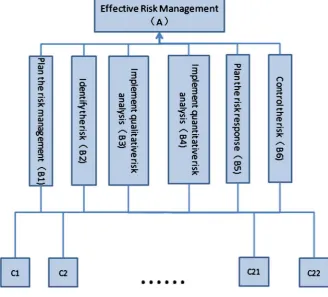
4.2. Create Hierarchy Structure Model
In order to create hierarchy structure model, we need to define the target layer, standard layer and decision layer. The target of this paper is to find out the criti-cal factor of customized production project, so the target layer is effective risk management (A). Because the paper is based on the PMBOK risk management, so the 6 processes (plan the risk management, identify the risk, implement qua-litative risk analysis, implement quantitative risk analysis, plan the risk response and control the risk) are the standard layer (B1-B6). At last, we use the 22 risk factors from Delphi as the decision layer (C1-C22). See below Figure 1.
4.3. Construct Comparison Matrix
[image:4.595.209.538.417.714.2]In order to construct comparison matrix for AHP, we need to compare the im-portance of each factor in the same group. According to the interview informa-tion with the industry experts, we get the comparison value. We compare the factor i with the factor j in the same group, and mark them from 1 to 9. 1 means factor i is as important as factor j, 3 means factor i is a little more important than factor j, 5 means factor i is obviously more important than factor j, 7 means fac-tor i is intensely more important than facfac-tor j, 9 means facfac-tor i is extremely more important than factor j, the other number means the importance is between its
DOI: 10.4236/jss.2019.71008 89 Open Journal of Social Sciences front number and the latter number. The importance of j to i is the reciprocal of the importance of i to j. See Table 2 for the definition of each scale number.
After summarized all the information, we get the below comparison matrix:
Table 3 is the comparison matrix between decision layer C1 to C5 of the stan-dard layer B1; Table 4 is the comparison matrix between decision layer C6 to C8 of the standard layer B2; Table 5 is the comparison matrix between decision layer C9 to C11 of the standard layer B3; Table 6 is the comparison matrix be-tween decision layer C12 to C14 of the standard layer B4; Table 7 is the compar-ison matrix between decision layer C15 to C17 of the standard layer B5; Table 8
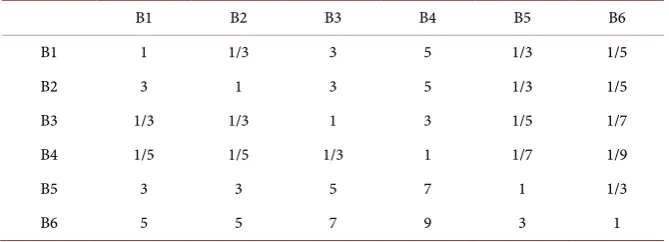
is the comparison matrix between decision layer C18 to C22 of the standard layer B6; Table 9 is the comparison matrix between standard layer B1 to B6 of
Table 2. Definition of each scale number for the comparison matrix.
Scale aij Definition
1 factor i is as important as factor j 3 factor i is a little more important than factor j 5 factor i is obviously more important than factor j 7 factor i is intensely more important than factor j 9 factor i is extremely more important than factor j 2, 4, 6, 8 the importance is between its front number and the latter number reciprocal When compare j to i,the aji = 1/aij
Table 3. Decision layer comparison matrix of standard layer B1.
C1 C2 C3 C4 C5
C1 1 7 5 5 3
C2 1/7 1 1/3 1/2 1/3
C3 1/5 3 1 3 3
C4 1/5 2 1/3 1 1/3
C5 1/3 3 1/3 3 1
Table 4. Decision layer comparison matrix of standard layer B2.
C6 C7 C8
C6 1 1/3 1/7
C7 3 1 1/5
C8 7 5 1
Table 5. Decision Layer Comparison Matrix of Standard Layer B3.
C9 C10 C11
C9 1 1/5 1/3
C10 5 1 3
DOI: 10.4236/jss.2019.71008 90 Open Journal of Social Sciences Table 6. Decision layer comparison matrix of standard layer B4.
C12 C13 C14
C12 1 3 5
C13 1/3 1 3
[image:6.595.206.539.194.267.2]C14 1/5 1/3 1
Table 7. Decision layer comparison matrix of standard layer B5.
C15 C16 C17
C15 1 3 5
C16 1/3 1 3
C17 1/5 1/3 1
Table 8. Decision layer comparison matrix of standard layer B6.
C18 C19 C20 C21 C22
C18 1 3 7 1/3 5
C19 1/3 1 5 1/5 3
C20 1/7 1/5 1 1/7 1/3
C21 3 5 7 1 5
C22 1/5 1/3 3 1/5 1
Table 9. Standard layer comparison matrix of target layer A.
B1 B2 B3 B4 B5 B6
B1 1 1/3 3 5 1/3 1/5
B2 3 1 3 5 1/3 1/5
B3 1/3 1/3 1 3 1/5 1/7
B4 1/5 1/5 1/3 1 1/7 1/9
B5 3 3 5 7 1 1/3
B6 5 5 7 9 3 1
the target layer A.
After we get the comparison matrix, we calculate the relative weight Wi of factor i to the upper layer. The formula for Wi as below:
Wi Qi Qa= , and
1
1
n n
j
Qi Cij
=
=
∏
, Cij is the importance scale of factor i tofactor j.
(
)
/ , 1,2,
Qa= i j= ⋅⋅⋅n
[image:6.595.206.540.299.407.2] [image:6.595.206.541.437.558.2]DOI: 10.4236/jss.2019.71008 91 Open Journal of Social Sciences Table 10. Relative weight result of target layer A.
Effective risk management consistency ratio of the judgment matrix: 0.0028; the weight to the target: 1.0000; λmax: 6.0179
effective risk management risk management Plan the Identify the risk Implement qualitative risk analysis Implement quantitative risk analysis risk response Plan the Control the risk Wi
Plan the risk management 1 0.6703 1.4918 2.2255 0.6703 0.4493 0.1367
Identify the risk 1.4918 1 1.4918 2.2255 0.6703 0.4493 0.1562
Implement qualitative risk analysis 0.6703 0.6703 1 1.4918 0.4493 0.3012 0.098
Implement quantitative risk analysis 0.4493 0.4493 0.6703 1 0.3012 0.2019 0.0657
Plan the risk response 1.4918 1.4918 2.2255 3.3201 1 0.6703 0.2181
[image:7.595.57.538.311.454.2]Control the risk 2.2255 2.2255 3.3201 4.953 1.4918 1 0.3253
Table 11. Relative weight result of standard layer B1.
Plan the risk management consistency ratio of the judgment matrix:0.0126; the weight to the target:0.1367; λmax:5.0563
Plan the risk management of Stakeholders C1 Support C2 Cost and schedule activities
C3 Establish risk contingency reserve using method
C4 Define the risk probability and
influence
C5 Risk classification Wi
C1 Support of Stakeholders 1 3.3201 2.2255 2.2255 1.4918 0.3525
C2 Cost and schedule activities 0.3012 1 0.6703 0.8187 0.6703 0.1197
C3 Establish risk contingency reserve using method 0.4493 1.4918 1 1.4918 1.4918 0.2014
C4 Define the risk probability and influence 0.4493 1.2214 0.6703 1 0.6703 0.1405
C5 Risk classification 0.6703 1.4918 0.6703 1.4918 1 0.1859
Table 12. Relative weight result of standard layer B2.
Identify the risk consistency ratio of the judgment matrix: 0.0000; the weight to the target: 0.1562; λmax: 3.0000
Identify the risk description format C6 Risk method and technology C7 Risk identification C8 Risk triggering condition Wi
C6 Risk description format 1 0.6703 0.3012 0.1721
C7 Risk identification method and technology 1.4918 1 0.4493 0.2567
C8 Risk triggering condition 3.3201 2.2255 1 0.5713
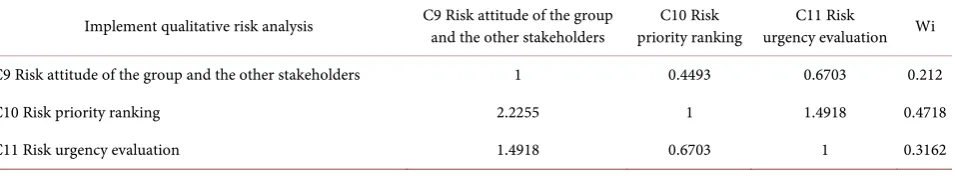
Table 13. Relative weight result of standard layer B3.
Implement qualitative risk analysis consistency ratio of the judgment matrix:0.0000; the weight to the target:0.0980; λmax:3.0000
Implement qualitative risk analysis C9 Risk attitude of the group and the other stakeholders priority ranking C10 Risk urgency evaluation C11 Risk Wi
C9 Risk attitude of the group and the other stakeholders 1 0.4493 0.6703 0.212
C10 Risk priority ranking 2.2255 1 1.4918 0.4718
[image:7.595.55.539.502.587.2] [image:7.595.62.540.639.727.2]DOI: 10.4236/jss.2019.71008 92 Open Journal of Social Sciences Table 14. Relative weight result of standard layer B4.
Implement quantitative risk analysis consistency ratio of the judgment matrix: 0.0000; the weight to the target: 0.0657; λmax: 3.0000
Implement quantitative risk analysis C12 Quantification risk priority list C13 Probability to fulfill the project objective C14 Quantitative analysis method Wi
C12 Quantification risk priority list 1 1.4918 2.2255 0.4718
C13 Probability to fulfill the project objective 0.6703 1 1.4918 0.3162
[image:8.595.61.540.234.311.2]C14 Quantitative analysis method 0.4493 0.6703 1 0.212
Table 15. Relative weight result of standard layer B5.
Plan the risk response consistency ratio of the judgment matrix: 0.0000; the weight to the target: 0.2181; λmax: 3.0000
Plan the risk response C15 Determine the risk response responsible individual C16 Negative risk response risk response C17 Positive Wi
C15 Determine the risk response responsible individual 1 1.4918 2.2255 0.4718
C16 Negative risk response 0.6703 1 1.4918 0.3162
C17 Positive risk response 0.4493 0.6703 1 0.212
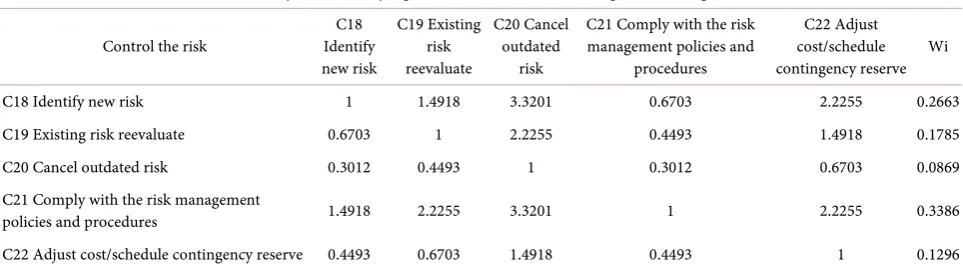
Table 16. Relative weight result of standard layer B6.
Control the risk consistency ratio of the judgment matrix: 0.0057; the weight to the target: 0.3253; λmax: 5.0256
Control the risk Identify C18 new risk C19 Existing risk reevaluate C20 Cancel outdated risk
C21 Comply with the risk management policies and
procedures
C22 Adjust cost/schedule contingency reserve Wi
C18 Identify new risk 1 1.4918 3.3201 0.6703 2.2255 0.2663
C19 Existing risk reevaluate 0.6703 1 2.2255 0.4493 1.4918 0.1785
C20 Cancel outdated risk 0.3012 0.4493 1 0.3012 0.6703 0.0869
C21 Comply with the risk management
policies and procedures 1.4918 2.2255 3.3201 1 2.2255 0.3386
C22 Adjust cost/schedule contingency reserve 0.4493 0.6703 1.4918 0.4493 1 0.1296
4.4. Check Consistency
After we calculate the weight of each factor, we need to check the consistency of the comparison matrix. Calculate the consistency ratio CR of each matrix. If the CR is less than 0.1, it’s acceptable. Otherwise, we need to rerun the comparison matrix. We can get the CR from the below formula.
(
max) (
)
, 1
CI
CR CI n n
RI
λ
= = − − ,
The RI can be found from Table 17 based on the latitude n (the quantity of factors).
( )
max 1 n i AQ i n Qi λ = = ×∑
, [image:8.595.57.539.354.489.2]DOI: 10.4236/jss.2019.71008 93 Open Journal of Social Sciences We can get the CR of each comparison matrix from Table 10 to Table 16 and they are all less than 0.1, which is acceptable to the consistency check. Table 18
is the summary of all the CR.
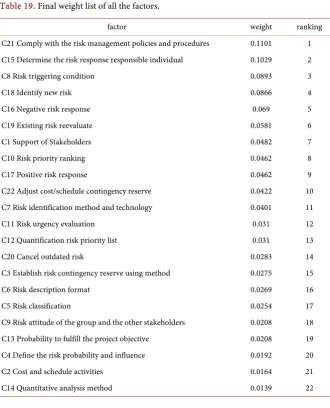
4.5. Calculate the Final Weight Value
Multiply the relative weight of each factor by the relative weight of correspond-ing standard layer. We can get the final weight of all the 22 factors, rank them in descending order, we get the below final weight list of all the factors, Table 19. Table 17. Random consistency index value of RI.
n 1 2 3 4 5 6 7 8 9
RI 0 0 0.58 0.90 1.12 1.28 1.32 1.41 1.45
Table 18. CR value of the comparison matrix.
B1 B2 B3 B4 B5 B6 A
[image:9.595.207.538.327.736.2]CR 0.0126 0.0000 0.0000 0.0000 0.0000 0.0057 0.0028
Table 19. Final weight list of all the factors.
factor weight ranking
C21 Comply with the risk management policies and procedures 0.1101 1 C15 Determine the risk response responsible individual 0.1029 2
C8 Risk triggering condition 0.0893 3
C18 Identify new risk 0.0866 4
C16 Negative risk response 0.069 5
C19 Existing risk reevaluate 0.0581 6
C1 Support of Stakeholders 0.0482 7
C10 Risk priority ranking 0.0462 8
C17 Positive risk response 0.0462 9
C22 Adjust cost/schedule contingency reserve 0.0422 10 C7 Risk identification method and technology 0.0401 11
C11 Risk urgency evaluation 0.031 12
C12 Quantification risk priority list 0.031 13
C20 Cancel outdated risk 0.0283 14
C3 Establish risk contingency reserve using method 0.0275 15
C6 Risk description format 0.0269 16
C5 Risk classification 0.0254 17
C9 Risk attitude of the group and the other stakeholders 0.0208 18 C13 Probability to fulfill the project objective 0.0208 19 C4 Define the risk probability and influence 0.0192 20
C2 Cost and schedule activities 0.0164 21
DOI: 10.4236/jss.2019.71008 94 Open Journal of Social Sciences With the AHP, we can calculate the weight value of all the 22 factors. Ranking them in descending order, we can get top 10 factors as the risk management critical factors. AHP combines the qualitative and quantitative analysis, the project manager can find out the critical factors quickly. It’s very helpful to analysis and solves problems during project management.
5. Management Enlightenment
Top 10 critical factors belong to Plan the risk management, Identify the risk, Implement qualitative risk analysis, Plan the risk response and Control the risk. Besides, Plan the risk response and Control the risk are particularly important, they include 7 of 10 critical factors. Project manager can pay extra attention to them.
The weight value of top two factors is obviously bigger. Comply with the risk management policies and procedures as the NO.1 critical factor means it’s very important to ensure the risk management policies and procedures are well ex-ecuted and complied during the whole risk management cycle. Only in this way we can provide theoretical basis to the other risk management activities. Besides, we should determine the responsible individual for each risk, only when the re-sponsible individual take his own responsibility, follow the risk management policies and procedures, the risk can be well managed.
According to the top 10 critical factors, we can identify the top 10 risks. For example, No.3 critical factor is Risk triggering condition. The corresponding risk is the structure failure. When the product is manufactured, it’s very difficult to tell whether there is a structure issue. But the customers are the professional players. They are much stronger and faster than the amateurs which means the sticks will be broken after several shoots. And broken sticks in the professional level will affect the brand reputation. In order to manage this risk, we should take actions in advance to describe the triggering condition of the structure fail-ure.
As we can see from the final weight list of the factors, the weight of the last five factors are much lower. Which means it will not have too much influence to the whole project. So we don’t need to spend too much resource on them. Just need to review them in a certain period.
6. Conclusion
DOI: 10.4236/jss.2019.71008 95 Open Journal of Social Sciences will improve the efficiency of project management.
Acknowledgements
Thanks a lot for your valuable guidance, Professor Jiangping Wan.
Conflicts of Interest
The authors declare no conflicts of interest regarding the publication of this pa-per.
References
[1] Jeffrey, L. (2017) 14 Management Principles from the World’s Greatest Manufac-turer. Li, F.L. Translated. China Machine Press.
[2] Yan, F.H., Dang, X. and Yan, W.H. (2007) Summary of Risk Management Progress and Trend. Management Modernization, No. 2, 30-33.
[3] Zhang, Q. and Chen, L.Q. (2008) Summary of Risk Management Theory Follow and the Latest Study Trend. Financial Theory & Practice, No. 10, 105-109.
[4] Rodriguez, E. and Edwards, J.S. (2009) Knowledge Management and Enterprise Risk Management Implementation in Financial Services. Society of Actuaries, No. 12.
[5] Xu, J.L. and Zhou, J.X. (1998) Risk Management. China Finance Publishing House, Beijing.
[6] Qi, A.B. (2010) Project Risk Management. Nankai University Press, Tianjin, 1-35. [7] Project Management Institute. (2013) Project Management Body of Knowledge
(PMBOK Guide). 5th Edition, Publishing House of Electronics Industry, Beijing, 309-312.