ISSN Online: 2327-4344 ISSN Print: 2327-4336
DOI: 10.4236/gep.2018.69008 Sep. 10, 2018 100 Journal of Geoscience and Environment Protection
Interpretation of EC Fine Grid Numerical
Prediction Products in the Forecast of
Frozen Fog in Urumqi Airport
Hongru Yang
1, Nan Wang
1*, Yulin Qin
2, Dawei Fan
11Civil Aviation Xinjiang Air Traffic Control Bureau Meteorological Center, Urumqi, China 2Jilin Province Observatory, Changchun, China
Abstract
In this paper, Urumqi Airport time-lapse ground man-made observation data from November 2015 to February 2017, European fine grid (0.25 × 0.25) ini-tial field (20 o’clock) and the forecast field within 24 hours were utilized. From November 2015 to February 2016, the relevant materials were used as research samples (a total of 948 times), and from November 2016 to February 2017 as test samples (a total of 922 times), statistical methods were used to establish the scoring standards. And each relevant element was scored. After the score, the score level range was delineated, and the visibility forecast was performed according to the scope. The conclusions are as follows: 1) Euro-pean fine grid forecast products are with good correspondence with the visi-bility of this field are 850 hPa and 2 m high temperature inversion, 850 hPa relative humidity and 850 hPa wind field over the field. 2) Through the statis-tical analysis of scores, it is defined that the score below 400 is level 4, the score above 1000 is level 1, the difference is significant, and the forecast indi-cation is strong. Level 2 and level 3 are more evenly distributed, with no more concentrated fractions. 3) Applying the test sample to test the above indica-tors. The forecast accuracy of level 1 is 61.2%, and the forecast accuracy of level 4 is 97.2%, so level 1 and level 4 are expected to obtain better forecast results, which is of practical application value.
Keywords
Airport Freezing Fog, Forecast Product Release, Classification Prediction
1. Introduction
With the rapid development of China’s aviation industry, large-scale delays in
How to cite this paper: Yang, H.R., Wang, N., Qin, Y.L. and Fan, D.W. (2018) Inter-pretation of EC Fine Grid Numerical Pre-diction Products in the Forecast of Frozen Fog in Urumqi Airport. Journal of Geos-cience and Environment Protection, 6, 100-110.
https://doi.org/10.4236/gep.2018.69008
Received: July 11, 2018 Accepted: September 7, 2018 Published: September 10, 2018
Copyright © 2018 by authors and Scientific Research Publishing Inc. This work is licensed under the Creative Commons Attribution International License (CC BY 4.0).
DOI: 10.4236/gep.2018.69008 101 Journal of Geoscience and Environment Protection flights due to weather, air traffic control, airport security and passengers’ own reasons are not uncommon. According to the Civil Aviation Administration’s 2012 Civil Aviation Industry Development Statistics Bulletin [1], the normal rate of national flights for the year was only 74.8%, of which 21.6% were due to bad weather. For Urumqi Airport, the cancellation of flight delay caused by low-visibility weather is more than the majority of all weather factors, especially the low-visibility weather caused by fog.
The forecasting methods for frozen fog are more diverse with the level of science and technology. In recent years, the level of numerical weather predic-tion at home and abroad has been continuously improved. In this environment, the number of numerical prediction products is increasing, and the precision of products is also increasing. More and more products have been used by a large number of meteorological business researchers and related departments, espe-cially civil aviation meteorology, mostly concentrated in the research of numeri-cal simulation analysis and parameterization scheme [2] [3] [4]. In this context, there are many numerical products that are constantly being produced, which have achieved good results in the weather forecasting business.
For the study of frozen fog at Urumqi Airport, Zhu Lei [5] analyzed the sea-sonal and interannual variations of frozen fog. It is proposed that the weather phenomenon causing low visibility of Urumqi Airport is foggy, smoke, and sand, and most of the low visibility is caused by freezing fog. Wang Nan and Yang Hongru [6] [7] analyzed the non-uniformity characteristics and the classi-fication of frozen fog circulation in the fog season of Urumqi Airport, which provided a basis for forecasting the freezing fog weather. The research on airport fog has focused on the statistics of circulation types and the distribution charac-teristics of fog scales, and has achieved great results, providing reference for air-port fog forecasting and on-time safe operation of flights. However, research on the application of numerical forecast product pairs for airport fog is still blank. In addition, with the global climate change, Urumqi airport fog performance in addition to different characteristics, changes in the law of production and elimi-nation make the fog forecast more difficult to grasp. Therefore, the use of low-time-space density numerical forecasting products in the interpretation of heavy fog forecasting is far from meeting the rapid development of weather fo-recasting services.
At the same time, there is no numerical model at home and abroad that can directly output the forecast products of fog, which shows the complexity of visi-bility forecasting and the difficulty of improving the accuracy of forecasting. Therefore, it is extremely important to apply numerical prediction products with high spatial and temporal resolution to strengthen the research on the interpre-tation of fog prediction [8].
DOI: 10.4236/gep.2018.69008 102 Journal of Geoscience and Environment Protection the accuracy of forecasting, and provide reference for the actual forecasting work.
2. Materials and Methods
2.1. Data
In this paper, Urumqi Airport time-lapse ground man-made observation data from November 2015 to February 2017, European fine grid (0.25 × 0.25) initial field (20 o’clock) and the forecast field within 24 hours were utilized. The rele-vant data from November 2015 to February 2016 was used as a sample of re-search (a total of 948 times), and from November 2016 to February 2017 as a test sample (a total of 922 times).
2.2. Methods
The appearance of the frozen fog requires a static and stable structure. The static and stable structure combined with the physical quantity shows the high altitude situation without obvious temperature advection, the ground form with poor air pressure, the inversion temperature, and the humidity near the ground. There-fore, this paper selects 7 physical quantities with close visibility and physical meaning, 500 hpa height field/temperature field, 850 hPa relative humidity, 850 hpa wind field, 850 hpa temperature, T2m temperature, mean sea level pressure. (Note: 2 m relative humidity is highly concentrated in the total time between 70 - 95, there is almost no difference between the visibility of each level, so the physical quantity is not considered in this paper). Urumqi Diwopu International Airport (hereinafter referred to as the airport), the coordinates of the center point of the runway are 43˚54'23''N, 87˚28'28''E. In this paper, (44˚N, 87.5˚E) is used as the data of the airport to extract and determine the indicators of differ-ent visibility weather occurrence.
The generation of freezing fog is a very complicated process, and there is no exact relationship between it and each physical quantity. It is the embodiment of the final effect after the interaction of multiple physical quantities with the law of the airport itself and the upstream and downstream effects. Therefore, this paper divides the visibility of the field into four levels for research and forecasting, and in order to distinguish between level 1 and level 4, the basic scores of the above two are significantly different. See Table 1 for details.
3. Physical Quantity Field Analysis and Evaluation Score
3.1. Relationship between Visibility and 500 hpa Circulation and
Sea Level Pressure Field
DOI: 10.4236/gep.2018.69008 103 Journal of Geoscience and Environment Protection
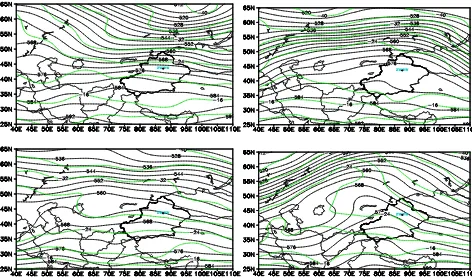
Figure 1. 500 hpa circulation form of frozen fog.
Table 1. Division of visibility levels.
Levels Visibility Range Base Score Influence Level
4 >3000 m 0 Can Flight
3 1000 - 3000 m 40 Monitoring Phase 2 500 - 1000 m 100 Monitoring Phase
1 ≤500 m 500 Not Flight
These figures are derived from the European fine grid (0.25 * 0.25) initial field (20 o’clock) and the forecast field within 24 hours. According to experience, the ground form is divided into the bottom of the high-pressure periphery or the bottom of the bottom, the belt-shaped high-pressure type, the transition zone of the north high and the low south, and the east-high west low-type is the form of the pressure field of the fog, as shown in Figure 2.
[image:4.595.210.539.397.468.2]DOI: 10.4236/gep.2018.69008 104 Journal of Geoscience and Environment Protection
Figure 2. Mean sea level pressure field in the form of freezing fog.
3.2. Relationship between Visibility and Inversion
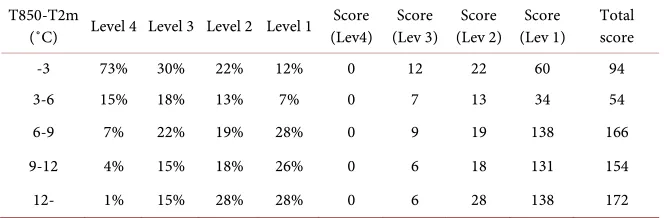
Combined with the existing conclusions [10], the visibility of the field has a good correspondence with the inversion of the T850 and the ground. Therefore, the T850 hpa-T2m is used to characterize the inversion of the sky over the field. The analysis results are as follows.
It can be seen that the visibility of the 2nd and 1st levels is mainly concen-trated above 6 degrees (Figure 3). With the increase of the inversion tempera-ture, the weather of the 4th grade rapidly decreases. The level 3 weather is exces-sive weather, and the inversion temperature is mainly concentrated at 6 - 12 de-grees. The calculation method of the score is given in Table 1. The specific dis-tribution is shown in Table 2.
3.3. Relationship between Visibility and Relative Humidity of
850 hpa
DOI: 10.4236/gep.2018.69008 105 Journal of Geoscience and Environment Protection
[image:6.595.212.538.72.246.2]Figure 3. Inverse temperature conditions corresponding to different levels of freezing fog.
Table 2. Distribution of visibility and inversion at different levels.
T850-T2m
(˚C) Level 4 Level 3 Level 2 Level 1 Score (Lev4) (Lev 3) Score (Lev 2) Score (Lev 1) Score Total score -3 73% 30% 22% 12% 0 12 22 60 94 3-6 15% 18% 13% 7% 0 7 13 34 54 6-9 7% 22% 19% 28% 0 9 19 138 166 9-12 4% 15% 18% 26% 0 6 18 131 154 12- 1% 15% 28% 28% 0 6 28 138 172
wind field of 850 hpa.
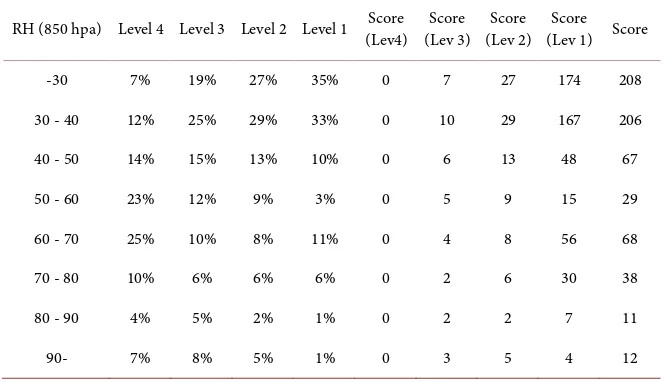
It can be seen from Figure 4 that the low-visibility weather corresponds to the dry layer development of 850 hpa, but the 40% - 50% relative humidity period is the over-visible stage, and visibility weather of all levels may occur (Table 3).
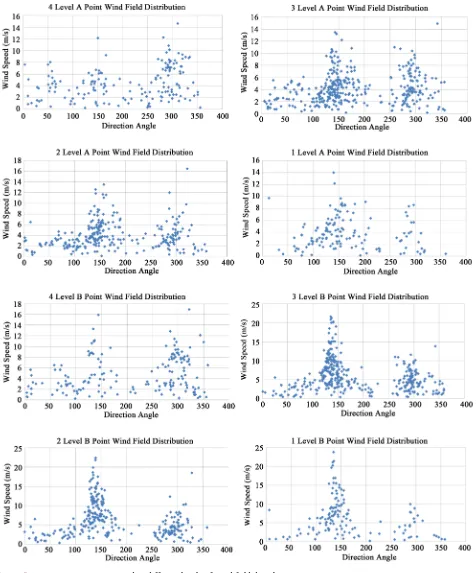
3.4. Relationship between Visibility and 850 hpa Wind Field
A synthetic analysis of the continuous freezing fog weather shows that the wind speed of A (44, 87.5) and B (44, 87.25) can better characterize the weather sys-tem affecting Urumqi Airport. Advancement of the southeast wind layer to the A-B point has an effect on the sky. The disturbance is sensitive at the B-A point when entering the disturbance, and there is a clear northwesterly flow response. Therefore, the paper takes A (44, 87.5), B (44, 87.25) two points for different le-vels of visibility, the performance of each wind field is as follows. [image:6.595.209.541.312.421.2]DOI: 10.4236/gep.2018.69008 106 Journal of Geoscience and Environment Protection
Figure 4. 850 hpa humidity corresponding to different levels of visibility weather.
Table 3. Distribution of visibility and relative humidity at different levels.
RH (850 hpa) Level 4 Level 3 Level 2 Level 1 Score (Lev4) (Lev 3) Score (Lev 2) Score (Lev 1) Score Score
-30 7% 19% 27% 35% 0 7 27 174 208
30 - 40 12% 25% 29% 33% 0 10 29 167 206
40 - 50 14% 15% 13% 10% 0 6 13 48 67
50 - 60 23% 12% 9% 3% 0 5 9 15 29
60 - 70 25% 10% 8% 11% 0 4 8 56 68
70 - 80 10% 6% 6% 6% 0 2 6 30 38
80 - 90 4% 5% 2% 1% 0 2 2 7 11
90- 7% 8% 5% 1% 0 3 5 4 12
frequency and wind speed of the southeast wind increase. This feature is also manifested at point B. For point A, the northwesterly wind frequency and wind speed converge faster at point B, and the northwesterly and southeast winds of grades 3, 2 and 1 show greater differences. This is good for the division of visi-bility.
[image:7.595.208.541.299.490.2]DOI: 10.4236/gep.2018.69008 107 Journal of Geoscience and Environment Protection wind speed, the southeast wind speed (5, 10] interval, the score is multiplied by 2, (10, 15] interval, and the score is multiplied by 3 on the original basis. The analogy (20, ∞) interval score is multiplied by 5 on the original basis. The spe-cific demarcation scores are as follows.
Wind Direction of Point A
Wind
Speed Lev 4 Lev3 Lev 2 Lev 1 (Lev 4) Score (Lev 3) Score (Lev 2) Score (Lev 1) Score Score
100 - 200 00 - 05 18% 34% 30% 37% 0 13.5 30.4 185 228.9
100 - 200 05 - 10 7% 17% 18% 19% 0 6.6 17.9 190 214.5
100 - 200 10 - 15 1% 2% 2% 1% 0 0.9 2.2 15 18.1
100 - 200 15 - 20 0% 0% 0% 0% 0 0 0 0 0
100 - 200 20- 0% 0% 0% 0% 0 0 0 0 0
250 - 350 00 - 05 21% 18% 21% 13% 0 7.4 20.9 63.4 91.7
250 - 350 05 - 10 22% 11% 7% 4% 0 4.3 6.6 22.4 33.3
250 - 350 10 - 15 2% 1% 0% 0% 0 0.4 0.4 0 0.8
250 - 350 15 - 20 0% 0% 0% 0% 0 0 0.4 0 0.4
250 - 350 20- 0% 0% 0% 0% 0 0 0 0 0
Wind Direction of Point B
Wind
Speed Lev 4 Lev3 Lev 2 Lev 1 (Lev4) Score (Lev 3) Score (Lev 2) Score (Lev 1) Score Score
100 - 200 00 - 05 15% 17% 11% 19% 0 6.7 11.4 95 113.1
100 - 200 05 - 10 7% 25% 23% 30% 0 9.9 23.1 300 333
100 - 200 10 - 15 3% 9% 15% 10% 0 3.4 15.0 150 168.4
100 - 200 15 - 20 1% 2% 3% 5% 0 1.0 3.3 100 104.3
100 - 200 20 - 0% 1% 1% 3% 0 0.5 0.7 75 76.2
250 - 350 00 - 05 22% 18% 23% 11% 0 7.3 22.7 56 86
250 - 350 05 - 10 22% 11% 7% 6% 0 4.5 7.0 29.9 41.4
250 - 350 10 - 15 4% 1% 1% 0% 0 0.5 1.1 0 1.6
250 - 350 15 - 20 1% 0% 0% 0% 0 0.0 0.4 0 0.4
250 - 350 20- 0% 0% 0% 0% 0 0.0 0.0 0 0
DOI: 10.4236/gep.2018.69008 108 Journal of Geoscience and Environment Protection
Figure 5. 8AB two points correspond to different levels of wind field distribution.
4. Visibility Level
DOI: 10.4236/gep.2018.69008 109 Journal of Geoscience and Environment Protection It can be seen that 84.2% level 4 is concentrated below 400 points, followed by a significant downward trend. Level 1 is the opposite, 63% is concentrated above 1000 points, and each level is less distributed at 600 - 1000 points. According to Figure 6, the level 2 level 3 resolution is not good, but level 1 and level 4 have significant differences. This has a good indication of daily work. Level 1 corres-ponds to a visibility of less than 500 meters, which does not meet the flight oper-ating standards, and in most cases, the corresponding RVR is also below the op-erating standard. The visibility corresponding to level 4 is greater than 3000 me-ters. Above the operating standard, the aircraft can operate normally. Therefore, the definition score ≤ 400 is judged as level 4, ≥1000 points is judged as level 1, and the remaining scores are level 2 and level 3. The above two levels are not differentiated because they are all above the operational standards and most of the time does not affect the operation, but it is still closely monitored.
5. Inspection Result
Apply the data from December 2016 to February 2017 for the test and calculate according to the above method. Here we only check the forecast accuracy of lev-el 1 and levlev-el 4. The accuracy rate of levlev-el 1 is 61.2%, and that of levlev-el 2 is 68.2%, which has certain indication significance in actual work; and the accuracy rate of level 4 is 97.2%, and the forecast is good.
6. Conclusions
1) It is feasible to use the European fine mesh 500 hpa height field/temperature field, 850 hpa relative humidity, 850 hpa wind field, 850 hpa temperature, T2m temperature, average sea level pressure and other physical quantities to test the visibility of the field, and it has certain warning effect.
[image:10.595.212.537.514.699.2]2) The forecast of fog needs to be combined with the advancement and the correction. The method of this paper can predict the fog. The prediction of
DOI: 10.4236/gep.2018.69008 110 Journal of Geoscience and Environment Protection visibility is based on the upstream and downstream effects, the wind profile and the performance of the surface wind field humidity.
3) The accuracy of this method for fog forecasting below 500 meters is 61.2%, and the accuracy of fog forecasting above 3000 meters is 97.2%. The conclusion is good and it has guiding significance for actual forecasting.
Conflicts of Interest
The authors declare no conflicts of interest regarding the publication of this pa-per.
References
[1] Civil Aviation Administration of China (2013) 2012 Civil Aviation Industry Devel-opment Statistics Bulletin.
[2] Liang, A.M., Zhang, Q.H., Shen, H.X., Liu, K.Y., Li, X.L. and Feng, J.B. (2009) Analysis and Numerical Simulation of an Advection Fog Process in Beijing Area. Applied Meteorological Journal, 20, 612-621.
[3] Lin, Y., Wang, M.S. and Lin, L.G. (2013) Numerical Simulation of Winter Mist and Parameterization of Visibility in Sichuan Province. Journal of NUIST (Natural Science Edition), 5, 222-228.
[4] Lai, X.F. (2010) Numerical Simulation Analysis of an Advection Fog in Shanghai Pudong Airport. Zhejiang Meteorological Society, Shanghai Meteorological Society, Jiangsu Meteorological Society, The 7th Yangtze River Delta Meteorological Science and Technology Forum Proceedings, 7.
[5] Zhu, L. (1999) Low-Visibility Weather and Climate Characteristics of Urumqi Air-port. Hubei Weather, 4, 8-10.
[6] Wang, N., Yang, H.R. and Liang, Y. (2015) Analysis of the Characteristics of Fog Heterogeneity in Urumqi Airport in the Past 37 Years. Desert and Oasis Weather, 4, 43-49.
[7] Yang, H.R., Wang, N. and Li, X. (2014) The Characteristics of the Fog in Urumqi Airport in Recent 36 Years and the Classification of Weather Conditions. The 31st China Meteorological Society Annual Meeting S10, The 4th Meteorological Service Development Forum to Improve the Level of Hydrometeorological Disaster Preven-tion and MitigaPreven-tion, and Promote the Social Development of Meteorological Ser-vices, Public Meteorological Services Committee, Hydrometeorological Committee, Public Weather Service Center of China Meteorological Administration, Hydrology Bureau of Ministry of Water Resources, 15.
[8] Wei, T.T., Zheng, L. and Gong, X.W. (2015) An Objective Forecasting Method for Significant Precipitation Based on T639 Physical Quantity Products. Meteorological Disaster Prevention, 22, 18-21.
[9] Wang, N., Zhu, L., Yang, H., et al. (2017) Classification of Synoptic Circulation Pat-terns for Fog in the Urumqi Airport. Atmospheric & Climate Sciences, 7, 352-366.
https://doi.org/10.4236/acs.2017.73026