ENVIRONMENTAL COMFORTNESS VALUES AMONGST INHABITANT IN
BANDAR LAMPUNG, INDONESIA
1,*
Novelina Tampubolon,
1
Graduate School of Bogor Agricultural University, Dramaga Highway, Dramaga Campus IPB, Bogor 16680,
2
Forest Resource Conservation and Ecotourism, Faculty of Forestry, Bogor Agricultural University, Academic
Lingkar Road, Dramaga IPB Campus, Bogor 16680, I
ARTICLE INFO ABSTRACT
The high cost of global climate mitigation and amelioration, which has now reached a temperature rise of 1.1
raise funds for community participation needs to be systematized. Related to the unique characteristic of Bandar Lampung as a valley area of Bukit Barisan Mountainous Strips of Sumatera Island, thus the Bandar Lampung City has been choosen as an important area to conduct this study that aim to: 1) analyzing people's perception on climate change; 2) analyzing the value of Temperature Humidity Index (THI); and 3) analyzing the Willingness To Pay (WTP) to improv
environment. The data were collected using a closed ended questionnaire designed with One Score One Criteria Scoring System (Avenzora, 2008), followed by Kruskal Wallis and Dunn Test, and multiple linear regression analysis. The result
City have perceived significantly the increase of temperature and humidity, which is caused by the increase of population, vehicle emission, land conversion and decrease of RTH (Green Open Space) as the
27, which means included in the uncomfortable qualification. In terms of community WTP value, the study results indicate that there is a community's ability to co
IDR/household/month; so that the estimated potential of community participation of Bandar Lampung City can be stated as 4.018.034.720 IDR per year. If correlated with the population in 416 districts and 98 cities in
to be self
Copyright © 2018, Novelina Tampubolon et al. This
unrestricted use, distribution, and reproduction in any medium,
INTRODUCTION
Globally, climate change is one of the important issues to be addressed from local, regional, national and transnational scales. Increasing the average temperature that became one of the variables of climate change not only adversely affect various aspects of the environment and economic aspects of various nations, but also directly affects the quality of daily human life. Hadad (2010) states that the industrial revolution in Britain has made the earth's temperature rise in 1950 by 0.74oC, so it is feared in 100 years later
temperature will rise 5oC. For now, November 2016 the earth's temperature has increased by 1.1oC (WMO, 2016). The research of Las et al. (2011) also shows that the average condition of temperature in Indonesia from 1968 to 2007
*Corresponding author: Novelina Tampubolon,
Graduate School of Bogor Agricultural University, Dramaga Highway, Dramaga Campus IPB, Bogor 16680, Indonesia.
ISSN: 0975-833X
International
Vol.
Article History:
Received 17th November, 2017
Received in revised form
29th December, 2017
Accepted 06th January, 2018
Published online 28th February, 2018
Citation: Novelina Tampubolon, Ricky Avenzora and Rachmad Hermawan
bandar lampung, indonesia”, International Journal of Current Research
Key words:
Climate Amelioration,
Community Participation Fund, One Score
One Criteria ScoringSystem,
Temperature Humidity Index (THI).
RESEARCH ARTICLE
ENVIRONMENTAL COMFORTNESS VALUES AMONGST INHABITANT IN
BANDAR LAMPUNG, INDONESIA
Novelina Tampubolon,
2Ricky Avenzora and
2Rachmad Hermawan
School of Bogor Agricultural University, Dramaga Highway, Dramaga Campus IPB, Bogor 16680,
Indonesia
Forest Resource Conservation and Ecotourism, Faculty of Forestry, Bogor Agricultural University, Academic
Lingkar Road, Dramaga IPB Campus, Bogor 16680, Indonesia
ABSTRACT
The high cost of global climate mitigation and amelioration, which has now reached a temperature rise of 1.1o Celcius, never can be fully funded by developing countries in many cases, so an effort to raise funds for community participation needs to be systematized. Related to the unique characteristic of Bandar Lampung as a valley area of Bukit Barisan Mountainous Strips of Sumatera Island, thus the ar Lampung City has been choosen as an important area to conduct this study that aim to: 1) analyzing people's perception on climate change; 2) analyzing the value of Temperature Humidity Index (THI); and 3) analyzing the Willingness To Pay (WTP) to improv
environment. The data were collected using a closed ended questionnaire designed with One Score One Criteria Scoring System (Avenzora, 2008), followed by Kruskal Wallis and Dunn Test, and multiple linear regression analysis. The results of the study show that the people of Bandar Lampung City have perceived significantly the increase of temperature and humidity, which is caused by the increase of population, vehicle emission, land conversion and decrease of RTH (Green Open Space) main causal factors. This perception is supported by the study of the THI value of more than 27, which means included in the uncomfortable qualification. In terms of community WTP value, the study results indicate that there is a community's ability to contribute with an average value of 15.620 IDR/household/month; so that the estimated potential of community participation of Bandar Lampung City can be stated as 4.018.034.720 IDR per year. If correlated with the population in 416 districts and 98 cities in Indonesia, then the estimated potential of Indonesian urban community participation to be self-sufficient in overcoming the global climate is 22.626.269.846.080 IDR per year.
This is an open access article distributed under the Creative Commons medium, provided the original work is properly cited.
change is one of the important issues to be addressed from local, regional, national and transnational scales. Increasing the average temperature that became one of the variables of climate change not only adversely affect nt and economic aspects of various nations, but also directly affects the quality of daily human life. Hadad (2010) states that the industrial revolution in Britain has made the earth's temperature rise in 1950 by C, so it is feared in 100 years later that the earth C. For now, November 2016 the earth's C (WMO, 2016). The (2011) also shows that the average condition of temperature in Indonesia from 1968 to 2007
Novelina Tampubolon,
Graduate School of Bogor Agricultural University, Dramaga Highway, Dramaga Campus IPB, Bogor 16680, Indonesia.
continues to increase; where within 70 years since 1940 the average temperature at ground level increased by
also supported by the statement of Firman (2009) that the air condition in Indonesia becomes hotter throughout the twentieth century, where the average annual temperature has increased by approximately 0.3oC. Furthermore, the serious effects change can also be seen from WHO data (2003) which shows that in 2000 there were about 150.000 deaths caused by climate change. Public participation in financing climate improvement is important to overcome the limitations of government funds, especially in developing countries. In Indonesia, the Ministry of Finance (2016) data shows that Indonesian budget for climate improvement is only 857.1 million IDR; the fund is relatively small when compared with the budget of tourism promotion abroad that reached trillion IDR. Community participation becomes one of the solution options in facing the challenge of climate improvement.
International Journal of Current Research
Vol. 10, Issue, 02, pp.65371-65378, February, 2018
Novelina Tampubolon, Ricky Avenzora and Rachmad Hermawan, 2018. “Environmental comfortness values amongst inhabitant in
International Journal of Current Research, 10, (02), 65371-65378.
ENVIRONMENTAL COMFORTNESS VALUES AMONGST INHABITANT IN
VALLEY
CITY
Rachmad Hermawan
School of Bogor Agricultural University, Dramaga Highway, Dramaga Campus IPB, Bogor 16680,
Forest Resource Conservation and Ecotourism, Faculty of Forestry, Bogor Agricultural University, Academic
ndonesia
The high cost of global climate mitigation and amelioration, which has now reached a temperature eloping countries in many cases, so an effort to raise funds for community participation needs to be systematized. Related to the unique characteristic of Bandar Lampung as a valley area of Bukit Barisan Mountainous Strips of Sumatera Island, thus the ar Lampung City has been choosen as an important area to conduct this study that aim to: 1) analyzing people's perception on climate change; 2) analyzing the value of Temperature Humidity Index (THI); and 3) analyzing the Willingness To Pay (WTP) to improve the quality of the environment. The data were collected using a closed ended questionnaire designed with One Score One Criteria Scoring System (Avenzora, 2008), followed by Kruskal Wallis and Dunn Test, and s of the study show that the people of Bandar Lampung City have perceived significantly the increase of temperature and humidity, which is caused by the increase of population, vehicle emission, land conversion and decrease of RTH (Green Open Space) main causal factors. This perception is supported by the study of the THI value of more than 27, which means included in the uncomfortable qualification. In terms of community WTP value, the ntribute with an average value of 15.620 IDR/household/month; so that the estimated potential of community participation of Bandar Lampung City can be stated as 4.018.034.720 IDR per year. If correlated with the population in 416 districts Indonesia, then the estimated potential of Indonesian urban community participation sufficient in overcoming the global climate is 22.626.269.846.080 IDR per year.
Commons Attribution License, which permits
continues to increase; where within 70 years since 1940 the average temperature at ground level increased by 0.5oC. It is also supported by the statement of Firman (2009) that the air condition in Indonesia becomes hotter throughout the twentieth century, where the average annual temperature has increased C. Furthermore, the serious effects of from WHO data (2003) which shows that in 2000 there were about 150.000 deaths caused by Public participation in financing climate improvement is important to overcome the limitations of y in developing countries. In Indonesia, the Ministry of Finance (2016) data shows that Indonesian budget for climate improvement is only 857.1 million IDR; the fund is relatively small when compared with the budget of tourism promotion abroad that reached 2.95 Community participation becomes one of the solution options in facing the challenge of climate
INTERNATIONAL JOURNAL OF CURRENT RESEARCH
This is supported by the research of Saputra et al (2016) which shows that there is potential for community participation in improving the climate of Bogor City Rp 38.645.442.552 per year. Such community participation is more necessary and potential for elaboration on urban communities. Sangkertadi (2013) stated that the urban environment was the largest contributor to global warming. The high utilization of spatial layout and urban community activities that are not environmentally friendly result in reduced vegetation so that the long-wave radiation emission into the atmosphere is higher and finally the increase in the surface temperature of the city. According to Dhakal and Karen (2014), urban environments account for 67 to 76% of energy use and 71 to 76% of CO2
emissions. All this indicates that the urban environment has degraded the quality of the environment so that it can affect the quality of life of urban communities. In addition, the urban community income factor is three times greater than that of rural people (Wolff, 1980).
Bandar Lampung City is one of important valley city in Indonesia that deserves to be used as a study area for mitigation and climate amelioration through community participation. At least there are 3 important perspectives to take this city as study area so called geographical uniqueness, development dynamics, and fragile-hazardous potentials. In term of geographical characteristic, this city is located in the south part of Bukit Barisan Mountainous Strips (which longitudinally lengthwise along the Sumatra Island from the south to north). The city is surrounded by Mount of Betung, on western area with Mount of Dibalau and Mount of Batu Serampok on south-eastern part. Mount of Raja Basa on the north also affects the city characteristic with Mount of Kunyit on the south. Even though the hilly area (with the highest point area is 700 meters above sea level) is only around 40 % of the city, but those area is very determinant in making the regional climate of the whole city; as well as the function of hilly area for watershed, catchment and supply.
In term of development nomenclature, Bandar Lampung should be categorized as a small city with very progressive development stage. Any decrease of environmental quality of this area will not only affect the quality of life in the city, but also will threat the existence-sustainability of the city itself. Bappeda Bandar Lampung (2008) reported that Bandar Lampung City is included in flood prone areas and drought, the impact of extreme climate change. Furthermore, the ACCCRN (2011) study shows that Bandar Lampung City has changed the trend and variability of highly dynamic climate variables (temperature and rainfall) so it is expected to cause more extreme events in the future. The BPBD-Lampung (2017In addition, the lack of availability of green open space in the city of Bandar Lampung is also one important indication of the degradation of serious environmental quality in this city. In 2013 the green open space available in Bandar Lampung City is only 11.08% from 19.722 ha (Bandar Lampung City BPS, 2013). On the other hand, per capita income of Bandar Lampung City in the last five years has increased significantly, from 22.409.557 IDR in 2010 to 35.310.478 IDR or increasing by 57.57% in 2014 (Bandar Lampung BPS, 2015).
METHODS
Research purposes: There are three objectives of this research
namely 1) analyzing communityperception on climate change, 2) analyzing the value of THI (Temperature Humidity Index),
and 3) analyzing the willingness to pay (WTP) value of the community to participate in improving the quality of the environment and climate of Bandar Lampung City. Community perceptions show how far people are aware of and feel the impact of climate change as well as indicate the extent of community knowledge about the factors causing the decline of environmental comfort in Bandar Lampung. The THI value is intended to describe the environmental comfort status of Bandar Lampung City by measuring the temperature and humidity. Two things are useful to conclude whether the environment of Bandar Lampung City in the category of comfortable or uncomfortable based on community perceptions and direct measurement results in the field. Thus, the value of willingness to pay provided by the community will be a valid estimation to be elaborated into the environmental improvement fund of Bandar Lampung City as a form of local community participation.
Time, Location and Samples: The study was conducted from
July to November 2016 in three sub-districts in Bandar Lampung City, namely: Kedaton Sub-district (Sidodadi Village, Sukamenanti Baru Village, Panengahan Raya Village); Tanjung Karang Sub-District (Kelong Gotong Royong Village, Kelapa Tiga Village, Kelir Gintung Village); and Sukarame Sub-District (Korpri Raya Village, Korpri Jaya Village, Sukarame Baru Village). The determination of sub-districts was conducted purposively on the basis of the percentage of residential area representing three classes: low (16% to 35%), medium (36% to 54%) and high (55% to 74%) based on total land cover of Bandar Lampung , while the village was determined on the basis of three classes of population density in each sub-district namely: 1) Kedaton Sub-district with low density (15 people/km2 to 26 people/km2), medium density (27 people/km2 to 36 people/km2) and high density (37 people/km2 to people/km2), 2) Tanjung Karang Pusat Sub-district with low density (24 people/km2 to 40 people/km2), medium density (41 people/km2 to 52 people/km2), high density (53 people/km2 to 64 people/km2) and 3) Sukarame Sub-district with low density (3 people/km2 to 6 people/km2), medium density (6 people/km2 to 9 people/km2), high density (10 peolple/km2 to 13 people/km2). Respondents were determined by simple random sampling with the sample size set with the quota of 30 heads of household (household); so the total sample in this study was 270 household.
Community Perception Analysis
Micro-Climate Analysis: Analysis of THI value of Bandar Lampung City was done through actual micro-climate measurement (temperature and humidity) by using portable digital thermometer. In addition, temperature and humidity data from BMKG of Bandar Lampung City in 2007 to 2016 were also taken to see whether climate change exist or not; then compared with actual micro-climate data. This was done to determine the suitability of actual micro-climate data with weather data from BMKG. Actual micro-climate data analysis was performed per time measurement using Temperature Humidity Index (THI) formula (Niewolt and McGregor, 1998), as follows:
Valuation of Environmental Comfort Value: Decrease in
environmental comfort can be assessed economically through the community willingness to pay (WTP) to get a comfortable environment. Referring Yakin (1997) and Fauzi (2010), in this study, the measured willingness to pay is emphasized on the maximum amount that people are willing to pay to environmental goods/services for improved environmental conditions to be better than the previous situation. Assessment of environmental services and natural resources that do not have a market price is conducted by using the Stated Preference (SP) method. There are two approaches used in SP method so called Contingent Valuation Method (CVM) and Choice Experiment (CE). CVM is used to measure economic value through the question of willingness to pay from the community to improve the quality of the environment (Fauzi, 2014). The determination of the amount of WTP provided by the community was conducted using three approaches namely: 1) direct WTP, 2) indirect WTP and 3) efforts to do to get a comfortable enviroment (Choice Experiment).
Analysis of WTP: To analyze the value of willingness to pay
(WTP) of the community, in improving the environmental quality and climate of Bandar Lampung City, there are five important data taken namely 1) WTP, 2) education level, 3) income, 4) population category and 5) the long domicile. The five data were collected using a closed ended questionnaire. Measurements of the value of environmental comfort are conducted with three patterns, namely 1) respondents are given the freedom to declare the value of rupiah willing to be paid 2) the number of WTP given based on the respondent's opinion on the ability of the surrounding community with the minimum WTP range up to maximum of 1%, and 3) the value given based on the allocation of funds from substitute goods to a comfortable environment (Choice Experiment). The value of environmental comfort is obtained from the sum of the total WTP value divided by the number of respondents. Furthermore, multiple linear regression analysis is conducted to find out the factors that influence the value of WTP given by the community.
RESULTS AND DISCUSSION
Beside being a center of governmental, socio-political, educational and cultural activities, Bandar Lampung City is also a center of economic activity. Geographically Bandar Lampung City is located at 5020 ' to 5030' SL and 105028 'up to
105037' EL with a height of 0 to 700 meters above sea level. Bandar Lampung city has an area of 197.22 km2 consisting of 20 sub-districts and 126 villages with population of 979.289 people. BPS data of Bandar Lampung City (2016) shows that in the period of 5 years (2011 to 2015) there has been an increase in land use for settlements of 5.462.61 Ha, the use of land for the company of 96.99 Ha. In industrial land, there is an increase of 225.03 Ha, and land designated service activities of 536.75 ha. Along with rapid land use, Gross Domestic Regional Income of Bandar Lampung City also increased during the last five years by 14.28 trillion rupiah (Bandar Lampung BPS, 2016).
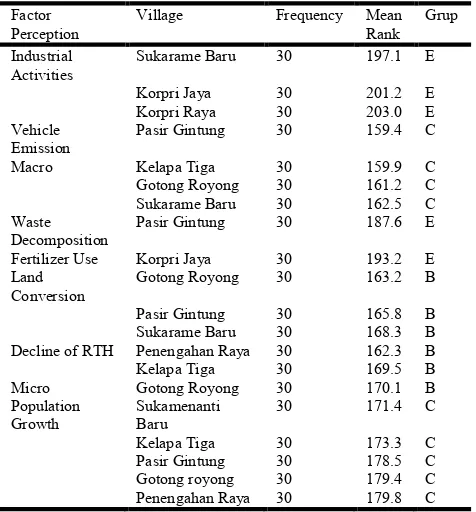
Community Perception of Climate Change: The results of
the study of perception, illustrated by mean rank values in Table 1, indicate that there are 7 perceptions that are significantly different between groups in terms of the causes of environmental degradation, namely: (1) industrial activity smoke, (2) increase of vehicle emissions, (3) waste decomposition, (4) the use of fertilizer, (5) land conversion, (6) decline of green open space and (7) population growth. Table 1 also shows that vehicle emissions (group C), land use change (group B), reduced green space (group B) and population growth (group C) are the main factors causing declining environmental quality of Bandar Lampung City. Yalcin and Yeteman (2009) suggest that urbanization affects groundwater temperatures, where urban groundwater temperatures are 3.5°C higher than rural groundwater temperature values. The results of the study Oliveira et al. (2011) also shows that urban expansion has an influence on micro-climate conditions and the deterioration of urban environmental conditions. Data BPLH DKI Jakarta (2013) indicates that 60 to 70% of urban air pollution source comes from vehicle exhaust gas. BPS data of Bandar Lampung (2016) shows that within the period of 5 years (2012 to 2016) there has been an increase in population of 112.365 people In addition.
Table 1. Public perception on the causes of environmental degradation
Factor Perception
Village Frequency Mean
Rank Grup
Industrial Activities
Sukarame Baru 30 197.1 E
Korpri Jaya 30 201.2 E
Korpri Raya 30 203.0 E
Vehicle Emission
Pasir Gintung 30 159.4 C
Macro Kelapa Tiga 30 159.9 C
Gotong Royong 30 161.2 C
Sukarame Baru 30 162.5 C
Waste Decomposition
Pasir Gintung 30 187.6 E
Fertilizer Use Korpri Jaya 30 193.2 E
Land Conversion
Gotong Royong 30 163.2 B
Pasir Gintung 30 165.8 B
Sukarame Baru 30 168.3 B
Decline of RTH Penengahan Raya 30 162.3 B
Kelapa Tiga 30 169.5 B
Micro Gotong Royong 30 170.1 B
Population Growth
Sukamenanti Baru
30 171.4 C
Kelapa Tiga 30 173.3 C
Pasir Gintung 30 178.5 C
Gotong royong 30 179.4 C
Penengahan Raya 30 179.8 C
[image:3.595.315.553.506.762.2]area of 368.58 Ha or 1.87% of the total area of Bandar Lampung City. Rapid population growth in urban areas is proportional to the increase in the number of vehicles. Data from BPS Bandar Lampung (2010) shows that within five years (2005 to 2010), vehicle growth reached 200%. In the year 2010 the number of two-wheeled vehicles reached 327.180 units and four wheels reached 99.498 units. The percentage of growth is expected to continue rising to 400 percent by 2015.
[image:4.595.308.558.248.406.2]Furthermore, the results of a study that illustrates the higher positive rank values compared to negative rank (Table 2) indicates that the people of Bandar Lampung City perceive the current temperature and humidity higher than the initial ones at the time of early living in the area. Brown and Gillespie (1995) suggest that the human body can measure the comfort of the environment by assessing the surrounding environment hot, cold or comfortable. Human comfort depends on factors that impact on skin temperature and perception of heat and cold. According to Purnomo (2000) the high temperature makes the evaporation process increase and high humidity will inhibit the evaporation process in the body, which causes an uncomfortable feeling characterized by the heart's trigger to pump blood faster.
Table 2. Result of wilcoxon test on Community perception toward climate change
N Mean
Rank
Sum of Rank Current
Temperature - Initial
Negative Ranks 0a .00 .00
Temperature Positive Ranks 268b 134.50 36046.00
Ties 2c
Total 270
Current Humidity -
Initial Negative Ranks 2
d 12.78 25.56
Humidity Positive Ranks 262e 141.48 37067.76
Ties 4f
Total 270
In the context of the importance of green space to improve environmental and climate quality, the study results also illustrate that 72.59% of respondents perceive the green space provide direct benefits for them to get fresh air. Potcher et al. (2006) states that a city with a tall canopy tree can reduce the temperature until 3.5°C and has a maximum cooling effect during the day. The results of Yu and Hien's research (2006) in Singapore parks also show that the temperature outside the park gradually increases as it moves away from the green area, proving that the park has a cooling effect. Gill et al. (2007) revealed that a 10% increase in green areas in Greater Manchester (in areas with no green cover) can produce cooling to 2.5°C. The study of Rahmawati (2014) also shows that green open space has a capability in micro-climate amelioration which is indicated by lower temperatures in vegetated lands than that in built lands. In addition, 84.44% of respondents also stated RTH indirectly provide benefits as an oxygen supplier for them. According Sumarmi (2010) tree as the lungs of the city is an oxygen producer that has not been replaced function. He explained that an area of 1.600 square meters with 16 trees with a diameter of 10 m can supply oxygen (O2) of 14.000 liters per person per hour, and one
hectare of green leaves can absorb 8 kg of CO2 equivalent with
CO 2 exhaled by the breath of 200 peoples at the same time.
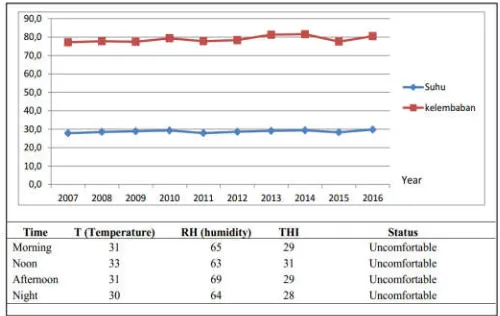
Micro-Climate: Data analysis related to the calculation of THI
value in nine villages indicates thatthe environment of Bandar Lampung City in the morning, noon, afternoon, and evening is considered to be uncomfortable, this is directly proportional to the community perception that there is now an increase in temperature and humidity. In addition, air temperature and humidity data from BMKG Bandar Lampung City in the last 10 years (2007 to 2016) also showed an increase in temperature and humidity of Bandar Lampung City (Figure 1). Lechner (2007) states that high humidity is a form of environmental conditions that is not comfortable for humans. Increasing humidity in the tropics leads to reducing human comfort. According to Sangkertadi (2013) in tropical and humid regions, relatively high temperature and humidity are the main causes of thermally uncomfortable situations for humans.
[image:4.595.34.291.372.498.2]Note: THI is primary data that calculated based on THI-formula.
Figure 1. Data of temperature and humidity of Bandar lampung City in period of 2007 to 2016
The value of temperature (Figure 1) shows that temperatures in the morning, noon, afternoon and evening above the ideal temperature/normal of humans, in contrast to the value of humidity in the morning, noon, afternoon and evening are still ideal for humans. According to Laurie (1986) the ideal climate for humans is temperature with a value of 27 to 28°C and a humidity value of 40 to 75%. Based on the classification of Setyowati and Sri (2010) the temperature of Bandar Lampung City is included in hot to very hot classification (29.1 to
≥31.1) and air humidity in dry classification (<70%). In this study, the THI value regression equation for Bandar Lampung city is obtained: - 1.490 + 0.843 T + 0.049 RH. Coefficient of positive value means the higher the value of temperature and humidity the higher the THI value. Nieuwolt and Mc Gregor (1998) stated that the comfort index in ideal conditions of tropical ideal is in the range THI 21 to 26. The increase in THI values indicates that the environment is increasingly uncomfortable. According to Lakitan (1994) the comfort of an area is strongly influenced by the local micro-climate because directly the climatic elements will be involved in existing human activity and metabolism.
Direct WTP: Analysis of data related to WTP shows that the
Table 3. Direct WTP at each village of Bandar Lampung City
Village Environmental Main Issue*) WTP/household/
Month (IDR)
Kelapa Tiga Population Growth 22.266
Pasir Gintung Population Growth 15.000
Gotong Royong Population Growth 19.180
Sidodadi Industrial Activity 12.381
Sukamenanti Baru Population Growth 14.500
Penengahan Raya Population Growth 15.300
Korpri Jaya Industrial Activity 16.520
Korpri Raya Fertilizer Use 15.400
Sukarame Baru Land Conversion 10.033
WTP of Bandar Lampung
15.620
Note: *) Refers to Table 1.
The results of the study in Table 3 above show that the densely populated environment with the settlement has an impact on the discomfort of the community, and the discomfort encourages them to motivate to provide higher WTP value than that of other village. According Darmawan and Saam (2010), several factors that affect WTP as an effort to improve the environment are knowledge, attitude, behavior, and community participation in the environment. Eriyati et al. (2010) in her research in Pekanbaru found that the great willingness to pay the environmental value of communities around the Siak River is significantly different according to the distance where people live with the river. The closer the distance of the community to the river is the greater the willingness to pay it, otherwise the farther the distance the residence by the river is the smaller the willingness of the community to pay. It reported that the average of WTP of head of family (household) living near the river is 29.817 IDR/household/month, living at medium distance of 22.571 IDR/household/month, and living far away from the river 12.130 IDR/household/month.
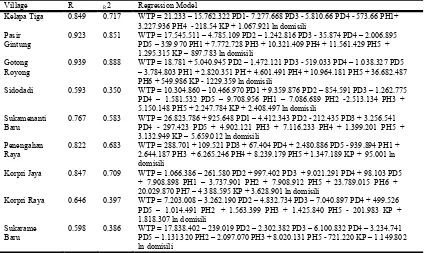
In terms of the WTP regression equation of each village, the data analysis in Table 4 describe the coefficient of determination (R-Square)> 0.15; this shows that the independent variables have a significant influence on the value of WTP, which can be said that the regression model in this study is good. Garrod and K. Willis (1999) stated that the R-Square value in the Contingent Valuation Method study for environmental services was at least 0.15 or 15%. Ghozali (2009) also stated that the greater value of R-Square was the better WTP model. In view of Table 4 above, it can be said that the explanatory variables affecting the WTP of respondents are income level, education level, population category and long domicile as a dummy variable. The value of earnings coefficient marked positive (+) means the higher income the greater the value of WTP given. The results of this study are in line with the study of Lestari et al. (2014) showing income levels affecting WTP in paying water fees for improving PDAM services. Category of people with positive sign (+) means that indigenous people will give higher WTP value than migrant people. This has a correlation with the old coefficient of domicile marked positive (+), the longer the people live the greater value of WTP. Riduwan (2009) states that if the value of R is closed to one, indicates a strong relationship between variables, whereas if it is positive, the variables will have a direct relationship; in the sense that an increase in the value of a single variable will coincide with an increase in other variables
Indirrect WTP: The results of the study in Table 5 indicate
that the indirect WTP value (ie respondents' perceptions of WTP capabilities of the people living around their residence) is 15.967 IDR/household/month; with the highest WTP value is in Kelapa Tiga Village 22.333 IDR/household/month, while the lowest is in Sukarame Baru Village for 10.667 IDR/household/month.
Table 4. R-Square Value and Regresi WTP Model of each village
Village R R2 Regression Model
Kelapa Tiga 0.849 0.717 WTP = 21.233 – 15.762.322 PD1- 7.277.668 PD3 - 5.810.66 PD4 - 573.66 PH1+
3.227.936 PH4 - 218.54 KP + 1.067.921 ln domisili
Pasir 0.923 0.851 WTP = 17.545.511 – 4.785.109 PD2 – 1.242.816 PD3 - 35.874 PD4 – 2.006.895
Gintung PD5 – 359.970 PH1 + 7.772.728 PH3 + 10.321.409 PH4 + 11.561.429 PH5 +
1.295.315 KP – 897.783 ln domisili
Gotong 0.939 0.888 WTP = 18.781 + 5.040.945 PD2 – 1.472.121 PD3 - 519.033 PD4 – 1.038.327 PD5
Royong – 3.784.803 PH1 + 2.820.351 PH + 4.601.491 PH4 + 10.964.181 PH5 + 36.682.487
PH6 + 549.986 KP - 1229.359 ln domisili
Sidodadi 0.593 0.350 WTP = 10.304.860 – 10.466.970 PD1 + 9.359.876 PD2 – 854.591 PD3 – 1.262.775
PD4 – 1.581.532 PD5 – 9.708.956 PH1 – 7.086.689 PH2 -2.513.134 PH3 + 5.150.148 PH5 + 2.247.784 KP + 2.408.497 ln domisili
Sukamenanti 0.767 0.583 WTP = 26.823.786 + 925.648 PD1 – 4.412.343 PD2 - 212.435 PD3 + 3.256.541
Baru PD4 - 297.423 PD5 + 4.902.121 PH3 + 7.116.233 PH4 + 1.399.201 PH5 +
3.132.949 KP – 5.659.012 ln domisili
Penengahan 0.822 0.683 WTP = 288.701 + 109.521 PD3 + 67.404 PD4 + 2.480.886 PD5 - 939.894 PH1 +
Raya 2.644.187 PH3 + 6.265.246 PH4 + 8.239.179 PH5 + 1.347.189 KP + 95.001 ln
domisili
Korpri Jaya 0.847 0.709 WTP = 1.066.386 – 261.580 PD2 + 997.402 PD3 + 9.021.291 PD4 + 98.103 PD5
+ 7.908.898 PH1 – 3.737.901 PH2 + 7.908.912 PH5 + 23.789.015 PH6 + 20.029.870 PH7 – 4.388.595 KP + 3.628.901 ln domisili
Korpri Raya 0.646 0.397 WTP = 7.203.008 – 3.262.190 PD2 – 4.832.734 PD3 – 7.040.897 PD4 + 499.526
PD5 – 1.014.491 PH2 + 1.563.399 PH3 + 1.425.840 PH5 - 201.983 KP + 1.818.307 ln domisili
Sukarame 0.598 0.386 WTP = 17.838.402 – 239.019 PD2 – 2.302.382 PD3 – 6.100.832 PD4 – 3.234.741
Baru PD5 – 1.131.320 PH2 – 2.097.070 PH3 + 8.020.131 PH5 - 721.220 KP – 1.149.802
ln domisili
Description:
[image:5.595.87.514.492.745.2]The difference of indirect WTP value with direct WTP is only 347 IDR/household/month, meaning that respondents tend to see other people's ability by equating the ability of respondents themselves in giving WTP. Saputra et al. (2016) in Bogor City with indirect WTP indicates that the highest WTP is in Kedung Waringin Village with 6.433 IDR/household/month, while the lowest WTP is in Kebon Pedes with 3.600 IDR/household/month.
Table 5. Indirect WTP in each village of Bandar Lampung City
Village WTP/household/Month (IDR)
Kelapa Tiga 22.333
Pasir Gintung 15.269
Gotong Royong 19.459
Sidodadi 12.650
Sukamenanti Baru 14.769
Penengahan Raya 15.569
Korpri Jaya 16.789
Korpri Raya 16.198
Sukarame Baru 10.667
WTP Bandar Lampung City 15.967
Respondent’s Effort Toward Comfortable Environment
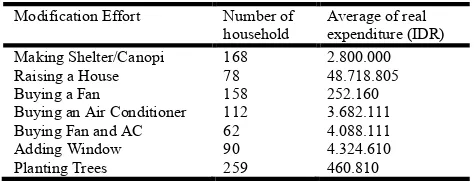
The various efforts that are actuallydone by the community in the research location in creating the comfort of the environment for their own family is can be interpreted as a choice experiment of WTP. In this context, the results of the study indicate that there are seven attempts that real people are doing in modifying the micro-climate for their households: 1) making shelter/canopy, 2) raising a house, 3) buying a fan, 4) buying air conditioners, 5) buying fans and air conditioners, 6) adding windows, and 7) planting trees. The real expenditure value of respondents in modifying the micro-climate for the comfort of their family climate can be seen in Table 6.
Table 6. Fund allocations from community efforts to modify micro-climate
Modification Effort Number of
household
Average of real expenditure (IDR)
Making Shelter/Canopi 168 2.800.000
Raising a House 78 48.718.805
Buying a Fan 158 252.160
Buying an Air Conditioner 112 3.682.111
Buying Fan and AC 62 4.088.111
Adding Window 90 4.324.610
Planting Trees 259 460.810
N = 270 respondents
Planting crops/trees became the most widely performed efforts by the people of Bandar Lampung City in modifying the microclimate to get a comfortable environment in their residence with an allocation of 460.810 IDR. Dahlan (2011) and Natalia (2013) stated that the tree can absorb an average heat of 3.192 KJ/hour, so planting three trees is equivalent to one unit of AC 1 PK (capacity 9.495 KJ/hour).
Research Wong et al. (2010) also shows vertical garden able to reduce the surface thermal temperature of the building wall by 11.58oC. Similarly, the results of research Widiastuti et al. (2014) stated that the surface temperature of the walls with vertical garden is lower 2.1oC when compared to the surface of the wall without vegetation. Similarly, Jim et al. (2011) states that roof garden capable of reducing the daily temperature in the tile surface of 5.2oC.
DISCUSSION
Taking note of the findings in this study as described in the previous section, there aretwo important issues of interest to be discussed, namely: 1) The potential magnitude of WTPs regionally and nationally, and 2). The strategy of realizing the potential of WTP to be actual as a community self-funding for global climate mitigation and amelioration. For example, if the potential WTP data described above is associated with data on the number of households in Bandar Lampung City (Lampung BPS. 2016), which are 234.838 households. The total number of WTPs potential in Bandar Lampung can be estimated at 3.668.169.560 IDR per month or 44.018.034.720 IDR per year. The idea of such estimation becomes feasible in line with Saputra et al.'s estimation (2016) which also shows that there is potential for community participation in Bogor City amounting to 3.220.453.546 IDR per month or 38.645.442.552 IDR per year. Furthermore, from the two studies (also Eriyati
et al. 2010), it is also possible to estimate nationally that in
Indonesia with 98 cities and 416 districts, there is a potential for self-funding for mitigation and global climate amelioration at least 19.863.757.471.728 IDR per year (pessimistic estimates approximated from the lowest WTP) up to 22.626.269.846.080 IDR per year (optimistic estimates approximated by the average WTP). In fact that number is just the amount of potential that is found in the household in urban and district areas, and it can become even larger if calculated in such a way as to include the potential that is found in the household in the sub-district and rural areas.
[image:6.595.44.281.494.585.2]Wardhana (2013) adds that the NGOs reap the three major criticisms namely 1) weak argumentation and less analytical. 2) double standards and conflict of interest. and 3) necessity of NGO code of conduct. The results of Praja's (2009) study indicate that the distortion of the role of NGOs in Grobogan District occurs due to several factors such as 1) the existence of profit-seeking motives, 2) the absence of funding sources and low professionalism, 3) the background of diverse activist professions and 4) the concept of ideology that is not clear as well as the regulation is too loose. The research results of Rabiali (2017) show that the pattern of action of environment NGOs in Indonesia is for the interests of foreign countries; and environment NGOs 1) rely heavily on foreign aid, 2) have foreign vision and mission for their activities, 3) are obedient and subject to the mechanisms and rules of foreign countries, 4) are lack of nationalism, and 5) become the threat of state sovereignity. Furthermore, it is important to realize that the large potential of WTP funds is much larger than the funds disbursed by the Climate and Land Use Alliance (2016) to various NGOs in Indonesia in the period 2014 to 2016 which only reached 44 million US dollars or 550 billion IDR only. The CLUA (Climate and Land Use Alliance) fund is actually only about 5% of the potential WTP-environment funds available to urban communities in Indonesia.
Conclusion
The result of the study related to the perception of the community shows that there are 7 perceptions that are significantly different among the groups in terms of the causes of environmental degradation namely: (1) industrial activity smoke, (2) the increase of vehicle emissions, (3) waste decomposition, (4) the use of fertilizer, (5) land conversion, (6) decline of green space, and (7) population growth. The Community has a perception that the current temperature and humidity of the air are higher than the initial ones indicated by the community in current stay are getting more sweat than that in initial stay. The decrease of environmental comfort of Bandar Lampung City was also shown through THI calculation that Kota Bandar Lampung was in the uncomfortable category with THI more than. This is supported by BMKG data of Bandar Lampung City which shows that temperature and humidity tends to increase within 10 years. The existence of an indication of the environmental discomfort of Bandar Lampung City encourages the community to wish to participate in improving the environmental quality through the community contribution (WTP) of 15.620/household/month; so that the estimated potential of community participation of Bandar Lampung City can be stated as 44.018.034.720 IDR per year. If correlated with the population in 416 districts and 98 cities in Indonesia, then the estimated potential of Indonesian urban community participation to be self-sufficient in overcoming the global climate is 22.626.269.846.080 IDR per year.
Suggestion: Further research needs to be conducted related to
building strategy and implementation model in actualizing potential-WTPs to become actual-WTPs.
REFERENCES
ACCCRN (Asian Cities Climate Change Resilience Network). 2011. Strategi Ketahanan Kota Bandar Lampung
terhadap Perubahan Iklim 2010-2030. Bandar
Lampung. Publikasi ACCCRN
Avenzora R. 2008. Ekoturisme Teori dan Praktek. Avenzora R. editor. Aceh (ID): BRR NAD-Nias.
Badan Pengelolaan Lingkungan Hidup Daerah Jakarta. 2013.
Zat-zat Pencemar Udara.
Bandung: Intermata.
BAPPEDA Bandar Lampung. 2008. Buku Putih Sanitasi Kota
Bandar Lampung.
BMKG Bandar Lampung. 2017. Data Suhu Kelembaban
Bulanan. dan Jumlah Curah Hujan Stasiun Meteorologi
Maritim Lampung Tahun 2007-2016. Bandar Lampung.
BPS Kota Bandar Lampung. 2013. Kota Bandar Lampung
dalam Angka Tahun 2013. BPS Kota Bandar Lampung.
Bandar Lampung
BPS Kota Bandar Lampung. 2015. Kota Bandar Lampung
dalam Angka Tahun 2015. BPS Kota Bandar Lampung.
Bandar Lampung
BPS Kota Bandar Lampung. 2016. Kota Bandar Lampung
dalam Angka Tahun 2016. BPS Kota Bandar Lampung.
Bandar Lampung
Brown RD. Gillespie TJ.1995. Microclimatic Landscape
Design: Creating Termal Comfort and Energy Efficiency.
New York (US): J Willey.
Climate and Land Use Alliance. 2016. Strategic Focus and
Priorities Indonesia Initiative 2013-2016.
www.climateandlandusealliance.org/wpcontent/iploads/201 6/08/Overview_Indonesia_S trategy_2016.pdf [accessed 2017 July 31].
Dahlan. 2011. Potensi hutan kota sebagai alternatif substitusi
fungsi alat pendingin ruangan (Air Conditioner) (studi
kasus di kampus IPB Darmaga). [skripsi]. Bogor (ID):
Institut PertanianBogor.
Darmawan B. Saam Z. 2010. Hubungan pengetahuan. sikap.
dan peran serta dengan kesadaranlingkungkan hidup serta
kesanggupan membayar masyarakat sekitar bantaran
sungai di Kota Pekanbaru. Jurnal of Environmental
Science.2(4): 103-116.
Dhakal S and Karen CS. 2014. Human Settlements.
Infrastructure. and Spatial Planning. Cambridge
University Press. Cambridge. United Kingdom and New York. NY. USA
Eriyati. Indrawati T. Jimmi A. 2010. Analisis valuasi ekonomi
lingkungan kesediaan masyarakat sekitar Sungai Siak.
Jurnal Ekonomi. 18 (1): 94-103.
Fauzi A. 2010. Ekonomi Source Daya Alam dan Lingkungan
Teori dan Aplikasi. Jakarta (ID): PT. Gramedia Pustaka
Utama.
Firman A. 2009. Mangrove dan Perubahan Iklim. Fakultas Perikanan dan kelautan. Bandung. Universitas padjadjaran. Garrod G and K.G Willis. 1999. Economics Valuation of the
Environment Methods and Case Studies. USA: Edward
Elgar Publishing Limited.
Ghozali I. 2009. Aplikasi Analisis Multivariate dengan
Program SPSS. Semarang. UNDIP
Gill SE. Handley JF. Ennos AR.Pauleit S. 2007. Adapting
cities for climate change: the role ofgreen infrastructure.
Built Environment 33 (1). 115–133.
Hadad I. 2010. Perubahan Iklim dan Pembangunan
Berkelanjutan: Sebuah Pengantar. Jurnal Prisma Vol 29:
3-22
Humid Summer in The Mediterranean City of Tel Aviv. Israel.
International Journal of Climatology. Volume 26. Issue 12.pages 1695–1711. October 2006
Jim CY. SW Tsang. Hongming He. 2011. Biophysical
properties and thermal performance of an intensive green
Lakitan B. 1994. Dasar-Dasar Klimatologi. Jakarta (ID): Raja Grafindo Persada
Las I. A. Pramudia. E. Runtunuwu. P. Setyanto. 2011.
Antisipasi Perubahan Iklim dalamMengamankan Produksi
Beras Nasional. Jurnal Pengembangan Inovasi Pertanian
4(1). 2011:76-86
Laurie M. 1986. Pengantar kepada Arsitektur
Pertamanan. Terbitan Kedua (Terjemahan).
Lechner N. 2007. Heating, Cooling, Lighting: Metode Desain untuk Arsitektur. Sandriana Siti,
Lestari S. Endang M. Kartini. 2014. Analisis Willingness To
Pay Masyarakat TerhadapPeningkatan Pelayanan PDAM
Di Jalan Danau Sentarum dan Sekitarnya. Jurnal Teknik.
Pontianak: Universitas Tanjungpura.
Makassary R.2009.AkuntabilitasLembagaSwadaya
Masyarakat: Beberapa Observasi. http://keuanganlsm.com/ beberapa-observasi-akuntabilitas-lembaga-swadaya-masyarakat/.[accessed 2017 July 22].
Ministry of Finance. 2016. Kementrian Keuangan Republik
Indonesia (Informasi APBN 2016). 25 Mei.
Kemenkeu.go.id/sites/default/files/bibfinal/pdf. [accessed 2017 July 18].
Natalia G. 2013. Potensi hutan kota sebagai alternatif
substitusi fungsi alat pendingin udara (AirConditioner) di
Kota Surabaya. [skripsi]. Bogor (ID): Institut Pertanian
Bogor.
Nieuwolt S. Mc.Gregor GR. 1998. Tropical Climatologi. an
Introduction to the Climates of the Low Latitude. New
York (US): John Wiley and Sons.
Oliveira S. Andrade H. Vaz T. 2011. The Cooling Effect of
Green Spaces as a Contibution to theMitigation of Urban
Heat: A Case Study in Lisbon. J Building and Environment
46:2186-2194 Potcher O. Pninit C. Arieh B. 2006. Climatic Behavior of various Urban Parks During Hot and Pemerintah Kota Bandar Lampung. 2012. Rencana
Pembangunan Jangka Menengah Daerah (RPJMD) Kota
Bandar Lampung Tahun 2012-2020. Bandar Lampung.
penerjemah. Jakarta (ID): PT. Raja Grafindo Persada. Terjemahan dari: Heating, Cooling, Lighting: Design Methods for Architects.
Penyelenggaraan Pelayanan Publik di Indonesia. http://www.accessindo.or.id/pub/131017%20Pentingnya% 20Peran%20dan%20Kontribusi%2 0Masyar akat%20Si pil %20Terhadap%20Peningkatan%20Penyelenggaraan%20Pe layanan%20 Publik%20di%20Indonesia.pdf . Downloaded 2017 August 8.
Praja AN. 2009. Distorsi Peran Lembaga Swadaya
Masyarakat Dalam Perspektif Civil Community Di
Kabupaten Grobongan. Semarang. Univesitas Diponegoro
Semarang.
Purnomo H. 2000. Pengaruh kelembaban. temperatur udara
dan beban kerja terhadap kondisi faal tubuh manusia.
Logika. 4(5): 35-47.
Rabiali ML. 2017. Efektifitas dan sustainabilitas kinerja LSM
dalam kegiatan penghijauan. Tesis. Institut Pertanian
Bogor. Bogor.
Rahmawati SN. 2014. Kemampuan Hutan Kota Dalam
Ameliorasi Iklim Mikro di Kampus IPBDarmaga. Skripsi.
Institut Pertanian Bogor. Bogor
Riduwan. 2009. Pengantar Statistika Sosial. Bandung: Alfabeta.
Rooney G. 2013. Pentingnya Peran dan Kontribusi Masyarakat Sipil terhadap Peningkatan
Sangkertadi. 2013. Kenyamanan Termis di Ruang Luar Beriklim Tropis Lembab. Bandung: Alfabeta
Saputra A. Ricky A. Dudung D. Rachmad H. 2016. Orientasi
Masyarakat Kota Bogor Terhadap Nilai Kenyamanan
Udara. Jurnal Penelitian Sosial dan Ekonomi Kehutanan
Vol. 13 No 3Desember 2016. Hal 177-187
Satriana N. 2015. Analisis Perubahan Penggunaan Lahan
RTH Publik Kota Bandar Lampung Tahun 2009-2015
[Jurnal]. Universitas Lampung. Lampung.
Setyowati DL. Sri M. 2010. Sebaran Ruang Terbuka Hijau
dan Peluang Perbaikan Iklim Mikro di Semarang Barat.
Biosaintifika Vol. 2 No. 2. September 2010. 61-74
Sumarmi. 2010. Upaya Peningkatan Partisipasi Masyarakat
dalam Pengelolaan Ruang Terbuka Hijau (RTH). Malang.
Universitas Negeri Malang.
Wardhana H. 2013. 3 Kritik Besar untuk LSM Indonesia. [Internet]. Tersedia pada: http://www.kompasiana.com/ wardhanahendra/3-kritik-besar-untuk-lsm-indonesia_ 55 2b2f98f17e61cf79d623e8. [downloaded 2017 August 08]. WHO. 2003. Climate change and human health: Risks and
responses. (online at: http:/ /www.euro.who.int/) (Accessed
April 2007)
Widiastuti R. Eddy P. Wahyu SB. 2014. “Kenyamanan termal
bangunan dengan vertical garden berdasarkan standard
kenyamana MOM dan WIESEBORN”. Riptek. 8 (1): 1-12
Wolff JH. 1980. Formal Indonesian. Cornell University Southeast Asia Program. Amerika Serikat Wong NH. Tan AYK. Chen Y. Sekar K. Tan PY. Chan D. Chiang K. 2010. Thermal evaluation of vertical greenery systems for
building walls. Journal Building and Environment. 45(3):
663-672
World Climate Conference. 1979. a conference of experts on
climate. Proceedings World Climate Conference 12-23
February 1979: Geneva
World Meteorological Organization. 2016. WMO confirms
2016 as hottest year on record. about 1.1 0C above pre
industrial era. Geneva-Switzerland: WMO
Yakin A. 1997. Ekonomi Source Daya dan Lingkungan:
Teori dan Kebijakan Pembangunan Berkelanjutan.
Jakarta: Akademika Presindo.