Western University Western University
Scholarship@Western
Scholarship@Western
Electronic Thesis and Dissertation Repository
7-27-2015 12:00 AM
Production Of Activated Carbons From Pyrolytic Char For
Production Of Activated Carbons From Pyrolytic Char For
Environmental Applications
Environmental Applications
Anastasia Colomba
The University of Western Ontario
Supervisor Dr. Franco Berruti
The University of Western Ontario Joint Supervisor Dr. Cedric Briens
The University of Western Ontario
Graduate Program in Chemical and Biochemical Engineering
A thesis submitted in partial fulfillment of the requirements for the degree in Doctor of Philosophy
© Anastasia Colomba 2015
Follow this and additional works at: https://ir.lib.uwo.ca/etd
Part of the Chemical Engineering Commons
Recommended Citation Recommended Citation
Colomba, Anastasia, "Production Of Activated Carbons From Pyrolytic Char For Environmental Applications" (2015). Electronic Thesis and Dissertation Repository. 2978.
https://ir.lib.uwo.ca/etd/2978
This Dissertation/Thesis is brought to you for free and open access by Scholarship@Western. It has been accepted for inclusion in Electronic Thesis and Dissertation Repository by an authorized administrator of
Production Of Activated Carbons From Pyrolytic Char For Environmental Applications
(Thesis format: Monograph)
by
Anastasia Colomba
Graduate Program in Engineering Science Department of Chemical and Biochemical Engineering
A thesis submitted in partial fulfillment of the requirements for the degree of
Doctor of Philosophy
The School of Graduate and Postdoctoral Studies The University of Western Ontario
London, Ontario, Canada
ii
Abstract
Biomass pyrolysis has the potential to become a major component of future biorefineries, since
biomass is cracked to produce gases, liquid products (bio-oil) and solid products (bio-char). In
order for the process to be economically feasible, it is necessary to obtain the maximum value from
each stream, thus no by-product can be regarded as a waste.
Bio-char is normally regarded as a by-product of fast pyrolysis, which is optimized to target
bio-oil production. However, there are many potentially attractive applications for it: for example, it
can be used for the production of activated carbons, which are the most commonly used adsorbent
materials.
In this study, a new reactor technology developed at ICFAR, the Jiggled Bed Reactor (JBR) is
employed as a fast and reliable tool for the optimization of the production of activated carbons
from biomass. Due to its excellent heating system, both slow and fast pyrolysis conditions can be
achieved, and activation can be carried out. The results obtained in the JBR show good comparison
with larger scale reactors, thus allowing the screening of new pyrolysis and activation conditions
as well as different feedstocks in a fast and reliable way.
The impact of the type of feedstock, activation and pyrolysis conditions (fast/slow) on the final
product characteristic and activation kinetics are studied.
Finally, the performance of activated carbons produced in the JBR as adsorbents is evaluated for
different environmental applications, such as the removal of ammonia and mercury from
wastewater and of naphthenic acids from Oil Sands Process-affected water (OSPW). In particular,
activated carbon produced from Kraft lignin is shown to outperform commercial activated carbon
for wastewater treatment applications.
Keywords
Activated carbons, biomass, Kraft lignin, pyrolysis, Jiggled Bed Reactor, bio-char, mercury,
iii
Acknowledgments
First, I would like to acknowledge for my supervisors, Dr. Franco Berruti and Dr. Cedric Briens.
Thank you for accepting me into your research group, always believing in me and pushing me to
do my best. Thank you for your time and support and for the good times while travelling together.
I would also like to acknowledge the people without whom this work would have not been
possible:
Students, Post-Docs and staff at ICFAR and in particular Valentina Lago, Liliana Pardo and
Carolina Morales, Dr. Roel Westerhof, Dr. Pietro Palmisano and Dr. Dongbing Li, Caitlin
Marshall, Rob Taylor and Karen McDonalds, for your help and for sharing this journey with me.
You all are part of the happiest memories of these years.
Ying Zhang from CBE for the help with the BET measurements.
Dr. Ajay Dalai, for inviting me to your lab at the University of Saskatchewan and sharing with me
your extensive experience. Thank you for your jokes and your contagious laughter.
Dr. Rambabu Nedunuri, for the time you dedicated to me during my stay at the University of
Saskatchewan. Thank you for your immense kindness and for cooking the best biryani for me.
My appreciation also goes to BioFuelNet Canada for the funding and for providing me with two
HQP Travel Awards to attend conferences and meetings and the Exchange Award to visit Dr.
Dalai’s lab in Saskatoon.
Finally, I would like to acknowledge my family and my friends for their unconditioned love and
support.
Last, but not least, Mitesh Chaudhari: the most special thanks is for you, for always being by my
side in both the tough and happy moments I experienced during the last years. Thank you for
pushing me to always see the good in life and never give up. Thank you for loving me. Your
iv
Dedication
v
Table of Contents
Abstract ... ii
Keywords ... ii
Acknowledgments... iii
Dedication ... iv
Table of Contents ... v
List of Tables ... x
List of Figures ... xii
Abbreviations, Symbols, Nomenclature ... xviii
Chapter 1 ... 1
1. Introduction ... 1
1.1 Motivation ... 1
1.2 What is Pyrolytic Bio-Char? ... 3
1.3 Possible Bio-Char Applications ... 3
1.4 Activated Carbons ... 7
Current and perspective market... 7
Feedstocks for the production of activated carbons ... 9
Production processes ... 9
1.5 Biomass Pyrolysis ... 12
The pyrolysis process ... 12
Reactors used for biomass pyrolysis ... 13
1.6 Context and Scope of this Thesis ... 15
1.7 Thesis Structure ... 17
Chapter 2 ... 19
2. Materials and Methodology ... 19
vi
2.2 Experimental Set Up: the Jiggled Bed Reactor (JBR) ... 22
2.3 Pyrolysis and Activation Procedures... 27
Batch pyrolysis experiments (with CO2 activation) ... 27
Fast pyrolysis experiments ... 28
Activation experiments with wet gases ... 29
Production of HNO3 treated activated carbons ... 29
Reproducibility ... 29
2.4 Experimental Set Up: the Bubbling Bed Reactor... 30
2.5 Sample Analyses ... 32
Proximate analysis... 32
Elemental Analysis ... 32
Surface area and pore volume ... 33
SEM ... 37
Thermo Gravimetric Analysis (TGA) of olive residue ... 37
Temperature programmed desorption (TPD) ... 37
Boehm titration ... 37
Particle size distribution ... 38
2.6 Adsorption Theory and Studies ... 38
Kinetic models... 38
Adsorption isotherms ... 40
2.7 Procedure for Adsorption Studies ... 41
2.8 Preparation of Solutions for Adsorption and Analytical Determination ... 42
Preparation of ammonia solutions and determination of ammonia concentration ... 42
Preparation of naphthenic acids solutions and determination of naphthenic acids concentration ... 43
Preparation of mercury solutions and determination of mercury concentration ... 45
vii
3. Application of the Jiggled Bed Reactor to the development of Effective Pyrolysis and
Activation Processes for the Production of Activated Carbons from Biomass ... 47
3.1 Introduction ... 47
3.2 Materials and Methods ... 48
3.3 Results and Discussion ... 48
3.3.1 Pyrolysis char yield ... 48
3.3.2 Impact of activation conditions ... 49
3.3.3 Activation kinetics... 55
3.3.4 Characterization of the porous structure ... 61
3.3.5 Possible integration of activation with the pyrolysis process ... 63
3.3.6 Impact of feedstock characteristics ... 66
3.4 Conclusions ... 72
Chapter 4 ... 75
4 Development of a Model for the Prediction of the Yield and Surface Area during Activated Carbons Production in the Jiggled Bed Reactor ... 75
4.1 Introduction ... 75
4.2 Model Assumptions... 77
4.3 Materials and Methods ... 79
4.4 Model Development and Validation ... 79
4.5 Using the Model for the Optimization of the Activation Process ... 87
4.6 Conclusions ... 89
Chapter 5 ... 95
5. Influence of Pyrolysis Conditions on the Production of Activated Carbons in a Jiggled Bed Reactor ... 95
Introduction ... 95
Materials and Methods ... 96
Results and Discussion ... 96
viii
Impact of heating rate and pyrolysis temperature on activated carbons properties ... 97
Impact of heating rate and pyrolysis temperature on the activation kinetics: application of the kinetic and physical models ... 103
Conclusions ... 110
Chapter 6 ... 112
6. Comparison of the Results Obtained in the JBR with a Pilot Scale Bubbling Bed Reactor and Impact of the Use of a Binder during the Production of Activated Carbons ... 112
Introduction ... 112
Materials and Methods ... 112
Results and Discussion ... 113
6.3.1 Validation of JBR through comparison to bubbling bed with birch bark ... 113
6.3.2 Application to Kraft lignin and impact of the use of granules ... 114
Conclusions ... 122
Chapter 7 ... 124
7. Applications ... 124
Structure of the Chapter ... 124
Adsorption of Ammonia: Results and Discussion ... 127
Adsorption of Naphthenic Acids: Results and Discussion... 138
Adsorption of Mercury: Results and Discussion... 145
Conclusions ... 155
Chapter 8 ... 161
8. Conclusions and Recommendations ... 161
Conclusions ... 161
8.2. Recommendations ... 162
References ... 163
Appendix I ... 177
I. Production of Bio-Coal from Biomass in a Mechanically Fluidized Reactor (MFR) ... 177
ix
I.II Materials and Methods ... 178
I.III Results and Discussion ... 179
I.IV Conclusions ... 187
I.V References... 188
Appendix II ... 190
II. Arsenic Removal from Natural Water by Means of Bio-Char: the Case of Bangladesh 190 II.I Abstract ... 190
Appendix III ... 191
III. Granulation of Bio-Char for Soil Amendment ... 191
x
List of Tables
Table 1.1 – Different sources of biomass (adapted from Basu, 2013) ... 2
Table 1.2- Example of activation type and applications for activated carbons produced from biomass ... 11
Table 1.3- Example of applications of activated carbons as catalysts ... 11
Table 1.4- Operating conditions, typical product yield and reactor configurations for different types of pyrolysis (Adapted from Basu (2013), Bridgwater (2000) and Yang (2014)) ... 14
Table 2.1- Feedstocks selected in this study, origin and date of harvest ... 20
Table 2.2- Feedstocks characteristics ... 21
Table 2.3- Example of reproducibility of replicates for 95 oC/min heating rate, 500 oC pyrolysis temperature ... 30
Table 2.4- Reproducibility results for elemental analysis, % ... 32
Table 2.5- Example of reproducibility of results for BET measurements ... 34
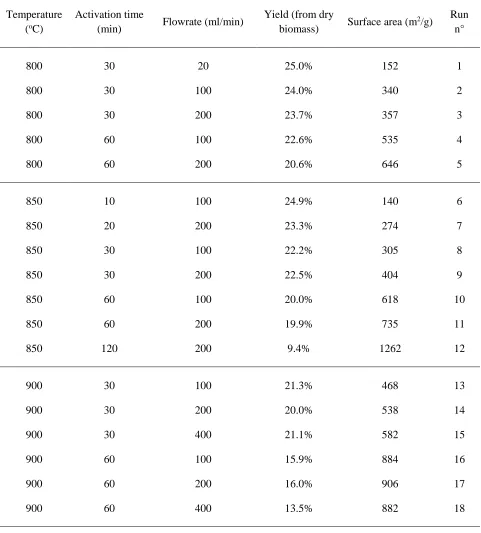
Table 3.1- Summary of experiments and results ... 51
Table 3.2- Determination of ky for different temperatures ... 57
Table 3.3- Determination of kyo and Eay ... 57
Table 3.4- Determination of ks for different temperatures ... 58
Table 3.5- Determination of kso and Eas ... 59
Table 3.6- Selection criteria for the comparison of different biomasses ... 66
Table 3.7- Surface area vs. yield parameters for different feedstocks ... 68
Table 3.8- Composition of pyrolysis gases ... 73
Table 3.9- Combustion reactions for the non-condensable gases stream ... 73
Table 4.1- Calculated value of npk ... 84
Table 4.2- Determination of npk0 and Ea ... 85
Table 4.3- Models parameters... 93
Table 4.4- Values of SSE and MPE for the different models ... 94
Table 5.1- Initial surface area for different activation conditions ... 104
xi
Table 6.1- Comparison between char and activated char yield and surface area in the JBR and in
the bubbling bed during birch bark fast pyrolysis ... 113
Table 6.2- Elemental analysis of char produced from birch bark at 550 oC ... 113
Table 6.3- Results of activation carried out in the JBR starting from char pyrolyzed in the bubbling bed or in the JBR... 114
Table 6.4- Comparison of npk values for slow and fast pyrolysis with granulated and un-granulated lignin ... 117
Table 6.5- Comparison of npk values for slow and fast pyrolysis with granulated and un-granulated olive residue ... 121
Table 7.1- Yield and surface area of the different samples ... 127
Table 7.2- Elemental analysis of the different activated carbon samples ... 128
Table 7.3- Acidic surface groups obtained from TPD, μmol/g ... 128
Table 7.4- Comparison of the removal efficiencies of the different char samples ... 133
Table 7.5- Langmuir and Freundlich isotherm parameters ... 133
Table 7.6- Properties of the carbons used (SP=slow pyrolysis, FP= fast pyrolysis) ... 138
Table 7.7- Model compounds selected for the study ... 139
Table 7.8- Freundlich and Langmuir parameters for lignin samples ... 144
Table 7.9- Yield and surface area characteristics of the different types of carbons used ... 145
Table 7.10- Elemental analysis of the samples ... 145
Table 7.11- Equilibrium time ... 146
Table 7.12- Parameters calculated from fitting of linearized form of kinetic models (graphs omitted) ... 147
xii
List of Figures
Figure 1.1- Market segments for each application of activated carbons (adapted from Transparency
Market Research, 2013) ... 8
Figure 1.2- Thesis structure ... 18
Figure 2.1- Schematic structure of the jiggled bed reactor ... 22
Figure 2.2- Sequence of mixing during a) downward actuator retraction, b) upward actuator extension (Latifi, 2012) ... 23
Figure 2.3- Reactor configuration used for batch experiments, full assembly (left) and lid (right) ... 24
Figure 2.4- Reactor configuration used for fast pyrolysis experiments full assembly (left) and lid (right) ... 25
Figure 2.5- Schematic of the pneumatic actuator (Latifi, 2012) ... 26
Figure 2.6: a) Example of temperature history during pyrolysis (activation carried out at 800 oC for 1h) b) Gas flowrate during activation ... 28
Figure 2.7- Schematic of the bubbling bed reactor ... 30
Figure 2.8 Different types of adsorption isotherms (from Lowell, 1984) ... 35
Figure 2.9- Example of nitrogen adsorption isotherms for three selected samples ... 36
Figure 2.10- Colorimetric reaction for the determination of ammonia concentration ... 43
Figure 2.11- UV-vis spectra of a) model compounds solution b) real Oil Sands Process Water (OSPW) ... 44
Figure 2.12- Calibration curve at 263 nm for a) model compounds solution b) real Oil Sands Process Water (OSPW) ... 44
Figure 2.13- Colorimetric reaction of Rhodamine 6G with tetraiodomercurate ... 45
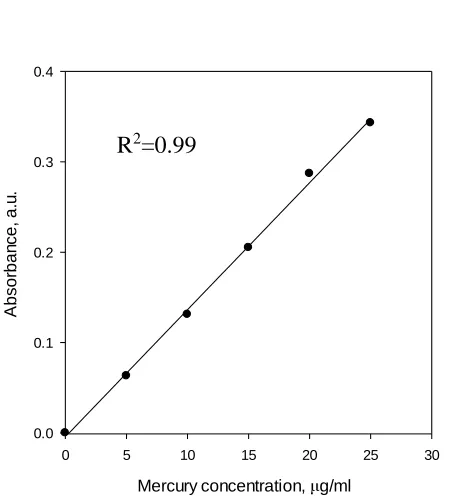
Figure 2.14- Calibration curve with Rhodamine 6G ... 46
Figure 3.1- a) Thermogravimetric profile and b) weight loss derivative of olive residue obtained with TGA obtained in the same conditions used for slow pyrolysis in the JBR ... 49
xiii
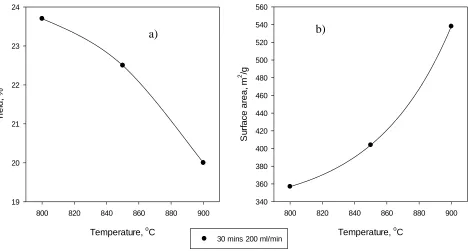
Figure 3.3: Effect of activation temperature on a) the activated char yield and b) the activated char
surface area ... 53
Figure 3.4: Effect of activation time on a) the activated char yield and b) the activated char surface area ... 54
Figure 3.5: Relation between yield and surface area during olive residue activation (points with the same symbol were obtained at the same temperature and flowrate but different times) ... 55
Figure 3.6- Linearized Arrhenius plot for yield ... 57
Figure 3.7- Comparison between the yield calculated with the kinetic parameters and the yield obtained experimentally ... 58
Figure 3.8- Linearized Arrhenius plot for surface area ... 59
Figure 3.9- Comparison between the surface area calculated with the kinetic parameters and the one obtained experimentally ... 60
Figure 3.10- Comparison between the surface area vs. yield plot obtained experimentally (closed symbols) or calculated (open symbols) using the kinetic parameters... 60
Figure 3.11: Relationship between micropore surface area and total surface area for different activated olive residue samples ... 61
Figure 3.12- SEM image of non activated char sample from olive residue ... 62
Figure 3.13- SEM image of activated char sample from olive residue ... 62
Figure 3.14- Integration of activation with the pyrolysis process ... 63
Figure 3.15- a) Yield b) Surface area variation with activation temperature using simulated combustion gases (open symbols) or pure CO2 (closed symbols) as activating agent ... 64
Figure 3.16- Trade-off between surface area and yield for char samples activated with pure CO2 (closed symbols) and CO2/steam mixture (open symbols) ... 65
Figure 3.17- Relationship between micropore surface area and total surface area for char samples activated with pure CO2 (closed symbols) and CO2/steam mixture (open symbols) ... 65
Figure 3.18- Surface area vs. yield trade-off for different feedstocks ... 67
Figure 3.19- Comparison between calculated and experimental values for a) intercept b) slope of the surface area vs. yield trade-off for different feedstocks ... 69
Figure 3.20- Surface area vs. yield trade-off comparison for olive residue and lignin ... 70
xiv
Figure 3.22- SEM images of lignin activated carbon samples ... 71
Figure 3.23- Methylene blued adsorption capacity as a function of mesopore volume for selected samples of olive residue and lignin activated carbons ... 72
Figure 3.24- Sueface area vs yield trade-off for individual feedstocks ... 74
Figure 4.1- Reactions occurring within a char particle during activation ... 77
Figure 4.2- Particle size distribution for activated and non-activated samples of olive residue .. 79
Figure 4.3- Evolution of micropore and total surface area during activation of olive residue activated carbon ... 80
Figure 4.4- Evolution of average pore diameter with activation time for an activation temperature of 850 oC and 200 ml/min CO2 flowrate ... 81
Figure 4.5- Comparison between experimental values of surface area and a) a calculated with Equation 4.25 b) a calculated with Equation 4.27 ... 86
Figure 4.6- Variation of the optimum activation time with the activation temperature ... 88
Figure 4.7- Selection of experimental conditions to maximize Yield*Surface area ... 89
Figure 4.8- Comparison of the predicted vs. experimental yields for the different models ... 93
Figure 5.1- Effect of pyrolysis temperature and heating time on the char yield (no activation) in the JBR ... 97
Figure 5.2- Effect of pyrolysis temperature on a) the activated char yield and b) surface area ... 98
Figure 5.3- Effect of heating rate on a) the activated char yield and b) surface area ... 99
Figure 5.4- Yield vs. surface area trade-off for activated carbon produced from char obtained with different heating rates during the pyrolysis step ... 100
Figure 5.5- Surface area vs. yield for different activation (black symbols) and pyrolysis conditions (open symbols) for a) all the experimental conditions from Chapter 3 and 5 b) for samples produced with a heating rate of 95 oC/min ... 101
Figure 5.6- Micropore surface area as a function of total surface area ... 102
Figure 5.7- Variation of the relationship between micropore surface area and total surface area for different activation conditions and different pyrolysis conditions ... 102
Figure 5.8- Variation of the initial surface area a0 with the reciprocal of the heating rate during pyrolysis ... 104
Figure 5.9- Average pore diameter as a function of pyrolysis temperature and heating rate ... 105
xv
Figure 5.11- Values of npk as a function of the pyrolysis heating rate ... 107
Figure 5.12- Predicted vs. experimental a) yield b) surface area for activated carbon produced from char obtained with different heating rates during the pyrolysis step ... 109
Figure 5.13- Yield*surface area as a function of a) heating time and b) pyrolysis temperature 110 Figure 5.14- Detail of the surface of the char produced by a) slow pyrolysis and b) fast pyrolysis ... 111
Figure 6.1- Comparison between results obtained with bubbling bed and JBR with lignin fast pyrolysis and activation conditions of 1h 900 oC and 1h 850 oC, 200 ml/min CO2 flowrate ... 116
Figure 6.2- Comparison between results obtained with granulated and ungranulated lignin for slow and fast pyrolysis (activation conditions: 850 oC, 1h, 200 ml/min CO2 flow) ... 117
Figure 6.3- Influence of the use of granules on lignin pyrolysis on the char yield as a function of the reciprocal of the heating rate. ... 119
Figure 6.4- Influence of the use of granules on olive residue pyrolysis in the JBR ... 120
Figure 6.5- Comparison between results obtained with granulated and ungranulated olive residue for slow and fast pyrolysis (activation conditions: 850 oC, 1h, 200 ml/min CO2 flow) ... 121
Figure 7.1- Determination of equilibrium time... 129
Figure 7.2- Effect of surface area on adsorption capacity for the different char samples. ... 130
Figure 7.3- Outer surface of a) Raw Olive Char (ROC), b) CO2 Activated Char (CAC), c) Acid-treated Activated Char (AAC). ... 131
Figure 7.4- Internal surface of CO2 activated (CAC) and HNO3 treated char samples (AAC) .. 132
Figure 7.5- Equilibrium adsorption capacity as a function of acid surface groups content. ... 132
Figure 7.6- Adsorption isotherms ... 134
Figure 7.7- Separation factor for different types of activated carbons ... 135
Figure 7.8 - Effect of adsorbent dose on equilibrium adsorption capacity for AAC ... 136
Figure 7.9- Effect of temperature on the equilibrium adsorption capacity for AAC ... 137
Figure 7.10- Example of equilibrium time determination (for lignin fast pyrolysis non activated) a) with NAs solution b) with OSPW... 140
Figure 7.11- Relationship between a) surface area b) mesopore surface area and adsorption
capacity for the adsorption of model compounds onto different types of activated carbons. Symbols
xvi
activated fast pyrolysis lignin char ♦ Commercial coconut activated carbon □ Activated petroleum
coke ○ Activated lignin slow pyrolysis char Activated lignin fast pyrolysis char ... 141
Figure 7.12- Relationship between a) surface area b) mesopore surface area and adsorption capacity for the adsorption of NAs from OSPW onto different types of activated carbons. Symbols legend: ■ Non activated petroleum coke ● Non activated slow pyrolysis lignin char ▲ Non activated fast pyrolysis lignin char ♦ Commercial coconut activated carbon □ Activated petroleum coke ○ Activated lignin slow pyrolysis char Activated lignin fast pyrolysis char ... 142
Figure 7.13- Relationship between total basic group concentration and adsorption capacity for the adsorption of a NAs from a) model compounds solution b) OSPW onto different types of activated carbons. Symbols legend: ■ Non activated petroleum coke ● Non activated slow pyrolysis lignin char ▲ Non activated fast pyrolysis lignin char ♦ Commercial coconut activated carbon □ Activated petroleum coke ○ Activated lignin slow pyrolysis char Activated lignin fast pyrolysis char ... 143
Figure 7.14- Adsorption isotherm results for a) slow pyrolysis lignin b) fast pyrolysis lignin and OSPW ... 144
Figure 7.15- Determination of equilibrium time... 146
Figure 7.16- Comparison between experimental kinetic profile and predicted using kinetic parameters for commercial activated carbon ... 148
Figure 7.17- Comparison between experimental kinetic profile and predicted using kinetic parameters for lignin activated char ... 148
Figure 7.18- Comparison between experimental kinetic profile and predicted using kinetic parameters for olive residue activated char ... 149
Figure 7.19- Relationship between adsorption capacity and mesopore surface area for activated carbons with different ash contents. Symbols legend: ● Olive residue activated chars ▲ Commercial coconut activated char Lignin activated char ... 150
Figure 7.20- Adsorption capacity calculated through the correlation in Equation 7.1 vs. experimental adsorption capacity. Symbols legend: ● Olive residue activated chars ▲ Commercial coconut activated char Lignin activated char... 151
Figure 7.21- Langmuir and Freundlich adsorption isotherms for lignin ... 152
Figure 7.22- Langmuir and Freundlich adsorption isotherms for olive residue ... 153
xvii
Figure 7.24- Determination of a) Langmuir b) Freundlich adsorption parameters (Section 7.2)156
Figure 7.25- Determination of a) Langmuir b) Freundlich adsorption parameters (Section 7.3)156
Figure 7.26- Determination of a) Langmuir b) Freundlich adsorption parameters for lignin
activated carbon (Section 7.4) ... 157
Figure 7.27 -Determination of a) Langmuir b) Freundlich adsorption parameters for olive residue
activated carbon (Section 7.4) ... 157
Figure 7.28- Determination of kinetic parameters for commercial coconut activated carbon a) First
order b) Pseudo second order c) Particle diffusion (Section 7.4) ... 158
Figure 7.29- Determination of kinetic parameters for lignin activated carbon a) First order b)
Pseudo second order c) Particle diffusion (Section 7.4) ... 159
Figure 7.30- Determination of kinetic parameters for olive residue activated carbon a) First order
b) Pseudo second order c) Particle diffusion (Section 7.4) ... 160
Figure I.1- Torrefaction yield of different biomasses at 260 and 300 oC ... 179
Figure I.2- HHV for different torrefied biomasses ... 180
Figure I.3- Energy recovery as a function of torrefaction temperature for different feedstocks 181
Figure I.4- Morphology of sorghum particles a. untreated b. torrefied at 260 oC c. popping of the
seeds at 300 oC, d. stirrer after torrefaction at 300 oC... 182
Figure I.5- Van Krevel diagram for the different biomasses. Black symbols: untreated biomass,
grey symbols: torrefaction at 260 oC, white symbols: torrefaction at 300 oC ... 183
Figure I.6- Variation of the moisture content in willow over a period of 21 days in saturated water
atmosphere ... 184
Figure I.7- Reduction in moisture content after 21 days as compared to virgin biomass ... 185
Figure I.8- Example of biological activity on the virgin biomass samples of sunflower husk and
sorghum after 21 days ... 185
Figure I.9- Reduction in the energy required for grinding for torrefied samples ... 187
Figure I.10- Example of particle size reduction in the MFR as the torrefaction temperature is
xviii
Abbreviations, Symbols, Nomenclature
AAC: acid-treated activated carbon
BET: Brunauer-Emmett-Teller (surface area)
CAC: CO2 activated carbon
FP: fast pyrolysis
GAC: granular activated carbon
JBR: Jiggled Bed Reactor
MPE: mean % error= 1 𝑛∑
|𝑦𝑝𝑟𝑒𝑑𝑖𝑐𝑡𝑒𝑑−𝑦𝑒𝑥𝑝𝑒𝑟𝑖𝑚𝑒𝑛𝑡𝑎𝑙| 𝑦𝑒𝑥𝑝𝑒𝑟𝑖𝑚𝑒𝑛𝑡𝑎𝑙 𝑛
𝑖=0
NAs: naphthenic acids
OSPW: oil sands process affected water
PLC: programmable logic controller
PID: proportional integral derivative (controller)
ROC: raw olive char
RPM: random pore model
SCM: shrinking core model
SEM: scanning electron microscope
SP: slow pyrolysis
SSE: sum of squared errors=∑𝑛𝑖=1(𝑞𝑒,𝑐𝑎𝑙𝑐𝑢𝑙𝑎𝑡𝑒𝑑− 𝑞𝑒 𝑚𝑒𝑎𝑠𝑢𝑟𝑒𝑑)2
xix VRM: volume reaction model
a=surface area, m2/g
a0= initial surface area, m2/g
A= area of pores in one particle of activated carbon, m2
A0= area of pores in one particle of non-activated carbon, m2
b= Langmuir isotherm characteristic constant, L/g
c= Weber-Morris constant, mg/g*min0.5
ce= equilibrium concentration, mg/L
c0= initial concentration, mg/L
d= pore diameter, m
do= initial pore diameter, m
Dp (Rp) = particle diameter (or radius), m
Dp0 (Rp0) = initial particle diameter (or radius), m
Ea= activation energy, J/mol
Eay= activation energy for yield reaction, J/mol
Eas= activation energy for surface area reaction, J/mol
k= kinetic constant, m/min
kf= Freundlich isotherm adsorption capacity, L/g
kint= kinetic constant for intraparticle diffusion model, mg/(g*min0.5)
ky= apparent kinetic constant for yield, min-1
xx
ks=apparent kinetic constant for surface area formation, m2/(g*min)
ks0= reaction rate coefficient for surface area formation, m2/(g*min)
k1st= kinetic constant for first order adsorption model, min-1
k2nd= kinetic constant for pseudo-second order adsorption model, mg/(g*min)
L0= pore length, m
mc= mass of activated char, g
mc0= mass of non-activated char, g
n= number of carbon atoms in NAs
n= Freundlich isotherm exponent
np= number of pores in one particle of char
p= partial vapour pressure of adsorbate gas in equilibrium with the surface at 77.4 K (liquid
nitrogen)
pa= partial pressure of activating agent
p0= saturated pressure of adsorbate gas
qt= adsorption capacity at time t, mg/g
qe= adsorption capacity at equilibrium, mg/g
Q0= Langmuir isotherm maximum adsorption capacity (monolayer)=Qmax, mg/g RL= ripartition coefficient
rv= reaction rate for particle volume reduction, m3/min
r1=reaction rate for pore enlargement, m/min
xxi t=time, minutes
Va= volume of gas adsorbed at standard temperature and pressure
Vc= volume of one particle of activated char, m3
Vc0= volume of one particle of non- activated char, m3
Vm = volume of gas adsorbed at STP
Vpores= volume of pores in one particle of activated char, m3
y= pore depth, m
Y=yield of activated char, %
Y0= yield of non-activated char, %
x= conversion, %
x: number of oxygen atoms in NAs
z: hydrogen deficiency due to rings formation in NAs
𝜀0= solid porosity
𝜌𝑐= density of activated char, m3/g
𝜌𝑐0= density of non-activated char, m3/g
1
Chapter 1
1.
Introduction
1.1 Motivation
Renewable energy from biomass has received increasing interest due to the growing concerns over
declining fossil oil reserves and increases in energy demand and cost. Biomass can come from a
variety of sources as shown in Table 1.1 (from Basu, 2013).
The International Renewable Energy Agency (IRENA) estimates that total biomass supply
world-wide could range from 97-147 EJ/yr by 2030 (IRENA, 2014). About 38-45% of the total supply
is estimated to originate from agricultural residues and waste (37-66 EJ/yr). The remaining supply
potential (60-81 EJ/yr) is shared between energy crops (33-39 EJ/yr) and forest products, including
forestry residues (27-43 EJ/yr). (To provide a reference, USA energy consumption is estimated to
be 100 EJ/yr (Capareda, 2013)).
Besides its use as fuel, the emerging green bio-economy targets biomass as a source for the
production of value-added chemicals. This philosophy led to the development of the concept of
biorefineries, where the combination and integration of different biomass conversion processes
generates both fuels and chemicals, very much as in traditional petrochemical refineries. This
approach has two advantages: on one side, it maximizes the feed utilization and the product values,
while, on the other side, both feedstocks and products slates can be adapted to the continuously
fluctuating markets.
Biomass pyrolysis has the potential to become a major component of future biorefineries, since
biomass is cracked to produce gases, liquid products (bio-oil) and solid products (bio-char). In
order for the process to be economically feasible, it is necessary to obtain the maximum value from
each stream, thus no by-product can be regarded as a waste.
Bio-char is normally regarded as a by-product of fast pyrolysis, which is optimized to target
bio-oil production. However, there are many potentially attractive applications for it: for example, it
can be used for the production of activated carbons, which are the most commonly used adsorbent
2
In this study, a new reactor technology developed at ICFAR, the Jiggled Bed Reactor (JBR) is
employed as a fast and reliable tool for the screening of different types of biomasses for the
production of activated carbons. The JBR allows operating in conditions that are representative of
large scale reactors and, due to its excellent heating system, both slow and fast pyrolysis conditions
can be achieved, and activation can be carried out.
The first objective of this study was to investigate the suitability of the JBR for slow and fast
pyrolysis and for activation of the produced pyrolytic bio-char into activated carbons. The second
objective was to study the impact of the type of feedstock, activation and pyrolysis conditions on
the final product characteristics. Finally, the performance of the produced activated carbons for
adsorption applications was undertaken, and the results compared with commercial products.
Table 1.1 – Different sources of biomass (adapted from Basu, 2013)
A. Virgin biomass
A1. Terrestrial
i. Forest biomass
ii. Grasses
iii. Energy Crops
iv. Cultivated Crops
A2. Aquatic biomass i. Algae
ii. Water Plant
B. Waste biomass
B1. Municipal waste
i. Municipal solid waste
ii. Biosolids, sewage
iii. Landfill gas
B2. Agricultural solid
waste
i. Livestock and manure
ii. Agricultural crop residues
B3. Forestry residues i. Bark, leaves
B4. Industrial wastes i. Demolition wood
3
1.2 What is Pyrolytic Bio-Char?
For the context of this thesis, the terms “pyrolytic bio-char”, or, simply “bio-char”, are used to
refer to the solid co-product of biomass pyrolysis. Pyrolysis is a thermochemical process involving
the thermolysis or chemical decomposition of organic (carbon-based) materials that takes place in
the absence of an oxidizing agent. During pyrolysis, the large complex hydrocarbon molecules
that constitute biomass (hemicellulose, cellulose and lignin) break down into smaller and simpler
molecules of gas, liquid and solid. Generally, the product of interest in pyrolysis is the bio-oil,
which can be used as a fuel or be refined for chemicals production. Bio-oil production can be
maximized by using fast pyrolysis, while the gaseous stream (containing mainly CO, CO2, CH4
and H2) is usually combusted to provide process heat. The third co-product of pyrolysis is pyrolytic
bio-char, a solid residue containing mainly carbon and the biomass minerals (ashes).
The production of bio-char traces back to ancient times, and is one of the oldest industrial
technologies developed (Antal, 1996). It was originally intended for the production of charcoal
that was used to smelt tin for the manufacturing of bronze tools, or as a high-grade cooking fuel.
Due to the decrease of petroleum resources, the environmental impact of the increased amounts of
atmospheric greenhouse gases, the desire for sustainability of resources and, consequently, the
increased interest in alternative feedstocks for the production of fuels and chemicals, the pyrolysis
process tends to be oriented to the maximization of the bio-oil production, leaving bio-char as a
by-product. Nonetheless, bio-char has several attractive applications such as a carbon-neutral fuel
with properties similar to coal, reductant in the metallurgical industry as a coke substitute,
adsorbent material, soil amendment and others (Antal et al., 2003).
1.3 Possible Bio-Char Applications
Despite its great popularity and promising potential, the use of bio-oil as a fuel or for chemical
production requires expensive upgrading processes. Thus, the economics of the pyrolysis process
needs to be improved by finding suitable applications for bio-char. The main challenge related to
the development of commercial bio-char projects is the lack of information on how to produce an
engineered product with the desired properties required for each application from suitable biomass
sources. Brown (2009) pointed out that the increase in understanding bio-char characteristics for
4
for different products; for example, bio-char when intended for soil amendment, bio-coke when
used in the metallurgical industry, and bio-coal when used as coal substitute. Lehmann and Joseph
(2009), and Kwapinski (2010) reported that the main causes of the poor use of bio-char for high
value applications are: 1) the lack of systematic methods to characterize bio-char, 2) the lack of
standard specifications for each application 3) a knowledge gap on the relationship between
product characteristics, feedstock and operating conditions. Part of the challenge in making a
process successful is the selection of the proper application. Producers would need to sell their
product for approximately two to three times the cost of the original biomass to be profitable,
because during pyrolysis only approximately a half to a third of the original biomass is
transformable into saleable bio-char (although getting additional value from the bio-oil improves
the economics).
Thus, two aspects are crucial: the selection of a proper application, with a well-established or, at
least, a very promising market and price, and the selection of production conditions that would be
relevant both for bio-oil and bio-char production, to maximize the process benefits.
In the case of bio-char, the following applications can be considered:
-FUEL: The use of biomass as a fuel has already been extensively investigated; nevertheless,
biomass suffers of problems like high moisture content and low energy density, which leads to
high transportation costs. Moreover, the grindability of biomass is poor, due to its fibrous nature;
it has hydrophilic behavior, heterogeneous properties and relatively low calorific value (Tumuluru,
2011). As a result of pyrolysis, biomass can be converted into biomass-derived fuels such as
bio-coal (charbio-coal) and bio-oil (Cruz, 2012).
Charcoal has always been used as a cooking fuel, and is the main fuel in developing countries.
Due to its good calorific value, some fast pyrolysis processes use the bio-char, produced as a
by-product, as a fuel to provide the process heat required for bio-oil production. In fact, bio-char has
a good calorific value (19-25 MJ/kg), is basically S and N free, and thus a potential good fuel in
term of emission and soot formation (Mullen et al., 2010).
For example, Boateng et al. (2007) asserted that burning the 15-20 % of bio-char with a calorific
value of 20000-25000 kJ/kg produced as a by-product of the bio oil production (assuming a bio
oil yield of 60-70%), would make the pyrolysis process for bio-oil production economically
5
2014) outlines how incentives such as carbon taxes and regulations on the production,
transportation and use can also help the development of bio-carbon based bioenergy systems.
However, when the primary objective of biomass conversion is the production of a solid fuel, the
process selection tends to be oriented to torrefaction. Torrefaction is a milder type of pyrolysis
process which takes place at moderate temperatures (200-300 oC), which are sufficient to modify
the structure of biomass, make it less hygroscopic and improve its grindability while still achieving
a very high energy recovery in the solid product. Bio-char produced from pyrolysis contains a high
quantity of carbon content i.e. between 20-50% of the carbon originally contained in the biomass
in the case of pyrolysis, compared to around 70% in the case of torrefaction, with 90% of the
energy content (Van der Stelt, 2011; Cruz, 2012).
-SOIL APPLICATION: The interest in soil application of bio-char arose since the discovery of
“Terra Preta”. As reported by Lehmann (2003), Terra Preta is the local name given to certain dark
earths of the Amazonian region, which have been proven to be highly fertile. This particular feature
is related to the high carbon content detected (150 g C/kg soil), which is highly recalcitrant and,
thus, can be stored in the soil for very long periods. Structural analysis, which demonstrated the
similarity between Terra Preta and bio-char, lead researchers to focus on the potential application
of bio-char to soil to improve its fertility. Thus, it is believed that the use of bio-char in soil can
improve the productivity and, at the same time, due to its recalcitrant nature, is an efficient method
to promote carbon sequestration, helping to mitigate global climate change.
Despite the fact that this is a very attractive application, it is still at an early stage and more research
is needed to identify how parameters like soil type, plant type, and climate affect the performance
of bio-char for soil application. Also, this is a multidisciplinary application that requires joint
efforts involving engineers, soil and plant scientists. This contributed to the creation of a great
number of organizations, such as the International Biochar Initiative, that have the aim of
promoting the creation of standards and policies to guide public and regulatory confidence. The
philosophy of the Lehmann group at Cornell University is that, instead of thinking of bio-char as
a “one-size-fits-all” soil enhancer, tailor-made bio-char systems have to be created for individual
applications, taking into account factors like soil type, climate and social setting (Abiven, 2014).
The aim of their research program spans from increasing basic understanding of nutrient and
6
microbial, faunal and root abundance once applied to soil (Lehmann, 2011). Brewer (2009, 2011,
2012) carried out a combination of soil application and analytical studies at Iowa State University,
to understand the implication of the physical and chemical properties of different types of bio-char
to soil responses (such as, for example, pH and cation exchange capacity) and CO2 emissions,
identifying potentially favorable scenarios for bio-char engineering. From the engineering point of
view, significant amount of work is being carried out at the U.K. biochar institute, where the focus
is to understand how the production conditions and the feedstock characteristics influence the
stability of bio-char and the availability of nutrients in soil (Mašek, 2013; Crombie, 2013).
-CARBON FIBERS: Carbon fibers can be defined as fibers containing at least 92 wt % carbon.
They are mainly used as a filler in composites, due to their excellent tensile properties, low
densities, high thermal and chemical stabilities in the absence of oxidizing agents, good thermal
and electrical conductivities, and excellent creep resistance (Huang, 2009). The current carbon
fiber market is dominated by polyacrylonitrile (PAN) feedstock, but a significant research effort
is being devoted towards its production from renewable sources with low cost without sacrificing
the high carbon content. Feedstocks such as lignin have already been investigated for this purpose
starting from the 70’s (Otani, 1969). More recently, this has been the focus of research networks
such as Lignoworks, which have proved the feasibility of producing carbon fibers from Kraft lignin
(Lin, 2013). The electrical conductivity and magnetic properties of lignin-based nanofibers were
found to be comparable or superior to that of PAN based magnetic carbon nanofibers, and the
addition of single wall nanotubes (SWNT) allowed achieving higher values of tensile and Young’s
modules. In 2013, precursor fibers from lignin were converted into carbon fibers in the first
commercial-scale trial, a partnership between Weyerhaueser and Zoltek (Weyerhaueser, 2013).
Since the production process involves a carbonization step, to remove volatiles, oxygen and
nitrogen, it is believed that bio-char resulting from pyrolysis of biomass with high carbon content
and low ash content could be successfully used for this application.
-OTHER CARBON-BASED MATERIALS: There is also the potential for bio-char to be
converted into high-value carbon products. Applications could include manufacturing of synthetic
graphite, which can be used in some types of batteries and fuel cells, and carbon electrodes (de
Ruiter, 2014). Other high value applications can be the substitution of carbon black as filler in
7
well as the production of catalysts for tar cracking, esterification and hydrolysis (Kastner, 2012;
Ormsby, 2012). These products can surely represent the future of high value applications for
bio-char, but are currently limited to smaller scales and laboratory research.
-ACTIVATED CARBONS: Pyrolytic bio-char can be used as a precursor for the production of
activated carbons. Activated carbons are the most used adsorbent material, with a price ranging
from hundreds to several thousand dollars per metric ton, depending on formulation, specificity,
and performance. Their applications range from wastewater treatment, air purification, removal of
contaminants and many others. More insight into this application will be discussed later (Paragraph
1.4).
The main application selected for this thesis is the production of activated carbons. Insight into the
activated carbons market that can justify this choice will be given in the following paragraphs.
1.4 Activated Carbons
Current and perspective market
According to the global activated carbons market forecast and opportunities (The Freedonia
Group, 2014), the demand for activated carbons is expected to increase more than 10% per year
for the next 5 years to reach a $3 billion market by 2017. The main applications are water treatment
and air purification.
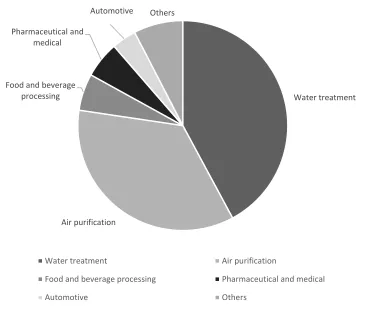
Figure 1.1 shows the demand for each application as of 2012 (adapted from Transparency Market
Research, 2013). The water treatment application segment held the largest market share in 2012,
and its consumption is expected to grow at a rate of 10.2% per year from 2013 to 2019.
On the other hand, the air purification segment is tagged as the fastest growing application segment
for the activated carbon market. With respect to revenue generated, it is expected to grow at a rate
8
Figure 1.1- Market segments for each application of activated carbons (adapted from Transparency Market Research, 2013)
Regulatory changes, particularly in the two largest markets - the US and China - will be the main
drivers for growth.
In the US and other industrialized countries, the demand for activated carbons will be influenced
by stricter standards, for example, for mercury removal: the market for this application is expected
to more than double by 2018 in response to the full implementation of the US Environmental
Protection Agency’s Mercury and Air Toxic Standards (The Freedonia Group, 2014).
In contrast, in China and other developing countries, the main drive will be the introduction and
enforcement of standards as efforts to battle air and water pollution caused by rapid
industrialization. Increasing manufacturing activity in many developing countries will also
contribute to the increased demand for activated carbons.
A new market segment that is being explored in the literature is the use of bio-based activated
carbons as catalyst support. This is particularly attractive for some feedstocks with high ash content
that are usually not considered suitable for applications such as wastewater treatment because of Water treatment
Air purification Food and beverage
processing Pharmaceutical and
medical
Automotive Others
Water treatment Air purification
Food and beverage processing Pharmaceutical and medical
9
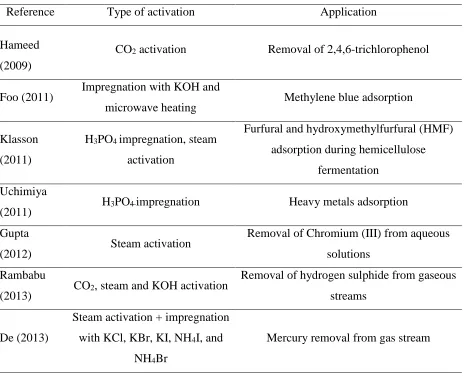
their mineral content that could instead make it suitable as a catalyst. Tables 1.2 and 1.3 show
different applications of biomass-based activated carbons for adsorption and catalysis.
Feedstocks for the production of activated carbons
While activated carbons are mostly produced from non-renewable carbonaceous materials such as
peat, lignite, and coal, their production from renewable feedstocks such as coconut husks is also
used at the industrial scale. Nonetheless, one of the key challenges in the market is the shortage of
raw materials such as coconut-based charcoal that is used for making activated carbons. In Sri
Lanka, there has been an increment of around 50% in the prices of coconut shell charcoal between
2010 and 2011 (Markets and Markets, 2012). The shortage of traditional raw materials is identified
as a potential treat to market growth also by Infiniti Research Limited (2014).
There are a large number of globally available agricultural and forestry wastes that do not yet have
high-value applications. Recent research has been focused on those feedstocks. Examples that can
be found in the literature include wheat, corn straw, olive stones, bagasse, birch wood, miscanthus,
sunflower shells, pinecones, rapeseed, cotton residues, olive residues, pine rayed, eucalyptus
maculata, sugar cane bagasse, almond shells, peach stones, grape seeds, straw, oat hulls, corn
stover, apricot stones, cotton stalk, cherry stones, peanut hull, nut shells, rice hulls, corn cob, corn
hulls, hazelnut shells, pecan shells, rice husks and rice straw (Ioannidou, 2007).
Production processes
Activated carbons are most commonly produced via two types of industrial processes: physical
activation or chemical activation. Physical activation involves the carbonization (pyrolysis) and
reaction of the solid pyrolytic bio-char material using hot oxidizing agents, such as steam or CO2.
Chemical activation is achieved through the use of an impregnating agent, such as a strong acid or
base. The resulting carbon structure has a surface area of between 500-2500 m2/g, which explains
activated carbons’ large adsorptive capacity
1.4.3.1 Chemical activation
Prior to thermal treatment, the raw material is doped with chemicals: usually an acid, strong base,
or salt. The most popular activating agents are phosphoric acid, zinc chloride and potassium
10
450 and 700 °C, which is lower than the required activation temperature range for physical
activation, and can be carried out in a one-step process. The activated carbon product is then
washed with water and dried. Activated carbons produced by chemical activation generally result
in a larger pore size than with physical activation, which is ideal for the adsorption of large
molecules. Despite the possibility to obtain higher surface areas using chemical activation, this
method presents three main drawbacks:
Use of chemicals that are potentially toxic, such as zinc chloride (Rambabu, 2014);
Intensive washing required after activation, which also generates a great amount of wastewater;
Risk of leaching chemicals that have not completely been washed (especially when used for wastewater treatment).
For these reasons, this method will no further be discussed in this thesis.
1.4.3.2 Physical activation
Physical activation is carried out in two steps:
Initially, carbonization of the feedstock takes place through pyrolysis. Sustained temperatures
remove moisture and volatiles and leave a fixed carbon mass with an initial porous structure within
which ashes are dispersed. Then, the bio-char is activated in the presence of CO2, air, or steam at
temperatures between 800 and 1100 °C. The following reactions take place:
𝐶 + 𝐻2𝑂 (𝑠𝑡𝑒𝑎𝑚) → 𝐶𝑂 + 𝐻2
(1.1)
𝐶𝑂 +1
2𝑂2 → 𝐶𝑂2
(1.2)
𝐻2+ 1
2𝑂2 → 𝐻2𝑂 (1.3)
𝐶 + 𝑂2 → 𝐶𝑂2
(1.4)
𝐶𝑂2+ 𝐶 → 2𝐶𝑂
(1.5)
Activation burns off remaining tars and further oxidizes the carbon structure from the skeleton of
pores that were formed during carbonization. CO2 is normally preferred for this application, since
11
Examples of activated carbons production and applications are reported in Tables 1.2 and 1.3.
Table 1.2- Example of activation type and applications for activated carbons produced from biomass
Reference Type of activation Application
Hameed
(2009)
CO2 activation Removal of 2,4,6-trichlorophenol
Foo (2011) Impregnation with KOH and
microwave heating Methylene blue adsorption
Klasson
(2011)
H3PO4 impregnation, steam
activation
Furfural and hydroxymethylfurfural (HMF)
adsorption during hemicellulose
fermentation
Uchimiya
(2011) H3PO4 impregnation Heavy metals adsorption
Gupta
(2012) Steam activation
Removal of Chromium (III) from aqueous
solutions
Rambabu
(2013) CO2, steam and KOH activation
Removal of hydrogen sulphide from gaseous
streams
De (2013)
Steam activation + impregnation
with KCl, KBr, KI, NH4I, and
NH4Br
Mercury removal from gas stream
Table 1.3- Example of applications of activated carbons as catalysts
Reference Type of activation Application
Muradov (2012) CO2 activation Biogas reforming
Wang (2014) KOH activation Methanation
Zhu (2015) KOH activation Methanation
12
1.4.3.3 Reactors used for the activation process
A number of different types of kilns and furnaces can be used for carbonization/activation and
include rotary kilns (fired directly or indirectly), vertical multi-hearth furnaces, fluidized bed
reactors and vertical single throat retorts (Cameron Carbon, 2006)
1.5 Biomass Pyrolysis
The pyrolysis process
The pyrolysis process influences not only the products distribution (yield of each stream), but also
has a great influence on the products properties. Through the selection of an appropriate feedstock
and the control of process parameters such as heating rates, reaction temperature and vapor
residence times, it is possible to maximize the formation of one product over the other, and control
their quality.
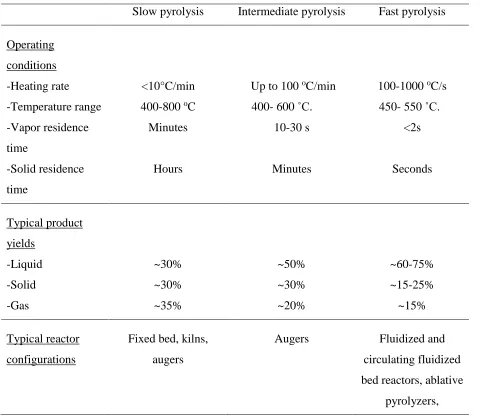
Traditionally, the different pyrolysis processes are classified as:
Slow pyrolysis: slow pyrolysis is characterized by slow heating rates of the biomass and long gas and solid residence times. Since the rate of devolatilization is slow, the main product is
bio-char. Operating temperatures are higher than 400 oC (Basu, 2013), and can reach 800 oC,
depending on the final product requirements (Brewer, 2012);
Fast pyrolysis: fast pyrolysis is characterized by extremely high heating rates (100-1000 oC/s) and, very short residence times of vapors (<2 s). Operating temperatures are usually in the range
450- 550 ˚C;
Intermediate pyrolysis: intermediate pyrolysis is characterized by moderate temperatures (400-600˚C) and moderate heating rates (of the order of minutes). Vapor and solid residence times
are longer than the ones required for fast pyrolysis (10-30 s for the vapors, in the order of
minutes for the solid). This allows for a more even distribution of pyrolysis products and,
13
Reactors used for biomass pyrolysis
Charcoal production is a technology that has been known for thousands of years, most likely since
humans learned how to control fire. In the first stages of production, wood logs were stacked into
a pyramidal pile, leaving room at each end for an air inlet and outlet, causing the combustion region
to gradually move across it (Brewer, 2012). The first reactors built to produce charcoal were simple
kilns, which were operated for long periods of time with low heating rates to maximize the solid
product (Basu, 2013). Nowadays, the reactors configuration has changed according to the
increasing interest in the liquid and gas products.
One of the main points of research is the reactor technology in which the process is carried out:
the critical points for fast pyrolysis reactors, according to Bridgwater, (2000), are the control of
temperature, heating rates, rapid cooling of the gas to separate the oil and char separation. A
comprehensive review of fast pyrolysis reactors has been done by Bridgwater in several papers
(1999, 2000, 2001), and Briens (2008). The main distinction between pyrolysis reactors depends
on the gas-solid contact mode, which divides the reactors into fixed bed, fluidized bed, and
entrained bed. From the design point of view, the main types of reactors are: fixed beds, rotary
drums, auger reactors, bubbling fluidized beds, circulating fluidized beds, rotative cone pyrolysers,
ablative pyrolysers, and vacuum pyrolysers.
14
Table 1.4- Operating conditions, typical product yield and reactor configurations for different types of pyrolysis (Adapted from Basu (2013), Bridgwater (2000) and Yang (2014))
Slow pyrolysis Intermediate pyrolysis Fast pyrolysis
Operating
conditions
-Heating rate
-Temperature range
-Vapor residence
time
-Solid residence
time
<10°C/min
400-800 oC
Minutes
Hours
Up to 100 oC/min
400- 600 ˚C.
10-30 s
Minutes
100-1000 oC/s
450- 550 ˚C.
<2s
Seconds
Typical product
yields
-Liquid
-Solid
-Gas
~30%
~30%
~35%
~50%
~30%
~20%
~60-75%
~15-25%
~15%
Typical reactor
configurations
Fixed bed, kilns,
augers
Augers Fluidized and
circulating fluidized
bed reactors, ablative
15
1.6 Context and Scope of this Thesis
In general, current processes for the production of activated carbons from renewable resources do
not provide valuable co-products. This is mainly due to the fact that the carbonization step is
carried out at excessively high temperatures (up to 800 °C, where the production of vapors is not
favorable) or extremely low heating rates, which do not allow the integration of the production of
activated carbons with bio-oil. Since, as previously discussed, bio-oil is a source of attractive
chemicals and fuels, using bio-char produced from controlled pyrolysis conditions that are also
relevant to the production of bio-oil can greatly improve the economics of the pyrolysis process
and contribute the development of bio-refineries.
Despite the great amount of work that has already been done on the production of activated carbons
from biomass, it is still difficult to determine whether a feedstock will be attractive or not, and for
which application it might be suitable. In fact, the extremely large variety of biomass types
available and the variability within the same biomass material depending on the origin, harvesting,
etc., make it very difficult to generalize.
The properties of activated carbons are strongly related to the activation process conditions (gas
flowrate, temperature, residence time) but also to the type of carbon precursor. While extensive
study has been carried out on the influence of these activation parameters (Jung, 2014; Lua, 2000;
Valente Nabais, 2011; Yang, 2003; Yang, 2010), very little attention has been paid in the literature
to carbon precursors produced from the same feedstock under different pyrolysis conditions, and
how this affects the activation process. Also, the studies that are presented in the literature are
often limited by the very small scale (Pottmaier, 2013) or the type of reactors with which
experiments are carried out, which are irrelevant at the large scale (Onay, 2007), or that the range
of heating rates considered is too narrow (Lua, 2004).
It has previously been shown that gas-solid fluidized bed reactors offer some advantages when
used for pyrolysis and activation reactions, due to higher rates of mass and heat transfer when
compared to fixed bed reactors. Bench scale and pilot plant scale fluidized bed reactors would thus
be the most appropriate options to investigate the effect of some operating conditions while
ensuring that both the mixing pattern and the heat transfer are realistic and, thus, the results offer
a reliable source of information for the scale-up.
However, due to the high cost and time constraint, besides significant technological challenges in
16
both academia and industry for the screening phase of new technologies, or for the optimization
of reaction conditions and screening of new feedstocks.
Most of the studies reported in the literature about the influence of pyrolysis conditions on the
production of activated carbons at the laboratory scale are carried out in fixed beds (Onai, 2007;
Şensӧz, 2008; Angin, 2013; Jung, 2014). Fixed bed reactors are characterized by relatively poor
heat and mass transfer between the gas and the particles, and pronounced radial temperature
profiles; these reactor characteristics have been proved to have a detrimental impact on the
production and quality of activated carbons from biomass (Minkova, 2000). Moreover, with these
types of reactor, it is impossible to achieve both fast and slow pyrolysis conditions in the same
reactor, thus limiting the studies mostly to slow pyrolysis conditions.
Thermo-gravimetric analysis (TGA) is another tool that is often used to study the thermal
decomposition of biomass and others materials. Its use for the determination of the weight loss
characteristics and its associated reaction kinetics is well established (Moilanen, 2006). In spite of
a wide range of applications in academia and the industry, the TGA technique shows some
limitations, which may reduce the reliability of the obtained results.
Some of the drawbacks have been highlighted by Samih (2015):
Non-uniformity of the temperature throughout the sample
Poor mixing
Low heating rate
Small amount of solid sample, which is not enough to be representative.
Some improvements have been made by Samih (2015), who developed a fluidized bed TGA
(FB-TGA), in which proper mixing and uniform distribution of gas-solid and solid-solid are ensured
by fluidization, while also allowing for a sufficient amount of sample to be processed with heating
rates that are more representative of conditions encountered in large scale reactors.
Latifi (2012) developed the Jiggled Bed Reactor (JBR), an excellent tool to study gas-solid
reactions. While mixing is achieved through mechanical agitation, thus producing a mixing pattern
equivalent to that of a fluidized bed without the need of fluidization gas, fast heating is provided
by induction. The JBR has successfully been used for the study of bio-oil gasification and for
catalysts screening.
17
1) Use a lab-scale reactor that allows to perform both pyrolysis and activation in the same
equipment;
2) Use of a lab-scale reactor (JBR) that enables fast screening of operating conditions but is
representative of conditions that are obtained in larger scale reactors for both pyrolysis and
activation;
3) Carry out trials under operating conditions that are relevant for the production of by-products,
as well as bio-char (fast pyrolysis, short solid residence times) and develop tools to predict the
properties of the activated carbons produced based on the carbon precursor;
4) Perform a screening of different types of biomass and identify the most attractive ones based
on simple correlations; and
5) Identify potential applications for the most attractive materials.
1.7 Thesis Structure
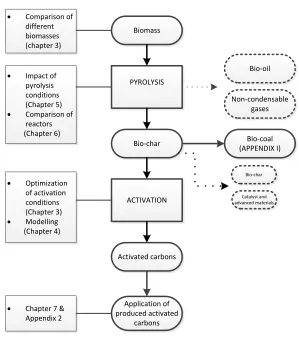
Chapter 2 presents the materials and methodology that are used throughout the thesis: the feedstock selection and characterization, experimental set up and analytical techniques;
Chapter 3 validates the use of the Jiggled Bed Reactor (JBR) for the activation process of olive residue, identifies optimal activation parameters and studies the kinetic of the process. It also
provides a screening of the performance of different feedstocks and characterizes the most
attractive;
Chapter 4 presents a simple physical model for activation that allows predicting the yield or surface area of activated carbons based on the char precursor properties. This model is applied
to the results obtained in Chapter 3 and 5 and is used as a reference for the discussion of the
results obtained in Chapter 6;
In Chapter 5 the JBR set-up is modified to allow the pyrolysis conditions to be varied from slow to fast in the same reactor. The impact of the heating rate and temperature during the
pyrolysis step on the properties of activated carbons produced from olive residue is studied;
In Chapter 6 the results obtained with the JBR are compared with those obtained in a pilot scale bubbling bed for the pyrolysis and activation of birch bark. The first objective is to prove
that the JBR is an excellent tool for the simulation of reaction conditions encountered in larger
18
(e.g. granulated and un-granulated) on the processability of feedstocks that are difficult to
handle, such as Kraft Lignin;
Chapter 7 covers the application of the activated carbons produced in the previous chapters for the adsorption of selected contaminants:
i. Mercury
ii. Naphthenic acids from oil sands tailing pond water
iii. Ammonia
Chapter 8 includes the final conclusions and recommendations.
Additional work is reported in Appendixes I and II. Appendix I presents a study about biomass
torrefaction in a Mechanically Fluidized Reactor (MFR), while Appendix II investigates the
application of low technology adsorbent materials (i.e. non activated bio-char) to the removal of
arsenic from groundwater, since water contamination by arsenic is a major concern in countries
like Bangladesh.
Figure 1.2- Thesis structure
PYROLYSIS Biomass
Bio-oil
Non-condensable gases
Bio-char Bio-coal
(APPENDIX I)
Activated carbons ACTIVATION
Application of produced activated
carbons
Bio-char
Catalyst and advanced materials
Optimization
of activation conditions (Chapter 3)
Modelling
(Chapter 4)
Impact of
pyrolysis conditions (Chapter 5)
Comparison of
reactors (Chapter 6)
Comparison of
different biomasses (chapter 3)
Chapter 7 &