Scholarship@Western
Scholarship@Western
Electronic Thesis and Dissertation Repository
12-14-2015 12:00 AM
HD2D is a Regulator of Abscisic Acid Responses in Arabidopsis
HD2D is a Regulator of Abscisic Acid Responses in Arabidopsis
Joshua A. Farhi
The University of Western Ontario
Supervisor Lining Tian
The University of Western Ontario Joint Supervisor Denis Maxwell
The University of Western Ontario Graduate Program in Biology
A thesis submitted in partial fulfillment of the requirements for the degree in Master of Science © Joshua A. Farhi 2015
Follow this and additional works at: https://ir.lib.uwo.ca/etd
Part of the Cell Biology Commons, Food Biotechnology Commons, Molecular Biology Commons, and the Molecular Genetics Commons
Recommended Citation Recommended Citation
Farhi, Joshua A., "HD2D is a Regulator of Abscisic Acid Responses in Arabidopsis" (2015). Electronic Thesis and Dissertation Repository. 3467.
https://ir.lib.uwo.ca/etd/3467
This Dissertation/Thesis is brought to you for free and open access by Scholarship@Western. It has been accepted for inclusion in Electronic Thesis and Dissertation Repository by an authorized administrator of
(Thesis format: Monograph)
by
Joshua Aaron Farhi
Graduate Program in Biology
A thesis submitted in partial fulfillment of the requirements for the degree of
Master of Science
The School of Graduate and Postdoctoral Studies The University of Western Ontario
London, Ontario, Canada
Abstract
Histone deacetylases have important roles in development and stress response in plants.
To further investigate their function, the HD2D gene, of the plant specific HD2 family, was
studied. An hd2d-1 mutant and two HD2D overexpression lines were used in this study.
Germination was delayed in hd2d-1 and HD2D overexpression seeds only in the presence
of ABA. HD2D was found to positively regulate the expression of members of the
ABA-response pathway (ABI1, ABI5, and RD29A) leading to increased resistance to drought and
salinity treatments. Furthermore, HD2D expression delayed flowering by positively
regulating FLC expression. Using bimolecular fluorescence complementation, the HD2D
protein was found to interact with the ABA pathway members ABI1, ABI2, and ABI5.
Taken together, the results of this study suggest that HD2D is a regulator of ABA responses
in Arabidopsis. By expanding the knowledge of plant stress response, this research will
help lead to long-term improvements of drought tolerance.
Keywords
Co-Authorship Statement
All work in this thesis was conducted by Joshua Farhi with the exception of
selection of hd2d-1 mutant line, generation of HD2D overexpression lines, and generation
of BiFC constructs. Collection of F1 and F2 seeds from the hd2d-1 mutant line
(GABI-Kat_379G06) and the construction of the associated figure (Fig. 3.1A and B) were
conducted by Dr. Gary Tian. Furthermore, generation of the HD2D overexpression vector
and transformation of Arabidopsis was conducted by Dr. Gary Tian, with the associated
figure (Fig. 3.1C and D). The 1-1 and 4-1 homozygous overexpression lines were selected
by Joshua Farhi. Vectors used in bimolecular fluorescence complementation experiments
Acknowledgments
I am grateful to my supervisor Dr. Lining Tian for this great research opportunity he has
given me. His supervising style contributed to an intellectually stimulating environment
that led to my growth as an independent researcher and an individual.
Additionally, I would like to thank Dr. Gary Tian for his enormous help throughout this
research project. His vast knowledge of molecular techniques, research design, and
molecular biology was extremely helpful and I learned a lot from him in the process.
I would also like to thank my co-supervisor Dr. Denis Maxwell for his help during the
preparation of this thesis, my writing has definitely improved as a result of all of his help.
I would also like to thank my advisory committee members Dr. Danielle Way and Dr.
Richard Gardiner for their valuable input throughout this project and preparation of this
thesis.
I would like to thank my family and friends for their ongoing support throughout this
program. Without their continuous help, sacrifice, and encouragement this would not have
Table of Contents
Abstract ... i
Co-Authorship Statement... ii
Acknowledgments... iii
List of Tables ... vi
List of Figures ... vii
List of Abbreviations ... viii
Chapter 1: Introduction ... 1
1.1 Eukaryotic chromatin ... 1
1.2 Chromatin compaction affects transcription ... 1
1.3 Histone acetylation is a major mechanism of gene regulation ... 2
1.4 Plant histone deacetylases ... 5
1.4.1 HDACs involvement in plant development ... 8
1.4.2 HDACs in plant stress responses ... 12
1.5 Abscisic acid response ... 13
1.5.1 ABA in plant development ... 14
1.5.2 ABA involvement in abiotic stress response ... 15
1.6 Research objectives ... 19
Chapter 2: Materials and Methods ... 21
2.1 Generation of knockout and overexpression lines ... 21
2.2 Arabidopsis transformation ... 22
2.3 Measurement of germination success ... 23
2.4 Measurement of flowering time and rosette leaves ... 24
2.5 Drought and salinity treatments ... 24
2.7 Western blot analysis ... 28
2.8 Bimolecular fluorescence complementation ... 30
2.9 Statistical Analysis ... 30
Chapter 3: Results ... 32
3.1 Selection of HD2D knockout lines and HD2D overexpression lines ... 32
3.2 HD2D expression affects germination in the presence of ABA ... 36
3.3 HD2D prolongs vegetative growth phase and delays flowering ... 38
3.4 HD2D expression affects plant susceptibility to drought stress and salinity stress 43 3.5 HD2D affects transcription of development- and drought-related genes ... 47
3.6 HD2D expression does not affect global H3 and H4 acetylation ... 51
3.7 HD2D interacts with proteins involved in ABA signaling and other HD2 family members ... 53
Chapter 4: Discussion ... 57
4.1 HD2D is a positive regulator of the ABA stress response ... 57
4.2 HD2D prolongs the vegetative growth phase and delays flowering ... 64
Chapter 5: Future Perspectives ... 67
References ... 72
List of Tables
Table 1.1 HDAC families in Arabidopis ... 7
Table 2.1 Primers used in RT-qPCR analysis and cloning experiments ... 27
List of Figures
Figure 1.1 Histone acetylation affects DNA accessibility and transcription...…………...4
Figure 1.2 ABA signaling in the nucelus resluting in transcriptional activation of ABREs………...18
Figure 3.1 HD2D knockout and overexpression lines ... 34
Figure 3.2 HD2D transcript levels in HD2D knockout and overexpression plants ... 35
Figure 3.3 HD2D affects germination success in the presence of ABA ... 37
Figure 3.4 HD2D affects bolting time under LD and SD conditions ... 41
Figure 3.5 HD2D lengthens the vegetiative growth phase ... 42
Figure 3.6 HD2D affects plant survival under drought stress ... 45
Figure 3.7 HD2D affects plant survival under salinity stress ... 46
Figure 3.8 HD2D affects the transcript levels of of development- and drought-related genes ... 50
Figure 3.9 HD2D does not affect H3 and H4 global acetylation levels ... 52
Figure 3.10 HD2D interacts with members of the HD2 family ... 55
Figure 3.11 HD2D interacts with components of the ABA pathway ... 56
List of Abbreviations
ABA abscisic acid
ABI abscisic acid insensitive
ABRE abscisic acid response element
ANOVA analysis of variance
Arabidopsis Arabidopsis thaliana
BiFC Bimolecular fluorescence complementation
bZIP basic leucine zipper
CaMV 35s cauliflower mosaic virus 35s constitutive promoter
ChIP chromatin immunoprecipitation
co-IP co-immunopreciptation
ddH2O double-distilled H2O
DNA deoxyribonucleic acid
HAT histone acetyltransferase
HDAC histone deacetylase
K lysine (amino acid)
PCR polymerase chain reaction
PP2C protein phosphatase 2C
qPCR quantitative polymerase chain reaction
RCAR regulator component of abscisic acid receptor
SnRK SNF1-related protein kinase
T-DNA transfer DNA
TSA trichostatin A
Chapter 1: Introduction
1.1 Eukaryotic chromatin
The highly compact form of eukaryotic genomic DNA is, in part, due to its
association with histone and non-histone proteins to form chromatin (Sanchez et al., 2008).
The basic unit that makes up chromatin is a repeating nucleosome core wrapped by 146
base pairs of DNA that fold 1.65 times around the nucleosome in 7.6 super-helical turns of
DNA. The highly conserved nucleosome is made up of a histone octamer, consisting of
two of H2A, H2B, H3, and H4 histone proteins (Kornberg, 1974; Workman and Kingston,
1998; Verreault, 2000). This “beads on a string” model is stabilized by an additional
histone H1 protein present on the linker DNA between nucleosomes (McGhee and
Felsenfeld, 1980). The N-terminal tails of H2B and H3 histones have been shown to
directly interact with the DNA, aiding in compaction. Furthermore, the N-terminal tails of
both H3 and H4 histones are subject to post-translational modifications that can affect
chromatin compaction in adjacent regions (Workman and Kingston, 1998).
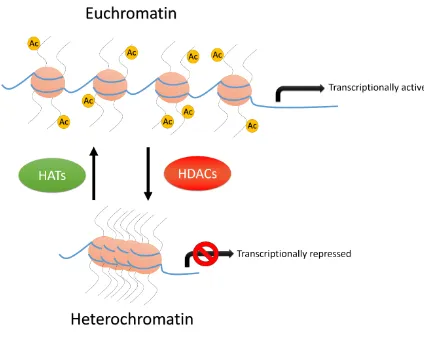
1.2 Chromatin compaction affects transcription
The level of chromatin compaction has very important implications for DNA
function, specifically transcription. Areas of lower chromatin compaction are referred to
as euchromatin and tend to be transcriptionally active. In contrast, regions that are more
compact are referred to as heterochromatin and tend to be transcriptionally inactive
(Sanchez et al., 2008). The influence of chromatin compaction on transcription is
associated with the ability of protein complexes and transcriptional machinery to access
The ability to regulate transcription by controlling the extent of chromatin
compaction is a powerful mechanism of controlling gene expression, playing an important
role in multicellular organisms in the development of different cell types (Margueron and
Reinberg, 2010). Chromatin is subject to many different modifications that can affect
transcription, some by changing chromatin conformation. The most well studied of these
modifications are the reversible processes of: DNA methylation, histone methylation, and
histone acetylation. These chromatin modifications are often referred to as epigenetic
modifications. Epigenetics is the study of heritable changes in gene expression that do not
result from changes in DNA sequence, most commonly referring to inheritance of
chromatin modifications (Gendrel and Colot, 2005).
1.3 Histone acetylation is a major mechanism of gene regulation
The control of chromatin compaction through histone acetylation is a rapid and
reversible process facilitated by two groups of enzymes: histone acetyltransferases (HATs)
that add acetyl groups to histones and histone deacetylases (HDACs) that remove the acetyl
groups. HATs and HDACs modify lysine (K) residues on the N-terminus of H3 (K9, K14,
K18, K27) and H4 (K5, K8, K12, K16, K20) histone tails (Hollender and Liu, 2008).
Hyper-acetylation of those H3 and H4 lysine residues is associated with euchromatic
regions and therefore with transcriptional activation (Fig. 1.1).
The presence of acetyl groups on K residues reduces chromatin compaction in a
number of ways. First, when bound to the histone tails, acetyl groups neutralize the positive
charge of the histone octamer, reducing its affinity for the negatively charged DNA.
maintain euchromatic conditions. Finally, acetyl groups physically disrupt higher order
chromatin folding, reducing compaction (Lusser et al., 2001). The activity of HDACs in
turn, by removing acetyl groups from the aforementioned K residues, would counter the
effects of HATs resulting in increased chromatin compaction (Fig. 1.1; Hollender and Liu,
2008). It is clear that the regulation of HAT and HDAC expression and activity is a major
1.4 Plant histone deacetylases
A number of epigenetic factors, particularly HDACs, have been the subject of
increased study in plants due to their involvement in many fundamental processes,
particularly: growth, development, and defense responses (Hollender and Liu, 2008). In
Arabidopsis thaliana (Arabidopsis), three HDAC families, with eighteen HDAC genes,
have been identified (Table 1.1). First, the RPD3-like family has been identified based on
its sequence homology to the yeast HDAC family RPD3 (reduced potassium deficiency 3).
The RPD3-like family has twelve members in Arabidopsis and it is the most extensively
HDAC family studied (Hollender and Liu, 2008). Second, the SIR2 family has been
identified based on its sequence homology to the yeast HDAC family SIR2 (sirtuin 2). The
SIR2 family has two members in Arabidopsis which have a conserved SIR2 domain that
makes their activity NAD (nicotinamide adenine dinucleotide)-dependent and is important
for binding both K residues and acetyl groups (Hollender and Liu, 2008). Lastly, the
plant-specific HD2 (histone deacetylase 2) family was identified in corn due to its histone
deacetylase activity (Lopez-Rodas et al., 1991). The HD2 family and has four members in
Arabidopsis which have a conserved EFWG domain essential for histone deacetylase
activity (Lusser et al., 1997; Wu et al., 2000).
The expression of specific HDAC genes in plants varies spatially and temporally,
even within the same HDAC families, suggesting a broad range of functional diversity
(Hollender and Liu, 2008). HDAC knockout and overexpression studies have shown that
HDACs can have widespread effects on gene expression. For example, when the globally
expressed RPD3-like member HDA19 is knocked out, 7% of the entire Arabidopsis
Knockout and overexpression studies have also been used to establish roles for HDACs in
the regulation of gene expression in a variety of plant processes related to plant growth and
development and both abiotic and biotic stress responses (Tian and Chen 2001; Zhou et al,
2005; Sridha and Wu, 2006; Chen et al., 2010; Chen and Wu, 2010; Colville et al., 2011;
Luo et al., 2012).
HDACs do not act alone, rather they interact with chromatin as part of multi-protein
complexes that are recruited to specific loci. The recruitment of HDACs occurs by direct
or indirect interaction with DNA-binding proteins (Reyes et al., 2002). For example,
HDA19 is recruited to the AGAMOUS (AG) locus by binding to the transcriptional
corepressor LEUNIG (LUG), which binds to DNA-binding proteins through the adapter
protein SEUSS (SEU) (Sridhar et al., 2004; Gonzalez et al., 2007). This complex is
responsible for the inhibition of AG transcription due to HDA19 deacetylase function
(Sridhar et al., 2004). It has become evident that HDAC repression complexes are involved
in a number of different processes and can contain multiple HDACs from different families
(Lu et al., 2012; Luo et al., 2012b; Luo et al., 2015). Furthermore, HDACs display some
degree of functional redundancy as some HDACs are involved in the regulation of the same
genes (Tanaka et al., 2008). In addition to interacting with each other, HDACs interact with
other epigenetic factors such as DNA and histone methyltranferases and demethylases.
These interactions have been shown to affect DNA methylation status, histone methylation
status, and histone acetylation status, affecting transcription (Yu et al., 2011; Song et al.,
Table 1.1 HDAC families in Arabidopsis
RPD3-like SIR2 HD2
HDA2 SRT1 HD2A (HDT1)
HDA5 SRT2 HD2B (HDT2)
HDA6 HD2C (HDT3)
HDA7 HD2D (HDT4)
HDA8
HDA9
HDA10
HDA14
HDA15
HDA16
HDA17
1.4.1 HDACs involvement in plant development
Members of the RPD3-like and HD2 HDAC families in Arabidopsis have been as
implicated having a regulatory role in developmental pathways since development-related
phenotypes are exhibited when their function is disrupted (Tian and Chen, 2001). This
became evident after treatment of Arabidopsis with the HDAC inhibitor trichostatin A
(TSA) that resulted in developmental defects, including: abnormal germination patterns,
early senescence, expression of silenced genes, floral defects, and sterility (Tian and Chen,
2001).
1.4.1.1
HDAC involvement in germination and post-germination growth
Histone deacetylases have been implicated in having a role during embryogenesis,
germination, and post-germination growth (Tai et al., 2005). For example, WT
Arabidopsis seeds sown on media with TSA displayed reduced germination success and
post-germination growth (Tanaka et al., 2008; van Zanten et al., 2014). Additionally, TSA
treatment resulted in the expression of embryogenesis-related genes that are normally
repressed after embryogenesis (Tai et al., 2005; Tanaka et al., 2008). Furthermore, Tai et
al. (2005) found that one day after imbibition there was a transient increase in HDAC
activity as well as decreased acetylation levels of H4 histones in the promoter and coding
regions of some of the same embryogenesis-related genes repressed during TSA treatment.
By using HDAC knockout studies, Tanaka et al. (2008) identified that the RPD3-like
family members HDA6 and HDA19 redundantly repress some embryogenesis-related
genes that were upregulated during treatment with TSA in a study by Tai et al. (2005). The
arrest and development of embryo-like features in hda6 and hda19 mutants (Tanaka et al.,
2008).
Although HDA6 and HDA19 promote seedling development and promote
germination by repressing embryogenesis-related genes, a related family member HDA9
represses seedling development and negatively regulates germination (van Zanten et al.,
2014). As such, WT plants have an upregulation of HDA6 and HDA19 transcripts during
germination and downregulation of the HDA9 transcript (Alinsug et al., 2009). Similarly
to HDA9, the HD-family member HD2A is a negative regulator of germination, as hd2a
mutants were found to have increased germination rates (Colville et al., 2011).
In addition to regulating germination and embryogenesis under control (untreated)
conditions, HDACs also affect germination when seeds are treated with the phytohormone
abscisic acid (ABA) (Sridha and Wu, 2006; Chen et al., 2010; Chen and Wu, 2010; Colville
et al., 2011). Arabidopsis lines mutated for hda6, hda19, or hd2c germinated normally in
untreated conditions but had significantly reduced germination rates after treatment with
ABA (Sridha and Wu, 2006; Chen et al., 2010; Luo et al., 2012). hda6 and hd2c mutants
had higher levels of H3K14 acetylation at the loci of a number of ABA response genes,
suggesting these HDACs operate directly at those loci (Chen et al., 2010; Luo et al., 2012).
In contrast, the hd2a mutant had increased germination rates during ABA treatment
(Colville et al., 2011). The fact that the effect on germination in hd2a mutants was opposite
to that of hd2c mutants, suggests functional diversity within the HD2 family (Colville et
al., 2011). These experiments show that HDACs are involved in the process of germination
1.4.1.2 The role of HDACs in controlling flowering time
The control of flowering time is composed of four floral induction pathways:
photoperiod, autonomous, vernalization, and gibberellic acid (GA) pathways (Corbesier
and Coupland, 2006). Each one of these pathways incorporates different internal or
external stimuli that affect flowering time. The floral induction pathways control gene
expression to promote or delay flowering and they converge at different points (Corbesier
and Coupland, 2006).
Histone deacetylation has been implicated in the switch from vegetative growth to
reproductive growth (bolting and flowering; He et al., 2003) and have been found to be
involved in multiple floral induction pathways. HDA6 has been found to be a positive
regulator of flowering time when Arabidopsis was grown under both long day (LD) and
short day (SD) conditions (Wu et al., 2008) by repressing the expression of FLOWERING
LOCUS C (FLC) (Yu et al., 2011). Since FLC is known to be a negative regulator of
flowering, its repression through the action of HDA6 resulted a delay in the transition to
flowering (Michaels and Amasino, 1999). Furthermore, HDA6 was found to control
flowering time as a part of a multi-protein repression complex (Yu et al., 2011; Luo et al.,
2015). HDA6 interacted with the histone demethylase FLOWERING LOCUS D (FLD) at
the locus of FLC, repressing its transcription (Yu et al., 2011). Arabidopsis plants mutated
at the fld gene were hyperacetylated at H4 at the FLC locus, highlighting the importance
of the interaction between FLD and HDA6 for deacetylation at the FLC locus. Recently,
the RPD3-like family member HDA5 has been identified as a part of the HDA6-FLD
repressor complex, as HDA5 interacted with both HDA6 and FLD to repress FLC
(Luo et al., 2015). Control of FLC expression is the convergence point of the vernalization
and autonomous pathways (Corbesier and Coupland, 2006). However, FLD is a component
of autonomous floral induction pathway, suggesting that the HDA6-FLD-HDA5 repression
complex is controlled by the autonomous pathway (Liu et al., 2015).
Some HDACs also affect flowering in an entirely different manner. In contrast to
the roles of HDA6 and HDA5, their RPD3-like family member HDA9 represses flowering
under SD but not LD conditions (Kim et al., 2013). hda9 mutants flowered earlier under
SD conditions, without affecting FLC expression. However, hda9 mutants did have higher
expression of the flowering activator AGAMOUS-LIKE 19 (AGL19), which activates
expression of genes downstream of FLC. HDA9 was found to associate with the AGL19
locus and hda9 mutants were found to have higher H3K9K27 acetylation levels at the
AGL19 promoter, promoting its expression (Kim et al., 2013; Kang et al., 2015). The fact
that HDA9 affected flowering only under SD conditions suggests that HDA9 controls
flowering time through the photoperiod floral induction pathway, as opposed to HDA5 and
HDA6 that operate through the autonomous pathway (Kim et al., 2013; Kang et al., 2015;
Liu et al., 2015).
There is evidence that members of the HD2 family are also involved in regulation
of flowering time. Zhou et al. (2004) observed that transgenic Arabidopsis overexpressing
the HD2A gene exhibited delayed flowering under LD conditions. Although no studies
have followed up on this observation, the HD2A protein has been found to interact with
HDA6 (Luo et al., 2012b), possibly working in a complex together that regulates flowering
time. These findings indicate that HDACs control flowering at multiple points of different
1.4.2 HDACs in plant stress responses
Epigenetic control of gene expression allows for rapid changes in gene expression
in response to changing environmental conditions, including many stress conditions that
can adversely affect plant health. HDACs have been implicated in the regulation of plant
stress responses to both abiotic (drought, salt, and cold) and biotic stresses (pathogen
infection).
Sokol et al. (2007) noted a rapid global increase in the acetylation of H3K14 and
H4 when subjecting Arabidopsis and Nicotiana tabacum cell lines to cold and salt
treatments. Furthermore, treatment with TSA resulted in the upregulation of the ABA
response element (ABRE) genes that have previously been shown to be upregulated in
drought, high salinity, and cold treatments (Tai et al., 2005). Furthermore, drought
treatment resulted in increased H3 acetylation of ABRE and dehydration response element
(DRE) genes resulting in an increase in their expression (Kim et al., 2008).
Sridha and Wu (2006) were the first to identify a specific role for an HDAC in
abiotic stress responses. Arabidopsis lines overexpressing the HD2 family member HD2C
were shown to have greater germination success and seedling survival rates under salinity,
ABA, and mannitol treatments. Consistent with that finding, Luo et al. (2012) found that
hd2c mutant Arabidopsis had decreased germination and survival rates when treated with
ABA and salt, along with decreased expression levels of a number of ABA-response genes
(Luo et al., 2012). Under control conditions, HD2C overexpression lines had increased
expression of a number of ABA response genes, indicative of an enhanced ABA response
HDACs from the RPD3-like family have also been implicated in ABA-response
(Chen et al., 2010; Chen and Wu, 2010). After treatment with ABA or salt, hda6 and hda19
mutant lines had decreased germination rates along with reduced expression of some ABA-
and salt-responsive genes (Chen et al., 2010; Chen and Wu, 2010; Luo et al., 2012).
Furthermore, the HD2C and HDA6 proteins interact to regulate expression of some
ABA-response genes (Luo et al., 2012) and HD2C was found to interact with HDA19 in vivo
(Luo et al., 2012b). Taken together, these studies suggest that HDA6, HDA19, and HD2C
may form a repressive complex that is required for full induction of ABA- and
salt-responsive genes (Sridha and Wu, 2006; Chen et al., 2010; Chen and Wu, 2010; Luo et al.,
2012).
1.5 Abscisic acid response
Plants respond to changing environmental conditions in a rapid and specific
manner. Environmental stresses are perceived quickly and the stress signal is rapidly
transmitted within the plant, leading to a quick and specific response. Plant hormones
(phytohormones) are central to the plants’ ability to rapidly respond to changing
environmental conditions, namely ABA. ABA acts as an endogenous chemical signal
during various developmental processes including seed maturation, seed dormancy,
germination, cell division, and floral induction. ABA also plays a predominant role in both
biotic and abiotic stress responses, including: drought, salinity, cold, and pathogen attacks.
Thus, ABA integrates developmental programs with stress responses (Finkelstein et al.,
1.5.1 ABA in plant development
ABA has been shown to play a fundamental role in many growth and
developmental programs, including germination and flowering time. ABA accumulation
in the seed leads to growth arrest, accumulation of storage proteins and lipids, and seed
dormancy, thus ABA negatively regulates germination (Finkelstein et al., 2002). ABA
signaling is used to properly time germination under the favourable environmental
conditions (Finkelstein et al., 2002). The application of exogenous ABA during imbibition
results in delayed seed germination. The ABA-dependent delay in germination has been
used to identify genes involved in the ABA pathway, by screening for mutants with an
ABA-insensitive (ABI) phenotype which does not result in a delay in germination,
indicative of an altered ABA response (Finkelstein and Sommerville, 1990).
Flowering time is affected by a number of internal cues (ie. plant size, age, and vegetative
nodes), external cues (ie. vernalization, photoperiod, and water availability), and external
stresses (ie. water deficit, nutrient deficiency, and overcrowding) (Levy and Dean, 1998).
Exogenous ABA application has been shown to delay flowering in Arabidopsis and a
number of other species, however, how ABA signaling integrates with the other flowering
pathways remain poorly understood (Conti et al., 2015)
On the molecular level, a number of genes involved in ABA signaling are also
involved in regulation of flowering time. For example, constitutive expression of the
CmMYB2 transcription factor increases sensitivity to exogenous ABA treatment while also
the ABA response gene ABR17 resulted in early flowering as well as increased germination
rates under salt stress conditions (Srivistava et al., 2006; Dunfield et al., 2007).
A number of transcription factors known to be upregulated by ABA and which are
involved in ABA dependent gene expression have been shown to affect flowering time
(Conti et al., 2015). For example, the transcription factors ABI3, ABI4, ABI5, which
belong to different gene families, positively regulate ABA dependent gene expression and
have been found to delay flowering when constitutively expressed (Kurup et al., 2000;
Wang et al., 2013; Shu et al., 2015). Specifically, constitutive expression of either ABI4 or
ABI5 has been found to cause an upregulation of the FLC transcript – known to negatively
regulate flowering (Wang et al., 2013; Shu et al., 2015).
1.5.2 ABA involvement in abiotic stress response
Although ABA signaling is involved in both biotic and abiotic stress responses,
much of the research has focused on abiotic stress response, specifically in response to
water deficit. Plants respond to water deficit by regulation of stomatal aperture, decreased
cell growth and photosynthesis, increased respiration, accumulation of osmolytes and
proteins, and induction root growth coupled with repression of shoot growth – all processes
ABA is involved in (Shinozaki and Yamaguchi-Shinozaki, 2007).
Lack of water uptake results in an increase in root apoplast pH, promoting ABA
mobilization from root cells into the xylem and eventually into the leaf apoplast.
Mobilization of ABA is followed by increased levels of ABA biosynthesis and decreased
ABA catabolism, in root and shoot tissues alike (Wilkinson and Davies, 2002; Hopkins
nucleus and extracellularly at the cell membrane (Cutler et al., 2010). There are a number
of ABA receptors, the best characterized being the RCAR/PYR/PYL (RCAR) receptors.
These receptors physically bind ABA intracellularly, an interaction that is promoted by
binding of protein phosphatase 2C (PP2Cs) co-receptors ABA INSENSITIVE (ABI)1 and
ABI2 to RCARs (Fig. 1.2; Cutler et al., 2010; Raghavendra et al., 2010). The ABI1 and
ABI2 proteins negatively regulate ABA response by dephosphorylating and inactivating
the SNF1-related protein kinases (SnRKs; Raghavendra et al., 2010). In the presence of
ABA, RCAR receptors bind ABI1 and ABI2, inhibiting their phosphatase activity and
allowing SnRKs to remain phosphorylated and active, inducing the ABA-response (Fig.
1.2; Raghavendra et al., 2010).
The ABA-induced stress response can be broken down to two levels involving the
signal transduction pathway described above. The first of wave responses immediately
limit water loss, while the second wave of responses deal with chronic water stress
conditions by inducing changes in gene expression (Cutler et al., 2010). The first wave
involves regulation of stomatal aperture to limit water loss and establish an equilibrium
between water supplied by the roots and water lost to transpiration at the leaf surface
(Wikinson and Davies, 2002). Stomatal closure is promoted by the loss of guard cell turgor
pressure, due to the phosphorylation of ion channels by active SnRKs, leading to an ionic
efflux (Raghavendra et al., 2010).
In addition to being the primary chemical signal to induce stomatal closure, ABA
induces large scale changes in gene expression (Cutler et al., 2010; Lee and Luan 2012).
There are a number of regulatory elements that are induced by ABA, of which
transduction pathway described above, activated SnRKs phosphorylate transcription
factors such as ABA-INSENSITIVE 5 (ABI5), a basic leucine zipper (bZIP) transcription
factor, in the nucleus (Fig. 1.2). In its phosphorylated form, ABI5 becomes active and binds
to ABREs, resulting in transcription of genes involved in ABA response (Cutler et al.,
2010; Raghavendra et al., 2010). For transcription factors to bind to ABREs and other
regulatory elements, chromatin must be in a less condensed state. Studies have shown that
ABA affects chromatin status (including histone acetylation), allowing for increased DNA
accessibility (Sokol et al., 2007). Although exogenous ABA treatment resulted in
approximately half of the genes affected being repressed, the mechanism of gene repression
Figure 1.2 ABA signaling in the nucelus resluting in transcriptional activation of
ABREs. The binding of ABA to RCAR (regulator component of ABA receptor) receptors
inhibits PP2Cs (protein phosphatase 2C) dephosphorylase activity and therefore allows
for the phosphorylation and activation of SnRKs (SNF1-related protein kinase). Once
active, SnRKs activate ABF (ABRE-binding factors) transcription factors by
phosphorylation. The phosphorylation of ABFs results in their stabilization and their
binding to ABRE (ABA response elements)-containing genes, induce their transcription
1.6 Research objectives
HDAC genes have been identified as important epigenetic regulators of ABA
responses during plant development and stress responses. Much research has focused on
the RPD3-like family of HDACs, despite increasing evidence for the involvement of the
HD2 family in development and stress response pathways (Zhou et al., 2004; Sridha and
Wu, 2006; Colville et al., 2011; Luo et al., 2012; Luo et al., 2012b). HD2D has been
suggested to have an important regulatory role in the ABA-dependent processes of seed
germination and seedling growth (Colville et al., 2011). Furthermore, HD2D transcript
levels are affected by exogenous ABA application (Sridha and Wu, 2006). Although
evidence supporting a role for HD2D in ABA regulated pathways has emerged, it remains
under-studied. Based on these findings, I chose to investigate the effects of HD2D
expression on ABA-related processes, specifically involving development and response to
water deficit. I hypothesize that HD2D regulates ABA-dependent developmental programs
and water deficit responses in Arabidopsis.
The objectives of the research were:
1. To demonstrate that HD2D affects the ABA-related processes of germination,
flowering, and water stress response
2. Investigate the effects of HD2D expression on ABA-related gene expression
3. Implicate a mode of action for the HD2D protein
These objectives will be accomplished by testing differences in germination, flowering
Furthermore, these lines will be tested for differences in ABA-related gene expression and
histone acetylation. Finally, I will test the HD2D protein’s in vivo interaction with
Chapter 2: Materials and Methods
2.1 Generation of knockout and overexpression lines
To test the effect of HD2D expression on ABA-related processes Arabidopsis
thaliana (Arabidopsis) of the Columbia-0 (col-0) ecotype HD2D knockout and HD2D
overexpression plants were used. An hd2d mutant (GABI-Kat_379G06), containing a
disruption in the second intron of the HD2D gene, was identified and seeds were ordered
from the Arabidopsis Biological Research Center (Columbus, OH). This mutant line was
generated using T-DNA (transfer-DNA) mutagenesis, where Agrobacterium tumefaciens
was used to transform Arabidopsis using T-DNA by the floral dip method (Kleinboelting
et al., 2012). The T-DNA insertions were then mapped and mutant lines were made
available to the public (Kleinboelting et al., 2012).
To screen for plants containing a homozygous mutation at the HD2D gene, DNA
was extracted from 4 week old seedlings and a PCR was employed to detect the T-DNA
insertion using two primers complementary to either side of the genomic DNA flanking
the T-DNA insertion site and another primer on the T-DNA sequence itself (Fig. 3.1A).
Once homozygous plants were identified, homozygous F3 seeds were generated and used
in all subsequent experiments. Plants with a homozygous insertion in the HD2D locus were
designated as hd2d-1.
In order to generate plants constitutively expressing HD2D, Gateway® cloning
(Hartley et al., 2000) was used according to the product’s instructions. Briefly, the HD2D
coding sequence was cloned using the HD2DattF and HD2DattR primers (Fig. 3.1B; Table
recombination proteins. The HD2D coding sequence flanked by the attB recombination
sites was transferred into the pDONR™221 plasmid using the Gateway® BP Clonase®
(Thermo Fisher Scientific cat. 11789-020) reaction mix. This reaction mix contains
integrate (Int) and integration host factor (IHF) proteins that recognize attB recombination
sites flanking the HD2D coding sequence and attP recombination sites on pDONR™221,
mediating the transfer of HD2D in pDONR™221 (Hartley et al., 2000). The
pDONR™221-HD2D vector was electroporated into Escherichia coli cells of the DH5α
strain. pDONR™221-HD2D plasmids were then isolated and sequenced. The HD2D
coding sequence was subcloned into the pEarleyGate101 destination vector (Earley et al.,
2006) using Gateway® LR Clonase® (Thermo Fisher Scientific cat. 11791-100) reaction
mix to form the pEarleyGate101-HD2D expression construct. The LR Clonase® reaction
mix contains Int, IHF, and excisionase, allowing for the cloning of HD2D coding sequence
into pEarleygate101, as described above (Hartley et al., 2000).
Vectors used in the bimolecular fluorescence complementation (BiFC) test were
generated using Gateway® technologies as described above using the ABI1, ABI2, ABI5,
HD2A, HD2B, and HD2C coding sequences. After the cloning of these coding sequences
into pDONR™221, Gateway® LR Clonase® mix was used to recombine each one of these
coding sequences (including HD2D) into pEarleyGate202-YC or pEarleyGate202-YN
(Tian et al., 2011; Luo et al., 2014).
2.2 Arabidopsis transformation
The pEarleygate101-HD2D construct described in 2.1 was electroporated into
the floral dip transformation method according to Zhang et al. (2006). To select
Arabidopsis seeds containing the transgene, seeds were plated on media containing half
strength Murashige and Skoog (MS) salts, 1% sucrose, 0.8% plant agar, brought to a pH
of 5.7 using KOH and with 10 µg/mL glufosinate ammonium antibiotic. Surviving
seedlings were transferred to soil and DNA was extracted to confirm the presence of the
transgene. F2 seeds were collected and plated on selection media (see above) to select
homozygous lines based on their segregation. Two HD2D homozygous overexpression
lines were selected and F2 seeds were used in all subsequent experiments, designated 1-1
and 4-1.
2.3 Measurement of germination success
An experiment was designed to determine the rates of germination in WT and
transgenic seeds. Seeds were surface sterilized with a 70% ethanol solution for 5 min,
followed by a solution of 20% bleach and 0.1% SDS for 15 min, shaking continuously, the
seeds were then rinsed 5 times with sterile ddH2O. Seeds were plated on control media
containing half strength Murashige and Skoog (MS) salts, 1% sucrose, 0.8% plant agar,
brought to a pH of 5.7 using KOH. Abscisic acid (ABA) treatment plates were identical to
control plates except that ABA was added to a final concentration of 1 µM. Petri dishes
containing the seeds were incubated at 4ºC for two days, to synchronize germination.
Germination was tracked once plates were removed from 4ºC (day zero) and incubated at
20ºC under long day conditions (16/8 hr light/dark cycle). To quantify germination success,
the number of seeds of each genotype that germinated was quantified every 24 hour for
five days. Each group (control, ABA) was made up of three petri dishes (N=3), each
2.4 Measurement of flowering time and rosette leaves
For the flowering time experiments WT, hd2d-1, 1-1, and 4-1 seeds were sown in
equal amounts of PRO-MIX® BX MYCORRHIZAE™ soil containing equal amount of
water to maintain moist soil. Seeds were sown in separate pots and placed at 4ºC for two
days, to synchronize germination. The pots were then placed in either long day (LD) or
short day (SD) conditions. For the LD treatment, the light conditions were 16 hours light
and 8 hours dark, each pot contained 9 plants from WT, hd2d-1, 1-1, or 4-1 with a total of
six pots per genotype (N=6). For the SD treatment, the light conditions were 8 hours of
light and 16 hours of dark, each pot contained 5 plants with a total of six pots per genotype
(N=6). In both the LD and SD treatments, the temperature was set to 23ºC in the light and
18ºC in the dark, at a constant humidity of 40%. A clear plastic cover was kept on the trays
for two weeks to reduce water loss at the soil surface while the seedlings were still young.
Each pot was rotated within the tray every two days and trays were moved within the
growth chamber on a daily basis, to prevent positional effects. Additionally, all pots were
watered equally to keep soil moist, using a serological pipette. Bolting was defined as
inflorescence emergence greater than 5 mm in length.
Rosette leaves were collected on bolting days from the experiment outlined above.
The rosette leaves were separated, counted, and photos of the individual leaves were taken.
Using the image processing program ImageJ, the total rosette surface area was measured.
2.5 Drought and salinity treatments
The drought and salt treatments had similar soil preparation, sowing conditions,
experiments, seeds of different genotypes were sown in the same pot so that each pot
contained three seeds of the WT, hd2d-1, and either 1-1 or 4-1 genotypes. This was done
to control for any potential differences in water loss between pots. For the drought
treatment, all plants were watered with equal amounts of water for thirty-five days in order
to keep soil moist. At day thirty-five, drought treatment groups had water withheld for
fourteen days and control groups continued to receive water regularly. Drought treatment
plants were then re-watered and were allowed to recover for two days, at which the percent
survival was scored. To ensure correct determination of plant death, all pots were regularly
watered and plants monitored for ten days after mortality. Susceptibility to drought
treatment was determined from 3 replicates for a total of 18-36 plants per genotype.
To examine salt tolerance, all plants were watered equally for thirty-five days to
keep soil moist. At day thirty-five, treatment pots started receiving 20 mL of a 200 mM
NaCl solution every 24 hours. To quantify the effects of the salt treatment on the plants,
leaf death was recorded. A leaf was considered dead when it exhibited greater than 50%
chlorosis. Measurements were taken on day fourteen and day twenty-one of the 200 mM
NaCl treatment. Susceptibility to salinity treatment was determined from 3 replicates for a
total of 18-36 plants per genotype.
2.6 RNA extraction, reverse transcription, and qPCR
RNA was extracted using TRIzol® Reagent (ambion®, cat.15596-026) from
complete rosettes (all leaves in the rosette) from thirty day old WT, hd2d-1¸ 1-1, and 4-1
homogenized using a mortar and pestle. In an RNase-free microfuge tube, 1mL of TRIzol®
was added to each sample, followed by 200µL of chloroform. Samples were centrifuged at
12000g for 15 min, at 4ºC, and the aqueous phase was transferred into new tubes and saved.
In order to precipitate the RNA, 0.5mL of 100% isopropanol was added to each sample
and kept at room temperature for 10 min. After centrifuging for 12000g for 15 min, at 4ºC,
the supernatant was discarded and the pellet (containing the RNA) was saved. The pellet
was washed three times with 1 mL of 70% ethanol per sample. Once ethanol was removed,
the pellet was re-suspended in 50µL RNase-free ddH2O. RNA concentration was
quantified using the NanoDrop™ 1000 Spectrophotometer. Samples were diluted to
100ng/µL and were treated with DNase I (ambion®, cat. AM2222) as per product
instructions, using the heat-inactivation of DNase I method to inactivate DNase I. RNA
samples were then converted to cDNA using iScript™ reverse transcription supermix
(BIO-RAD, cat. 170-8841), as per product instructions. The qPCR reaction mix used was
SsoFast™ EvaGreen® supermix (BIO-RAD, cat. 172-5200) and analysis was carried out
using the CX96™ Real Time System- C1000 Touch Termal Cycler. The Actin 2 gene was
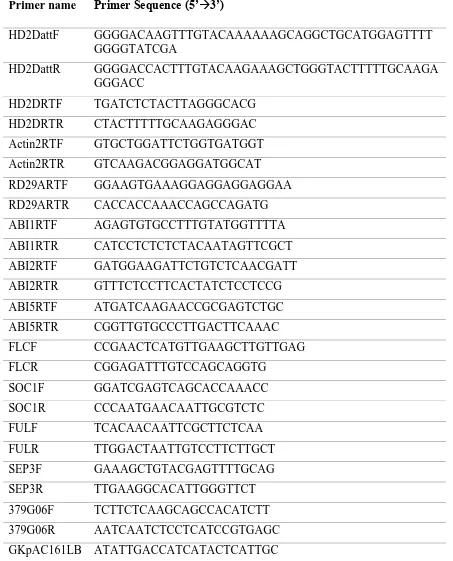
Table 2.1 Primers used in RT-qPCR analysis and cloning experiments
Primer name Primer Sequence (5’3’)
HD2DattF GGGGACAAGTTTGTACAAAAAAGCAGGCTGCATGGAGTTTT
GGGGTATCGA
HD2DattR GGGGACCACTTTGTACAAGAAAGCTGGGTACTTTTTGCAAGA
GGGACC
HD2DRTF TGATCTCTACTTAGGGCACG
HD2DRTR CTACTTTTTGCAAGAGGGAC
Actin2RTF GTGCTGGATTCTGGTGATGGT
Actin2RTR GTCAAGACGGAGGATGGCAT
RD29ARTF GGAAGTGAAAGGAGGAGGAGGAA
RD29ARTR CACCACCAAACCAGCCAGATG
ABI1RTF AGAGTGTGCCTTTGTATGGTTTTA
ABI1RTR CATCCTCTCTCTACAATAGTTCGCT
ABI2RTF GATGGAAGATTCTGTCTCAACGATT
ABI2RTR GTTTCTCCTTCACTATCTCCTCCG
ABI5RTF ATGATCAAGAACCGCGAGTCTGC
ABI5RTR CGGTTGTGCCCTTGACTTCAAAC
FLCF CCGAACTCATGTTGAAGCTTGTTGAG
FLCR CGGAGATTTGTCCAGCAGGTG
SOC1F GGATCGAGTCAGCACCAAACC
SOC1R CCCAATGAACAATTGCGTCTC
FULF TCACAACAATTCGCTTCTCAA
FULR TTGGACTAATTGTCCTTCTTGCT
SEP3F GAAAGCTGTACGAGTTTTGCAG
SEP3R TTGAAGGCACATTGGGTTCT
379G06F TCTTCTCAAGCAGCCACATCTT
379G06R AATCAATCTCCTCATCCGTGAGC
2.7 Western blot analysis
Acid-soluble proteins were extracted from the rosettes leaves of thirty-five day old
WT, hd2d-1, 1-1, and 4-1 plants. Leaves were flash frozen with liquid N2 and ground using
a mortar and pestle. Lysis buffer (0.25M HCl, 10mM Tris-HCl, 2mM EDTA, 20mM
β-mercaptoethanol, and 0.2M phenylmethylsulphanyl fluoride) was added to each sample on
ice and left for 10 min. Tissue was sonicated using the Fisher Scientific Sonic
Dismembrator Model 100 for five intervals of 10 seconds on ice. Sonicated tissue was
centrifuged twice at 12g for 15 min, saving the supernatant after each centrifuge step.
Protein was quantified using a Bradford assay with the Bio-Rad iMark microplate reader.
Samples were diluted so that each protein sample contained equal amounts of
protein. Samples were mixed with 10x Laemmli buffer (100mM Tris-HCl, 4% (w/v) SDS,
0.2% (w/v) bromophenol blue, 50% (v/v) glycerol, 200mM β-mercaptoethanol) on ice.
Samples were separated in a 10% polyacrylamide SDS-PAGE gel. Separated proteins were
transferred onto a methanol-activated Immu-Blot™ polyvinylidene fluoride (PVDF)
membrane (Bio-Rad, cat. 162-0177) using the Bio-Rad Trans-Blot® SD Cell for semi-dry
transfer. Membranes were blocked overnight using 5% (w/v) milk powder. Membranes
were incubated overnight with either the anti-histone H3, anti-histone H4, or the anti-H3
controls in 1% (w/v) milk (Table 2.2). Membranes were washed 5 times with tris-buffered
saline solution (5-10 minutes). Protein was visualized after membranes were treated with
EZ-ECL Chemiluminescence Detection Kit for horseradish peroxidase (Biological
Industries, cat. 20-500-500) as per the product’s instructions. ECL-treated membranes
were exposed to Mandel Bioflex MSI Film (Mandel Scientific, cat. MED-CLMS810). Film
Table 2.2 Antibodies used for Western blot experiments
Antibody name
Purification Host Supplier Catalog
number
Dilution
Anti-histone H3
Monoclonal Rabbit Millipore 05-928 1:7500
Anti-acetyl- Histone H3
Polyclonal Rabbit Millipore 06-599 1:1000
Anti-acetyl- Histone H4
Polyclonal Rabbit Millipore 06-866 1:10000
Anti-rabbit IgG (2º)
Goat Cell
Signaling
2.8 Bimolecular fluorescence complementation
Bimolecular fluorescence complementation (BiFC) experiments were carried out
according to Tian et al. (2011). Briefly, coding regions of ABI1, ABI2, ABI5, HD2A, HD2B,
and HD2C were cloned into pEarleygate202-YC while the coding region for HD2D was
cloned into pEarleygate202-YN, according to section 2.1. Each of these vectors was
separately transformed into Agrobacterium tumefaciens (GV3101). Fresh colonies were
prepared by picking single colonies to inoculate 5 mL of LB, containing 50µg/mL
kanamycin, 50 µg/mL gentamicin and 25 µg/mL rifampicin, and grown overnight at 28ºC.
Cells were pelleted at 1000g for 10 min and supernatant was discarded. Same volume
infiltration media (5 g/L glucose, 50 mM MES hydrate, 2 mM Na3PO4, and 0.1 mM
acetosyringone) was added to the pelleted cells and then centrifuged again. This step was
repeated two more times, each time breaking the pellet apart. Cells were finally
re-suspended in half volume infiltration media to concentrate the agrobacteria. A mixture of
HD2D-YN and each of the pEarleygate202-YC combinations was created at 50:50 ratios.
Nicotiana benthamiana plants were grown at long day (LD) conditions (16/8
light/dark) at 23ºC. Four week-old plant leaves were used for infiltration. 100µL of the
Agrobacterium mixture was used to infiltrate the abaxial side of the leaf. Infiltrated plants
were returned to the LD conditions for two days and YFP signal was observed every 24
hours after that using a Leica TCS SP2 confocal microscope.
2.9 Statistical Analysis
One-way analysis of variance (ANOVA) was used for all data analyses testing the
The one-way ANOVA was followed by a post-hoc Tukey test to compare the significance
of the differences between individual genotypes. All statistical analyses were performed
using the statistics program “R” version 3.1.3 Copyright© 2015 (The R Foundation for
Chapter 3: Results
3.1 Selection of
HD2D
knockout lines and
HD2D
overexpression lines
To evaluate the effect of HD2D expression on ABA-related processes, HD2D
knockout and overexpression lines were utilized. An Arabidopsis HD2D knockout line
(hd2d-1) of the Columbia-0 (col-0) ecotype was identified using an online database
(www.arabdiopsis.org) and subsequently ordered from the Arabidopsis Biological
Research Center (Columbus, OH). Figure 3.1A shows a schematic of the HD2D gene with
the T-DNA insertion in the second intron of the gene as mapped by Kleinboelting et al.
2012).
Seedlings were screened to confirm the presence of the T-DNA insertion in the
second intron of the HD2D gene. To confirm the insertion, a PCR was run on isolated
genomic DNA from hd2d-1 plants and the products were run on an agarose gel and
compared to WT genomic DNA (Fig. 3.1B). The data was also used to confirm the
homozygosity of the T-DNA insertion at both HD2D alleles in hd2d-1 seedlings. Seedlings
containing a homozygous T-DNA insertion had only one 614 base pair band on the agrose
gel. However, seedlings containing undisrupted HD2D alleles one 1007 base pair band, the
same size as WT genomic DNA (Fig. 3.1B). Heterozygous seedlings would have had two
bands, one at 614 base pairs and one at 1007 base pairs, however, no heterozygous
seedlings were recovered.
To generate the HD2D overexpression lines, the coding sequence of the HD2D
gene was cloned into the Gateway® vector pEarleygate101 (Fig 3.1C) (Earley et al., 2003).
construct into WT Arabidopsis (col-0), using the floral dip method of transformation.
Using PCR, five independent transgenic lines containing the transgene were identified (Fig.
3.1D). Two overexpression lines (1-1 and 4-1) were bred to homozygosity and enough
seeds were collected to be used in all subsequent experiments.
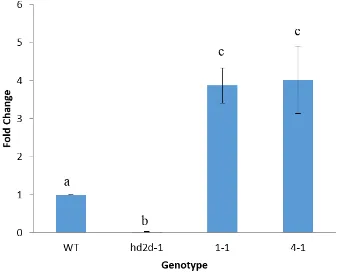
Using an RT-qPCR, the levels of the HD2D transcript were quantified in WT,
hd2d-1, 1-1, and 4-1 plants (Fig. 3.2). hd2d-1 knockout plants had limited HD2D transcript levels
detected, 0.01 ± 0.004 fold lower (p<0.001) than WT plants. The 1-1 and 4-1
overexpression lines were shown to have HD2D transcript levels that were 3.87 ± 0.46 fold
Figure 3.1 Generation of HD2D knockout and overexpression lines. (A) Schematic of the
HD2D gene containing a T-DNA insertion in the second intron (black line), separated by
exons (white boxes), and UTRs (shaded boxes) flanking the gene in the mutant line hd2d
-1 (GABI-Kat_379G06) as determined by Kleinboelting et al. (20-12). (B) The HD2D WT
allele was detected in WT but not hd2d-1 plants using primers a and b, whereas the T-DNA
insertion was detected in hd2d-1 but not WT plants using primers a and c. (C) Schematic
of the HD2D overexpression construct (pEarleygate101 backbone) inserted into WT
Arabidopsis, separated by right and left borders (RB/LB), containing the glufosinate
ammonium resistance gene (BAR), Cauliflower mosaic virus constitutive promoter (35S)
driving the expression of HD2D coding sequence with a yellow fluorescent protein marker
(YFP) on its C-terminus followed by an HA tag. (D) The T-DNA region of
pEarleygate101-HD2D vector was detected in five transformed lines but not in WT plants
using primers f and g. (primers: a:379G06F; b: 379G06R; c: GKpAC161LB;
Figure 3.2 HD2D transcript levels in HD2D knockout and overexpression plants.
Quantitative RT-PCR analysis indicated that the HD2D transcript was up-regulated in
HD2DOE (1-1 and 4-1) plants and down-regulated in hd2d-1 knockout plants. Transcripts
were detected using the primers d and e in fig. 3.1. Different letter indicate significant
3.2
HD2D
expression affects germination in the presence of ABA
Germination is a process that is affected by many factors such as water conditions,
light availability, temperature as well as proper ABA signaling (Finkelstein et al., 2000).
The effect of HD2D expression on germination was investigated using HD2D knockout
(hd2d-1) and overexpression lines (1-1 and 4-1). The percentage of germinated seeds of
WT, hd2d-1, 1-1, and 4-1 was examined in sterile conditions in the presence and absence
of 1 µM ABA. As mentioned in the Materials and Methods (section 2.3), germination was
defined as complete radicle emergence and scored every 24 hours after plates were
removed from 4ºC.
Under control growth conditions, no difference in germination success was
observed between the WT, hd2d-1, 1-1, or 4-1 lines on any of the days and all lines
achieved at least 94% germination by day two and 100% germination by day four (Fig.
3.3A). However, compared to control conditions, exposure to 1 µM ABA resulted in
delayed germination in all lines (Fig. 3.3A and B). Interestingly, the extent of the delay in
germination was genotype dependent. On day three, 74.1 ± 7.1% of WT seeds had
germinated, compared to only 18.5 ± 5.7% of the hd2d-1 knockout seeds (p<0.01), 40.1 ±
6.9% of the 1-1 overexpression seeds (p<0.05), and 35.2 ± 5.7% of the 4-1 overexpression
seeds (p<0.05). However, on day three no significant difference in germination percentage
was observed between the hd2d-1 knockout seeds and the two HD2D overexpression seeds
1-1 (p=0.17) and 4-1 (p=0.37). While ABA treatment resulted in delayed germination in
the hd2d-1, 1-1, and 4-1 lines, all seeds used in the experiment eventually germinated; WT
reached 100% germination by day four while hd2d-1, 1-1, and 4-1 had reached 100%
Figure 3.3 HD2D expression affects germination percentage in the presence of ABA.
Germination rate of WT, hd2d-1, 1-1, and 4-1 seeds over five days under control conditions
(A) and 1 µM ABA treatment (B). Mean ± SE values were determined from three replicates
(N=3) and a total of 108 seeds per genotype. (C) Visual comparison of wild-type, hd2d-1,
3.3
HD2D
prolongs vegetative growth phase and delays flowering
Proper timing of flowering is a process that is, in part, dependent on proper ABA
signaling (Rogler and Hackett, 1975). In order to investigate whether HD2D expression
affects flowering time, WT, hd2d-1, 1-1, and 4-1 plants were tracked under long day (LD)
and short day (SD) light conditions and the day when bolting has occurred was recorded.
Bolting is an indication of the switch from the vegetative phase to the reproductive phase
of plant growth and can be used as an indicator of flowering time. As mentioned in the
Materials and Methods (section 2.4), bolting was defined as inflorescence emergence
greater than 5 mm in length.
As shown in Figures 3.4A, under SD conditions, hd2d-1 plants bolted earlier than
the WT plants while the 1-1 and 4-1 overexpression plants exhibited a clear delay in
bolting. Specifically, on day forty-two, 57.8 ± 5.1% of hd2d-1 plants had bolted, compared
to only 24.0 ± 6.8% of WT that had bolted (p<0.001). No plants from the 1-1 and 4-1
overexpression lines had bolted by day forty-two, which was significantly less than the
bolting percentage of WT plants (p<0.05 for both). As shown in Figure 3.4A, even though
WT plants initially exhibited delayed bolting compared to hd2d-1 plants, the difference in
bolting eventually narrowed as hd2d-1 lines reached 100% on day forty-seven, a day earlier
than WT plants (day forty-eight). The 1-1 and 4-1 overexpression plants showed a similar
bolting pattern to each other, achieving 100% on day fifty-six, later than both the WT and
hd2d-1 lines.
It is well known that Arabidopsis, an LD plant, flowers earlier when day length is
day light) (Teper-Bamnolker and Samach, 2005). As seen in figure 3.4A and B, my results
support this earlier finding as, on average, all plants flowered earlier under LD conditions,
regardless of genotype. Similarly to the bolting patterns under SD conditions, on average,
under LD conditions hd2d-1 plants bolted earlier than WT plants, while 1-1 and 4-1
overexpression plants bolted later than the WT (Fig. 3.4B). By day twenty-nine, 89.8 ±
15.6% of hd2d-1 plants had bolted, compared to only 28.6 ± 11.7% of WT plants that had
bolted (p<0.001). However by day twenty-nine, only 5.6 ± 2.5% of 1-1 plants had bolted
and none of the 4-1 plants had bolted, much less than WT plants (p<0.05 and p<0.01,
respectively). Furthermore, by day thirty-six, 100% of hd2d-1 had bolted while WT, 1-1,
and 4-1 lines reached 100% bolting on days forty, forty-four, and forty-four, respectively.
These results demonstrate that increased HD2D is capable of delaying bolting under both
SD and LD conditions.
To investigate whether the delay in flowering was due to growth retardation or a
longer vegetative growth phase, the average number of rosette leaves was recorded at
bolting for WT, hd2d-1¸ 1-1, and 4-1 plants. Rosette leaf number is an indication of the
length of the vegetative phase. Plants with longer vegetative phases will exhibit a greater
number of rosette leaves at flowering, while plants exhibiting retarded growth will have
the same number of rosette leaves at flowering but will still flower later (Koornneef et al.,
1991). As shown in figure 3.5A and D, the level of HD2D expression had a significant
effect on the average number of rosette leaves at bolting (p<0.001). WT plants had an
average of 15.9 ± 1.05 leaves in their rosettes, less than the 1-1 overexpression plants
(p<0.001) which had an average of 25.0 ± 1.5 leaves in its rosette and less than the 4-1
and B), indicating that HD2D overexpression plants have longer vegetative phases than
WT plants. Interestingly, hd2d-1 plants had an average of 16.0 ± 0.61 leaves in their rosette
at bolting which did not differ from WT plants (p=0.70). However, when comparing the
total surface area of the rosette between the different lines, WT plants had a significantly
greater (p<0.05) total rosette leaf surface area than hd2d-1 plants (Fig. 3.5B and C),
indicating that hd2d-1 plants may have a shorter vegetative phase than WT plants. In
addition, 1-1 and 4-1 plants had significantly greater total rosette leaf surface area than WT
plants (p<0.001 and p<0.001, respectively), supporting the rosette leaf number results
which indicated that 1-1 and 4-1 overexpression plants had longer vegetative growth
Figure 3.4 HD2D expression affects bolting time under long day and short day conditions.
(A) Percent bolting of WT, hd2d-1, 1-1, and 4-1 plants under short day conditions over the
course of seventeen days. Mean ± SE values were determined from greater than six
replicates (total of 30-60 plants per genotype). (B) Percent bolting under long day
conditions of WT, hd2d-1, 1-1, and 4-1 plants over the course of twenty-one days. Mean ±
Figure 3.5 HD2D expression affects rosette leaf number and rosette leaf surface area. (A)
Mean rosette leaf number at bolting for WT, hd2d-1, 1-1, and 4-1 plants. Mean ± SE values
were determined from 4-7 replicates. (B) Visual representation of rosettes at bolting. (C)
Mean total rosette leaf surface area at bolting for WT, hd2d-1, 1-1, and 4-1 plants. Mean
± SE values were determined from 4-5. (D) Leaf number at bolting, beginning with true
3.4
HD2D
expression affects plant susceptibility to drought stress and
salinity stress
It is well established that ABA is a key player in the activation of stress responses
plants exhibit to both drought and high salinity conditions (Raghavendra et al., 2010).
Moreover, in recent years it has become evident that HDACs play a key role in ABA
signaling (Sridha and Wu, 2006; Chen et al., 2010; Luo et al., 2012). To examine the effect
of HD2D expression on drought tolerance plants of all four genotypes (WT, hd2d-1, 1-1,
and 4-1) were subjected to a desiccation regime (outlined in section 2.5). Interestingly, the
abundance of HD2D transcript did affect the survival of different genotypes during the
drought treatment (p<0.001; Fig. 3.6A and B). The hd2d-1 knockout plants were the least
resistant to the drought treatment with only 13.9 ± 5.01% of plants surviving, less than the
WT plants (p<0.001) of which 47.2 ± 5.01% had survived. The HD2D overexpression
plants were most resistant to the drought treatment with 83.33 ± 6.8% of 1-1 plants and
88.9 ± 3.93% of 4-1 plants surviving the treatment, both more resistant than the WT plants
(p<0.05 and p<0.001, respectively). To ensure estimates of plant mortality were accurate,
all plants were monitored for another ten days, all estimates were correct.
To examine the effect of HD2D expression on salt tolerance, all four genotypes
(WT, hd2d-1, 1-1, and 4-1) were subjected to the salt treatment. As outlined in section 2.5,
percent leaf death was measured and a leaf was considered dead when it exhibited greater
than 50% chlorosis. By day fourteen of the salt treatment, HD2D expression had a
significant effect on percent leaf death (p<0.001). However, the differences between the
genotypes were not completely evident until day twenty-one of treatment (p<0.001; Fig.
to be the most resistant to the salt treatment as 16.8 ± 1.6% of 1-1 leaves and 14.6 ± 2.2%
of 4-1 leaves had died, significantly lower (p<0.001 for both) than the WT plants of which
30.2 ± 1.9% of leaves had died. Interestingly, in response to the salt treatment only 36.2 ±
2.2% of the hd2d-1 leaves had died, not significantly different than WT leaf death (p=0.13).
The results of the drought and salt experiments demonstrated that HD2D is involved in
plant response to drought and salt conditions and that increased HD2D transcript levels