i
COMPETITION AND PROFITABILITY OF COMMERCIAL BANKS IN
KENYA
MDOE IDI JACKSON
ATHESIS SUBMITTED TO THE SCHOOL OF ECONOMICS IN PARTIAL FULFILMENT OF THE REQUIREMENTS FOR THE AWARD OF THE DEGREE OF DOCTOR OF PHILOSOPHY IN ECONOMICS OF KENYATTA UNIVERSITY.
ii
DECLARATION
This thesis is my original work and has not been presented for a degree in any other university or for any other award.
Signature:...Date:...
Mdoe Idi Jackson
BED (Arts) (Hons), M. Econ (Kenyatta University) Reg. No. K96/CTY/PT/22443/2012
We confirm that the work reported in this thesis was carried out by the candidate under our supervision.
Signature:...Date:...
Dr. Jacob O. Omolo
Senior Lecturer
Department of Applied Economics School of Economics
Kenyatta University Nairobi, Kenya
Signature:...Date:...
Professor Nelson H. W. Wawire
Associate Professor of Economics Department of Applied Economics
School of Economics Kenyatta University
iii
DEDICATION
iv
ACKNOWLEDGEMENT
v
TABLE OF CONTENTS
DECLARATION ... ii
DEDICATION ... iii
ACKNOWLEDGEMENT ... iv
TABLE OF CONTENTS ...v
LIST OF TABLES ...x
LIST OF FIGURES ... xi
ABBREVIATIONS AND ACRONYMS ... xii
OPERATIONAL DEFINITION OF TERMS ... xiii
ABSTRACT...xiv
CHAPTER ONE: BACKGROUND ...1
1.1 Introduction ...1
1.2 Importance of Bank Competition ...1
1.3 Banking Sector in Kenya ...3
vi
1.5Technological Advancements in Kenyan Banking Sector ... 15
1.6 Statement of the Problem ... 17
1.7 Research Questions ... 19
1.8Objectives of the Study ... 19
1.9 Significance of the Study ... 20
1.10 Scope of the Study ... 21
1.11 Organization of the Study ... 21
CHAPTER TWO: LITERATURE REVIEW ... 22
2.1 Introduction ... 22
2.2 Theoretical Literature ... 22
2.2.1 Risk Bearing Theory of Profits ... 22
2.2.2 Innovation Theory of Profits ... 23
2.2.3 The Neo-Classical Theory of Markets ... 24
2.2.4 Non-performance Dynamic methods ... 25
2.2.5 Performance Dynamic Method ... 27
2.3 Empirical Literature... 31
vii
CHAPTER THREE: METHODOLOGY ... 43
3.1 Introduction ... 43
3.2 Research Design ... 43
3.3 Theoretical Framework ... 43
3.3.1 Measuring Persistence of Profits and Bank Competition ... 44
3.3.2 Measuring Speed of Adjustment of Bank profitability to the Competitive Norm ... 46
3.3.3 Competitive Landscape and Bank profitability ... 46
3.4 Empirical Model ... 47
3.4.1 Level of Bank Competition in Kenya ... 47
3.4.2 The Speed of Adjustment of Bank profitability to the Competitive Norm ... 49
3.4.3 Effect of Changes in the Competitive Landscape on Bank Profitability in Kenya ... 51
3.6 Data Type and Sources ... 58
3.7 Sample Selection ... 59
3.8 Model Stability and Diagnostics Tests ... 60
3.9 Data Analysis ... 63
viii
4.1 Introduction ... 66
4.2 Descriptive Statistics ... 66
4.2.1 Summary Statistics of Bank Characteristics ... 66
4.2.2 Summary Statistics of Industry Wide Characteristics ... 69
4.2.3 Tabulation of Discrete Variables ... 71
4.3 Diagnostic Tests ... 72
4.3.1 Stationarity Tests ... 73
4.3.2 Data Smoothing ... 74
4.3.3 Choice of Optimal Lags ... 75
4.3.4 Choice of the Number of Instruments ... 78
4.3.5 Hausman Test ... 81
4.4 Empirical Results ... 82
4.4.1 The Level of Commercial Banks Competition in Kenya ... 82
4.4.2 The Speed of Adjustment of Bank Profitability to the Competitive Norm... 86
4.4.3 The Effect of the Competitive Landscape on Bank Profitability ... 88
CHAPTER FIVE: SUMMARY, CONCLUSIONS AND POLICY IMPLICATIONS .. 97
5.1 Introduction ... 97
5.2 Summary ... 97
ix
5.4 Policy Implications ... 101
5.5 Contribution to Knowledge... 109
5.6 Areas for Further Research ... 111
REFERENCES ... 112
x
LIST OF TABLES
Table 1.1: Mergers and Acquisitions in the Kenyan Banking Sector ... 13
Table 3.1: Definition and Measurement of Variables ... 57
Table 4.1: Overall Summary Statistics of Ratio Scaled Variables ... 67
Table 4.2: Summary statistics of firm Invariant variables ... 70
Table 4.3: Stationarity Test Results ... 73
Table 4.4: Determination of Optimal Lags of Normalized Return on Assets ... 76
Table 4.5: Determination of Optimal Number of Instrument ... 79
Table 4.6: Persistence of Bank Profits in Kenya ... 82
Table 4.7: Effect of Technology and Consolidation on Bank Profitability ... 89
xi
LIST OF FIGURES
Figure 1.1: Trends in net assets market share of banks by ownership ...4
Figure 1.2: Market share by bank size ...6
Figure 1.3: Trends in bank profitability and interest rate spread ...8
Figure 1.4: Trends in average lending rates and growth in bank profitability ... 10
xii
ABBREVIATIONSAND ACRONYMS
ATM Automated Teller Machines CBK Central Bank of Kenya CBR Central Bank Rate
CMSI Composite Market Share Index DEA Data Envelopment Analysis EAC East African Community
FE Fixed Effects Model
GDP Gross Domestic Product
GMM Generalized Method of Moments HHI Herfindahl-Hirschman Index KBRR Kenya Bank Reference Rate
KNBS Kenya National Bureau of Statistics
LI Lerner Index
LPPR Long run Projected Profit Rate PCM Price Cost Margin
POLS Pooled Ordinary Least Squares ROA Return on Assets
RE Random Effects Model
SOA Speed of Adjustment
xiii
OPERATIONAL DEFINITION OF TERMS
Competitive norm: Profitability that is consistent with long run perfect competition equilibrium. Also, referred to as long run projected profit rate
Competitive landscape: comprises of three components: change in technology, consolidation and regulatory changes
Exceptional profits: Profits that are inconsistent with the competitive level of profitability of a firm. Also, referred to as short run profits or abnormal profits
Intermediationinefficiency: A measure of efficiency of commercial banks‟ intermediation process. It manifests in form of wide interest rate spreads, high lending rates and exceptional bank profitability
Monopoly power: The ability of a firm to mark up the price above marginal cost
xiv
ABSTRACT
1
CHAPTER ONE
BACKGROUND
1.1 Introduction
This chapter presents the background to the study, statement of the problem, objectives of the study, research questions, significance, scope and the organization of the study.
1.2 Importance of Bank Competition
2
Applying the theoretical proposition to commercial banking, then the underpinning argument is thatexceptional bank profitability driven by high interest rates and wide interest rate spreads manifested in terms of high lending rates and low deposit ratesis a short run affair. Such a phenomenon would be corrected by competition in the long run(Chronopoulos et al., 2013). Competition is inherently determined by the market structure (Goddard, Liu, Molyneux and Wilson, 2011). In this context, it is the market structure that determines the non-competitive activities that a firm can engage in to protect its profit position or performance.
3
1.3 Banking Sector in Kenya
The banking sector in Kenya comprises of the CBK, as the regulator, 43 commercial banks, one mortgage finance company, eight representative offices of foreign banks, nine microfinance banks,two credit reference bureaus,13 money remittance providers and 87 foreign exchange bureaus (CBK, 2014). In terms of the ratio ofprivate credit to gross domestic product (GDP),the size of Kenya‟s banking ranged between 28.4 and 40 per cent from 2000 to 2014 (CBK, 2014; CBK, 2000). The size of the banking sector for comparator countries such as Uganda and Tanzania ranged between 10.71 and 16.40 per cent and 10.71 and 24.70per cent respectively for the period 2000 to 2014 (World Bank, 2014). In SSA,the average size of the banking sector ranged between 33.5 and 30.8 per cent for the period 2000 to 2014 (World Bank, 2014). Regionally, therefore, the Kenyan banking sector is large compared to that of comparator countries and exceeds the SSA average for the period 2011 to 2014.
4
per cent in 2006 to 31 per cent in 2014(CBK, 2014). These trends show that, indigenous private banks have not only dominated banking sector in terms of numbers but also in terms of net assets market share. The market share by ownership of Kenya‟s commercial banks has evolved as illustrated in Figure 1.1
Figure 1.1: Trends in net assets market share of banks by ownership
Source of Data: CBKBank Supervision Annual Reports (various issues)
Figure 1.1shows that domestic privately owned banks commanded the largest market share over the period 2006-2014. Figure 1.1 further shows that the dominance by the
0 10 20 30 40 50 60 70
2006 2007 2008 2009 2010 2011 2012 2013 2014
Government Owned Domestic Private Foreign Private Year
P
er
c
en
5
domestic privately owned banks is consistent throughout the period. Expansion in the market share of domestic privately owned banks is associated with contractions in the market share of local public and private foreign banks. The contraction and expansion of market share across the ownership categories shows a win for a particular category is characterized by a loss for the other categories. Therefore,competition is apparent among commercial banks in Kenya in relation to ownership.
In terms of bank size, the CBK has categorized the banks into three categories: large, medium and small banks. Between 2006 and 2009, a bank was considered large if its asset base exceeded KES15 billion; medium if its asset base ranged between KES5 billion and KES15 billion; and small if its asset base was less than KES5 billion (CBK, 2006). As of December 2009, the Kenyan banking sector comprised of 19 large sized banks, 14 medium sized banks and 12 small sized banks. The large banks had a cumulative market share of over 80 per cent in deposits, net assets and net advances (CBK, 2009). This means that commercialbanking in Kenya was dominated by large banks as of December 2009.
6
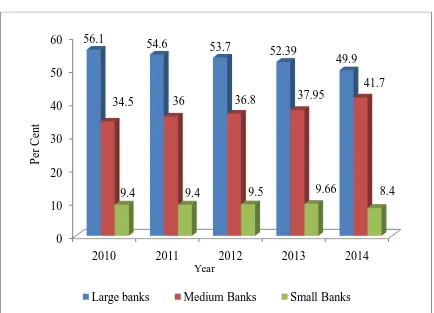
The evolution of bank market share based on the CMSI index among these three categories for the period 2010 to 2014is shown in Figure 1.2.
Figure 1.2: Market share by bank size
Source of Data: CBKBank Supervision AnnualReports (various issues)
Figure 1.2 shows that on average,53.3per cent of the banking sector in Kenya was controlled by large sized banks in terms of CMSI.Over the period 2010 to 2014, competition has intensified and the medium sized banks are gradually catching up with the large banks. The market share of medium sized banks has gradually increased from
0 10 20 30 40 50 60
2010 2011 2012 2013 2014
56.1 54.6
53.7 52.39
49.9
34.5 36 36.8 37.95
41.7
9.4 9.4 9.5 9.66 8.4
Large banks Medium Banks Small Banks
P
er
C
en
t
7
34.5 per cent in 2010 to 41.7 per cent in 2014 whereas that of large sized banks gradually declined from 56.1 per cent in 2010 to 49.9 per cent in 2014. Figure 1.2 further shows that the market share ofsmall sized banks marginally declined from 9.4 per cent in 2010 to 8.4per cent in 2014. This implies that though the small banks are the majority in terms of numbers in the banking sector, they do not pose much competition to the large banks. Though the competition posed by small banks to large banks is considered to be inadequate the level is unknown. However, knowledge of this level is significant for policy.
8
Figure 1.3: Trends in bank profitability and interest rate spread
Source of Data: CBKBank Supervision Annual Reports (various issues)
Figure 1.3 shows that interest rate spreads were 14.24 per cent in 2000 and 9.18 per cent in 2014. The spread sharply declined between 2002 and 2005 due to improvement in macroeconomic management occasioned by regime change in 2002. Between 2010 and 2011, the spread increased considerably due to the tough monetary policy stance adopted during the currency crisis of 2010 (CBK, 2010). After 2011, the spread declined gradually and assumed a long run trend. During periods of stable macroeconomic conditions such as 2005 and 2010, the spread remained relatively stable but high compared to monetary instruments signals such as the Central bank rate (CBK, 2014).
0 2 4 6 8 10 12 14 16 0 20 40 60 80 100 120 140 160
2000 2001 2002 2003 2004 2005 2006 2007 2008 2009 2010 2011 2012 2013 2014
Profitability Interest Rate Spread Central Bank Rate
9
The persistence of wide interest rate spreads even in periods of stable macroeconomic stabilitymeans that Kenyan commercial banks are inefficient in terms of intermediation efficiency. This may be explained by the high segmentation and domination of the banking sector by few large banks that experience inadequate competition from medium and small banks.
10
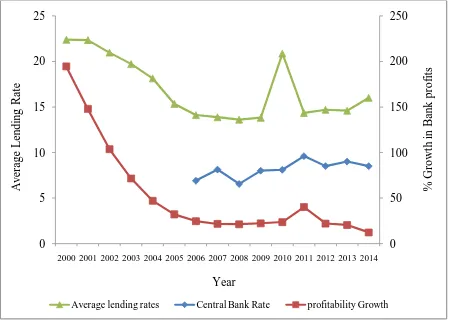
Figure 1.4: Trends in average lending rates and growth in bank profitability
Source of Data: CBKBank Supervision Annual Reports (various issues)
The trends depicted inFigure 1.4show that there has been a general decline in the lending rates and growth in bank profitability. As illustrated in Figure 1.4, movements in average lending rates and growth in bank profitability are highly correlated. For instance, the general decline in average lending rates between 2000 and 2010 is associated with a decline in profitability growth. Although the trend is generally declining the average lending rates are still high and tend to persist compared to monetary policy signals such as the central bank rate (CBK, 2013). Between 2005 and 2009 the relatively stable lending rates were associated with relatively stable growth in
0 50 100 150 200 250 0 5 10 15 20 25
2000 2001 2002 2003 2004 2005 2006 2007 2008 2009 2010 2011 2012 2013 2014
Average lending rates Central Bank Rate profitability Growth
11
bank profitability. Therefore, persistence of high average lending rates is associated with persistence of growth in bank profitability. Thus, the price charged on loans is one of the drivers of profitability growth in the Kenyan banking sector. This phenomenon may be explained by the fact that interest income is the core source of revenues among commercial banks in Kenya (CBK, 2014).
Figure 1.4 further shows that the growth in commercial bank profitability is characterized by decay. This means that bank profitability in Kenya is growing but at a declining rate. The decay in profitability growth wasrapid between 2000 and 2005 but slowed down afterwards. This shows that commercial banks profitability could be approaching a competitive norm (a long run value) as predicted by economic theory(Chronopoulos et al., 2013). The competitive norm and the speed of adjustment to the competitive norm is yet to be establishedfor the Kenyan banking sector.
1.4 Institutional, Legal and Policy Reforms in theBanking Sector in Kenya
12
on resilience and stability of banks. The Accords are international agreements which are not legally binding but are domesticated through legislations and policy guidelines. Basel I Accord was adopted in 1992 and later enhanced to Basel II standards. Basel III was domesticated by the Kenya Vision 2030, which focused on bank outreach and improved efficiency for stability and resilience of the Banking sector (CBK, 2008).
Intermediation efficiency in the banking sector is driven by competition(Chronopoulos et al., 2013). As such, institutional, legal and policy reforms have been mooted to spur competition among commercial Banks in Kenya through changes in the competitive landscape. The Kenya Vision 2030 acknowledges that Kenya‟s banking sector is highly segmented and dominated by a few large banks, resulting in reduced competition and high credit costs (Republic of Kenya, 2007). The government intervened through creation of incentives for the small banks to consolidate. Consolidation of the small banks was meant to enhance their capacity to compete with large banks and enable them to reap economies of scale in their operations and thereby help in narrowing the interest rate spreads (Republic of Kenya, 2007).
13
amendment was that high capital requirements would motivate the small banks to merge or seek other forms of consolidation. It was envisaged that the resulting banks from the mergers would be efficient due to economies of scale and enhanced capacity to compete with large banks. The upward revision of core capital to KES1 billion triggered mergers and acquisition as indicated in Table 1.1.
Table 1.1: Mergers and acquisitions in the Kenyan Banking Sector
Mergers
No. Institution Merged With Institution Formed Date Approved
1 Prime Capital & Credit Ltd.
Prime Bank Ltd. Prime Bank Ltd. 01.01.2008
2 CFC Bank Ltd. Stanbic Bank Ltd. CFC Stanbic Bank Ltd.
01.06.2008
3 Savings and Loan (K) Limited
Kenya Commercial Bank Limited
Kenya Commercial Bank Limited
01.02.2010
4 Equatorial
Commercial Bank
Southern Credit Banking Corporation
Equatorial
Commercial Bank
01.06.2010
Acquisitions
No. Institution Acquired by Institution Formed Date approved
1 EABS Bank LTD Ecobank Kenya LTD Ecobank Kenya LTD 16.06.2008
14
Table 1.1 shows that there have been four mergers and one acquisition after Banking Act (Cap 488) was amended in 2008. Three of the mergers namely,Prime Capital & Credit Ltd and Prime Bank Ltd;CFC Bank Ltd and Stanbic Bank Ltd; andEquatorial Commercial Bank and Southern CreditBankingCorporationwere mergers between medium and small banks as envisioned in the Kenya Vision 2030. However, contrary to the policy guidelines in the Kenya vision 2030, the mergers were not restricted tosmall banks.Savings and Loans limited, which was a small bank, for example, merged with a large bank, Kenya Commercial Bank. The implication is that the mergers and acquisition may have resulted in unintended gains by the large banks. The effect of this change in the competitive landscape in form of mergers and acquisition on competition and, therefore, profitability in the banking sector is still an empirical question.
The consolidation activities undertaken between 2008 and 2010 reduced the number of commercial banks from 45 in 2008 to 43 in 2012 (CBK, 2012). Between 2012 and 2014, there has not been any mergers and acquisition in the banking sector (CBK, 2014). Therefore, the enhancement of the core capital did not effectively address segmentation in the banking sector. Indeed, the composition of banks by size between 2010 and 2014 hasbeen six large sized banks, 15 medium sized banks and 23 small sized banks(CBK, 2014).Therefore, the composition of banks by size remained the same over the period 2010 to 2014. This means that the banking sector is still dominated by a few large banks, characterized by high cost of credit and exceptional bank profitability.
15
wasoperationalized in 2010 through the roll out of agency banking guidelines. The guidelines allowed commercial banks to contract third parties to conduct banking on their behalf (CBK, 2010). As a result,13 commercial banks were conducting business through 23,477 agentsas of December 2013which rose to 16 and 35,789 respectively in December 2014.
An evaluation of the distribution of agents revealed that the agents were not evenly distributed between banks (CBK, 2014). The agents are highly skewed in favour of three large banks that controlled 92per centof the agents (21,598 out of 23,477) in 2013 and 90 per cent (32,219 out of 35,789) of the agents in 2014 (CBK, 2014). This underscores the dominance that large banks have even on innovative channels that are meant to wrestle their market share. How, the level of competition and bank profitability in the banking sector are dependent on the adoption of agency banking and the skewed distribution of agents among banks, however,remain an empirical question.
1.5 Technological Advancements in Kenyan Banking Sector
16
The motivating factors for adoption of new technologies include extension of banking hours, improving service delivery, connecting customers to the bank system networks during and after working hours, branchless banking, decongesting banking halls and maintenance of big market shares (CBK, 2012). Commercial banks in Kenya, therefore, use technological advancements as a positioning and competition tool.
The most predominant form of technology used by commercial banks in Kenya is ATMs.The ATM system has evolved to become alternative delivery channel for services such as cash and cheques deposits and loan applications and processing.The number of ATMs rapidly increased from 1,827 in 2009 to 2,613 in 2014 (CBK, 2014). This unprecedented growth in the number of ATMs has increased access to consumers and intensified competition among the banks (CBK, 2014).
17
competitive landscape through adoption of technology has influenced profitability and competition among commercial banks in Kenya is still an empirical question.
1.6 Statement of the Problem
Exceptional bank profitability driven by high interest rates and wide interest rate spreads is a negative feature of financial intermediation (Flamini et al., 2009). Competition among commercial banks is critical in remedying this inefficiency. Over time, competition corrects high interest rate spreads and reduces exceptional profitability in the banking sector. In the long run and due to competition, bank profitability tends towards a long run value,which is the competitive norm (Chronopoulos et al., 2013). This means that, in the long run, bank competition should correct the market inefficiency of high cost of credit associated with exceptional profitability.
18
rectifyingintermediation inefficiency among commercial banks in Kenya is still unclear. In addition, how fast this level of competition is working on the intermediation inefficiency is also not clear.
To address this inefficiency, the government sought to spur bank competition through consolidation. The core capital requirement for banks was progressively raised from KES250 million in 2008 to KES1 billion in 2012 (CBK, 2008). This was meant to motivate the small sized banks to merge or seek other forms of consolidation. Increased core capital occasioned four mergers and one acquisition between 2008 and 2010. Between 2010 and 2014, there was inactivity in terms of consolidation with bank composition by size consisting of six large sized banks, 15 medium sized banks and 22 small sized banks. To solve intermediation inefficiency, it is important to establish how the negative feature of exceptional interest driven bank profitability and competition have been affected by changes in the competitive landscape in form of consolidation and changes in core capital requirements.
19
If unaddressed, persistence of intermediation inefficiency in form of interest driven exceptional bank profitability threatens achievement of improved intermediation efficiency, increased outreach and bank stability as outlined in international best practices. Previous studies on the Kenyan banking sector have focused on technical efficiency (Kamau, 2009); value effects of mergers and acquisitions (Muchai, Mburuand Obere, 2015) and role of increased capital requirements on stability and competition (Gudmundsson et al., 2013). None of these studies focused on competition and profitability of commercial banks in Kenya. This study, therefore, sought to investigate competition and profitability of commercial banks in Kenya.
1.7 Research Questions
This study sought to answer the following research questions:
i) What is the level of competition among commercial banks in Kenya?
ii) What is the speed of adjustment of commercial banks‟ profitability to the competitive norm in the banking sector in Kenya?
iii) What is the effect of changes in the competitive landscape on commercial bank profitability in Kenya?
1.8 Objectives of the Study
20
i) Ascertain the level of competition among commercial banks in Kenya
ii) Determine the speed of adjustment of commercial banks‟ profitability to the competitive norm in Kenya
iii) Investigate the effect of changes in the competitive landscape on commercial banks profitability in Kenya
1.9 Significance of the Study
This study is significant on several fronts. First, the study contributes to existing literature on competition and persistence of bank profits by presenting the Kenyan case. Secondly,the study contributes to the ongoing debate on interest driven exceptional bank profitability in Kenya. Thirdly, in establishing the relationship between bank profitability and the competitive landscape, the study unravels how bank profitability responds to regulatory, consolidation and technological changes in the Kenya banking sector. This is valuable in making insightful policy recommendations for consideration by the regulator, the CBK.
21
1.10 Scope of the Study
The study investigated competition and profitability of commercial banksin Kenya over the period 2001-2014. The period is significant since it coincides with liberalization of interest rates, implementation of Basel I Accord and enforcement of the Banking Act CAP (488). During this period, commercial banks were allowed to price loans, which aretheir main commodity.This implies that this study investigated competition and profitability of commercial banksin Kenya when market forces only were correcting inefficiency in the banking sector in Kenya. The study focused on 36 commercial banks that have been in existence since 2001-2014.
1.11 Organization of the Study
22
CHAPTER TWO
LITERATURE REVIEW
2.1 Introduction
This chapter presents the theoretical and empirical literature regarding the measurement of competition and the connection between competition and profitability. Section 2.2 reviews theories behind the measurement; Section 2.3 discusses the application of the theories in studies and inclusion of control variables while Section 2.4 concludes with an overview of the literature.
2.2 Theoretical Literature
Several theories have been advanced to explain why firms earn exceptional profits and how competition erodes them. This section reviews these theories and presents the twocompeting views on the measurement of competition and the connection between competition and profitability.
2.2.1 Risk Bearing Theory of Profits
23
entrepreneur(Cantwell, 2000). This theory is central to this study since it provides the basis of introducing bank risk exposures as an explanatory variable for profits. However, the theory is too simplistic since it considers profits as a function of risk bearingonly while ignoring other explanatory variables. In addition, the theory does not show the connection between profits and bank competition which is fundamental to the present study.
2.2.2 Innovation Theory of Profits
24
2.2.3 The Neo-Classical Theory of Markets
The Neo classical theory can be attributed to seminal contributions of Walras1889, Marshal 1890, Pareto 1906 and Hicks 1979(Mitra-Kahn, 2005).The theory argues that depending on a firm‟s or buyer‟s ability to influence price, marketscan either be competitive, oligopolistic, monopolistic competition, monopsony or monopoly (Varian, 2005). The two extreme cases in the continuum are perfect competition and monopoly. Under perfect competition neither the buyer nor seller (firm) has the ability to influence the price given quantity while under monopoly, the seller (firm) has absolute power to set the price given quantity (Varian, 2005). Measurement of competition is, therefore, a measure of a firm‟s power to influence price (Gudmundssonet al.,2013). Under perfect competition, the power to influence price is zero and is maximal under monopoly. Competition and the power to influence price are inverse (Varian, 2005). As such, competition is highest when the market structure is perfectly competitive and least under monopoly. This theory is relevant to the present study since it studies profitability and competition in a market set up. Further, it concretely provides for the measurement of competition through estimation of determinants of profitability through the performance dynamic approach and non-performance dynamics approach. However, the theory considers competition and profitability from a market perceptive only and does not show how other variables such as adoption of new technology and risk bearing affect profits.
25
2.2.4 Non-performance Dynamic methods
A common index for measuring competition is the Lerner Index (LI) or Price Cost Margin (PCM) attributed to Abba Lerner in 1934 (Elzinga and Mills, 2011). The Lerner Index measures competition using monopoly power. The index calculates competition using the following formula.
P MC monopoly power
P
(2.1)
Where 𝑝 is price and
𝑀𝐶 is the marginal cost
The index takes the value of zero if competition is perfect. The index takes a value greater than zero if a single firm has power to influence the price over and above the marginal costs. The value of the index approaches zero if competition is fierce and diverges away from zero if competition is low(Elzinga and Mills, 2011). For industries, the index is calculated as a simple or weighted mean of individual firm indices(Schiersch and Schmidt-Ehmcke, 2010). The weighted average is derived by calculating market shares of each firm and using them as weights.
26
recession. Thus both, competition among firms and the LI increase during recessions for firms and industries. For these failures, LI is less used as a measure of competition.
The present study borrows as well as deviates from the theoretical framework of LI. The study concurs with the underpinning framework for LI in the assumption that competition reduces a firm‟s ability to mark up the price above marginal costs. However, the study deviates from LI‟s static view by considering competition as a dynamic process.
Panzar and Rosse (1987) proposed a measure of competition known as the Panzar Rosse statistic or the H-statistic. The H-statistic is the sum of the elasticities of the reduced-form revenues with respect to the input prices. It ranges from -∞ to 1. A H-statistic equal to or smaller than zero (−∞ < 𝐻 ≤ 0 )indicates monopoly, whereas a statistic between zero and one (
0
H
1
) provides evidence of a range of oligopolistic or monopolistic types of competition. A value of H equal to one (H
1
) points to perfect competition. The H-statistic has been criticized for its static nature in contrast to the dynamic nature of competition (Schiersch and Schmidt-Ehmcke, 2010). As such, it only gives the level of competition for cross-sectional rather than time series or panel data.27
2.2.5 Performance Dynamic Method
Mueller (1977) is credited for originative ideas that heralded the measurement of competition via the dynamics of firm performance. The measurement is conceptualized for markets with free entry and exit. Entry and exit are, in this context considered sufficient enough to bring profitability quickly in line with the competitive norm(Mueller, 1977).
Mueller's(1977) starting point is in the short run and with a firm earning exceptional profits above or below the competitive norm. According to Mueller (1977), the competitive process begins with attraction of resources into activities earning more than the competitive norm and flow of resources from activities earning less than the competitive norm. In the long run, the flow of resources into and from an activity brings back profitability which is at the level of the competitive norm. When the competitive norm is achieved no firm is enticed to enter or exit an activity(Mueller, 1977).
28
The dependence of profits at one point on past values makes profitability a data generating process (Mueller, 1977). The process has memory and converges to a long run value overtime as illustrated in Figure 2.1.
Figure 2.1: Profit generating process
Adopted fromMueller, 1977 Pp 23 -150
-100 -50 0 50 100 150
1 2 3 4 5 6 7 8 9 10
29
Figure 2.1 shows that whether profits are low or high they will converge to the competitive norm. The convergence process is dynamic and smooth. Therefore, profits in a contestable market have a serially correlated data generating process (Chronopoulos et al., 2013). The level of serial correlation may even extend far into the past. Therefore, the profit data generating process is a stationary autoregressive (𝐴𝑅) process. This means that firm performance dynamics approach measures profit persistence and, therefore, the level competition using correlation coefficient.
The data generating process has to be stationary to allow convergence and stop profits from persisting unduly(Crespo and Gschwandtner, 2006). The 𝐴𝑅(1) process is commonly used to operationalize and estimate persistence of profits and competition in a market. Formally, the 𝐴𝑅(1) profit generating process equation is given by:
1
it i i it eit
(2.2)
Where it are profits for firm i in period t
it
e is white noise error term
i
is the permanent component of profits to the firm
i
is the coefficient of profitability in the previous period for the firm
30
andGschwandtner, 2008). For stationarity,
i 1, since firms cannot fully retain all their previous period profits. Whatever is not retained is assumed to have been eroded by competition. If i is close to one, profits persist and the level of competition is weak. When i close to zeroprofits do not persist and competition is high.The steady state equilibrium value of equation 2.2 to which the profit process asymptotically tends to is given by the unconditional expectation of it. This value is easily derived with the help of lag operators. Introducing lags in equation 2.2 yields:
it L i it i eit
(2.3)
Where L is the lag operator
Taking expectations on both sides and using the fact that L a( )a whenever 𝑎 is constant. The steady state value of profits is given by:
( ) 1
i it
i
E
(2.4)
Equation 2.4 is the long run projected profit rate (LPPR) and is a measure of that component of profits that is not eroded by competition and is consistent with the competitive norm. As stipulated by theory,if equation2.4 is the correct value of the long run profit rate then it must be the same for all firms(Cable and Gschwandtner, 2008).
31
addition, performance dynamics approach considers time and allows the estimation of the level of competition for a given period of time. Importantly, performance dynamics approach is more appropriatesince its estimation process provides for variations in the competitive landscape, which is a concern in the present study. Finally, performance dynamics approach connects competition and profitability. These are the twin concerns of this study.
Measurement of competition via performance dynamics provides a target profit rate as shown in equation 2.4. As a result, performance dynamics approach allows for the estimation of Speed of adjustment (SOA). The SOA measures the time that lapses between the move from an initial set of values of a variable to a target value of that variable (Arioglu and Tuan, 2014).
2.3 Empirical Literature
32
manufacturing industry. The present study borrows from Yurtoglu(2004) the use of firm level covariates as control variables in the estimation of the effect of changes in the competitive landscape on competition andprofitabilityof commercial banks in Kenya. In addition, the present study also borrows from Yurtoglu(2004) the use of banks that continually existed in the period 2001-2014 from this study.
Gschwandtner (2005) studied profit persistence in the long run using 85 survivor and 72 non-survivorfirms drawnfrom various industries in the US economy for the period 1950-1999. The study relied on data from Compustat database in the US. The study explored AR processes of up to four lags and selected the most appropriate using Akaike information criteria (AIC) and Schwarz Bayesian information criteria (SBIC). The study placed the firms in the competitive environment by including firm and industry characteristics such as market share, size of company assets, company growth rates and industry concentration.
33
places commercial banks in their competitive environment by incorporating firm and industry covariates in estimating the effect of changes in the competitive landscape on competition and profitability of commercial banks in Kenya.However, the present study deviates from Gschwandtner (2005) raw use of equation 2.2 as it assumed that the level of persistence in profits is common for all commercial banks. Thus, the present study assumes a panel rather than a time series design.
34
recommend country specific studies for precise conclusions, the present study sought to accomplish this task for Kenya.
35
Goddard, Liu, Molyneux and Wilson(2011) carried out a cross country study on persistence of bank profitability for a sample of 65 countries from developing and developed countriesfor the period 1997 to 2007 using bank level data. The study adopted equation 2.2 but assumed that the persistence parameter was country rather than firm specific. Therefore, the study used a time series design for each country. For its dynamic nature, the study estimated the variant of 2.2 using generalized method of moments (GMM). The study found that persistence in bank profits for developing countries appeared weaker than that of developed countries.This means that banking industries were more competitive in developing than in developed countries. This finding is contrary to conventional expectations on three accounts. First, developed economies are naturally considered to be more competitive than less developed ones (Gschwandtner, 2005). Thus, it is expected that persistence of profits would be stronger in developing than developed countries. Second, the study was a cross country one that used industry level data to draw conclusions. Flamini et al., (2009) observes that strong conclusion or policy recommendations cannot be arrived at from a cross country study such as this one. Third, industry level data involves aggregation of data for non-homogeneous products, which is empirically incorrect as observed by Mueller (1977). The present study contributed to this debate between expectations and the findings by Goddard et al.(2011)by estimating the level of competition in the Kenyan banking sector.
36
advantage of the opportunity presented by the large unbanked segment of the population in each country. The study applied the two non-performance dynamic approaches to bank-level consolidated financial data for the years 2001–2008.The study found thatthe degree of competition in the countries is low due to a combination of structural and socio-economic factors. The study further ranked the Kenyan banking sector as the most competitive compared to those of Tanzania, Uganda and Rwanda. This study was cross country and, therefore, could not have country specific conclusions. Further the study took a regional rather than a country specific perspective. As a result, the uniqueness of Kenya as the second largest banking sector in Africa was confounded by the pooling of observations from Kenya, Uganda, Tanzania and Rwanda. The present study overcomes these challenges by presenting a particular Kenyan case while using a more robust methodology rather than the non-performance dynamics approach.
37
Eklund and Desai (2012) carried out a cross country study on the effects of entry regulations on competitive markets and the speed of elimination of abnormal profits for 59 countries during the period 1998-2011.The study used performance dynamics approach to establish the level of persistence of profits and dummy variables to represent the body of entry regulations in each country. Lagged profits were interacted with dummies to establish the impact of regulation on profit persistence. Being a cross country study, it only made a generalized conclusion that regulation may speed or slow the competitive process in eliminating abnormal profits. The present study borrows the method of interacting dummy variables with the lag of profits to obtain the impact of regulations on bank profitability in Kenya. This is because regulation is a moderator rather than an exogenous variable in explaining persistence of profits.
38
' ' ' '
1 1 2 3( 1) 4 5
it i it BRt BRt it INDt Xit i eit
(2.6)
Where:
BR
Vector of variables capturing regulatory changeIND
Vector of variables capturing industry and economy wide covariatesit
X Vector of bank characteristics
i
Individual bank effects which could be random or fixed
The coefficient of lagged profits (1) gives the level of persistence before the bodies of regulations are effected. That is 1 before enactment of the regulations. After the regulations are implemented the level of persistence is given by the sum of parameters (coefficients) of lagged profits and the interactions. That is:
1 3BRt
(2.7)
39
Kenyan banking sector. Secondly, the present study estimated the speed with which bank profitability in Kenya is approaching the competitive norm.
Gudmundsson et al.(2013) studied the role of capital requirements on bank competition and stability in Kenya for the period 2000-2011. The study was motivated by the gradual raising of core capital from KES250 million in 2008 to KES1 billion in 2012. The study applied non-performance dynamics approach on data from 36 commercial banks.The study used the LI to measure competition for the banking sector over the period 2000 to 2011. The study used the estimates of the LI to run a regression analysis to find the effect of gradual increase in core capital on competition. The study found that core capital has nonlinear effects on competition. By using the LI followed by a linear regression, the study ignored the autoregressive nature of profits as discussed in section 2.1.2. This anomalylimited the strength of the study findings. Unlike the study by Gudmundsson et al.(2013), the present study is motivated by a host of other changes in the regulatory environment including the change in core capital. Further, the present studynot only estimates the level of competition using a different methodologybut also estimates the speed of adjustment of bank profitability to the competitive norm.
40
efficiency gains and shareholders‟ value effects. The study used DEA to estimate efficiency gains and events study methodology to assess stockholdersgains. The study usedsecondary financial firm level data from the period 1989 to 2010. The study found that though mergers and acquisitions led to improved profit efficiency, large banks benefited more from improved performance after merger and acquisition activities than the small banks. The study found that the larger the merged banking institution, the higher the probability of its success as a merger. This study is similar to the present study to the extent that the two studies focus on the same population. However, the focus is different to the extent that the present study investigates competition and profitability of commercial banks in Kenya whereas Muchai et al. (2015) focused on value effects of mergers and acquisition. In spite of the difference, the findings in this study imply that bank size is an important determinant of bank performance in Kenya. Therefore the study by Muchaiet al. (2015) forms the basis of inclusion of bank size as a determinant of bank profitability.
2.4 Overview of the Literature
41
As per the performance dynamics approach, the level of competition is entirely determined by the dynamic component onlyas given in equation 2.2. However, as per the risk bearing theory, innovation theory of profits and equation 2.6 as well as other empirical literaturesuch as Muchai et al.(2015), firm invariant determinants of profitability should be considered. These determinants include inflation and national income, and time invariant firm covariates such as bank size, asset growth, bank risks exposures, diversification, liquidity, bank capital, ownership structure and regulations. The current study will employ these covariates as appropriate. Due to the use of lagged profits as an explanatory variable most studies use system GMM estimator with Windmeijercorrection to estimate the variants of dynamic panel models presented in equation 2.2 and 2.6 (Chronopoulos et al., 2013). For consistency and comparability of estimates, the present studyborrowedthese estimation methods.
42
43
CHAPTER THREE
METHODOLOGY
3.1 Introduction
This chapter presents the methodology employed by the study. The sections included are the research design, the theoretical framework, empirical model, definition and measurement of variables, data types and sources, data analysis and diagnostic tests and estimation method.
3.2 Research Design
The study soughtto investigate competition and profitability of commercial banks in Kenya for the period 2001 to 2014andadoptsa non-experimental research design since it sought to examine competition and profitability of commercial banks in Kenyawithout any controls.
3.3 Theoretical Framework
44
3.3.1 Measuring Persistence of Profits and Bank Competition
Based on the neo-classical theory of markets and following Mueller (1977), firm
i s
'
profits at time t (
it) can be decomposed into the competitive return (
), firm specificreturn (
i ) and the transitory or short run rent (s
i ). That is:it i
s
it
(3.1)In the long run, competition in contestable markets is sufficient to eliminate the transitory component (
s
it) (Mueller, 1977). Therefore, it is this component that decays autoregressively. That is:1
it i it it
s
s
u
(3.2)Where
i is the proportion of period𝑡 − 1′𝑠 returns retained in period𝑡.u
it is a white noise error term.From equation 3.1
s
it
it(
i)
. Therefore,
1 1
it it i
s
(3.3)Substituting 3.3 in 3.2 and plugging the resulting solution in 3.1 yields
1
1it i i i it uit
45
Letting i and ito be the parameter estimates of equation 3.4, the autoregressive equation 3.4 becomes
1
it i i it
u
it
(3.5)Equation 3.5 is firm specific. It can be transformed to suit an industry by assuming that
i
and
i are constant across firms and overtime. This yields equation 3.6:1
it it
u
it
(3.6)Where 𝜆 is the industry level of persistence of profits in the short run. It is the proportion of the industry‟s period
t
1
returns retained in period 𝑡. Following Gschwandtner (2005) if
is high, short run rents persist and competition is weak (low). Also as argued by Yurtoglu (2004) if 𝜆 is low short run rents are eroded quickly and competition is strong (high).The unconditional expectation of equation 3.6 is
1
(3.7)
46
3.3.2 Measuring Speed of Adjustment of Bank profitability to the Competitive
Norm
The persistence of profit estimating equation 3.6 gives an estimate
that measures the persistence of bank profitability in the short run. According to Gschwandtner (2005), Yurtoglu, (2004), Cable and Gschwandtner (2008) and Goddard et al.(2011)
also helps in measuring the speed of adjustment of profitability to the long run projected profit rate. In particular, the speed of adjustment (SOA) is given by:1
SOA
(3.8)If 𝑆𝑂𝐴 in 3.8 is close to one, short run rents converge fast to the competitive norm. If close to zero, then short run rents converge slowly (Goddard et al.,2011).
3.3.3 Competitive Landscape and Bank profitability
47
the competitive landscape in the form of innovation (technology change), consolidation and regulation. Assuming a general functional form,bank profitability can be expressed algebraically as:
1
(
,
,
,
)
it
f
itTC Con BR
(3.9)Where
it1 is periodt
1
profitability of banki
TC
= Changes in technology, which is a proxy for innovationCon
= Consolidation𝐵𝑅= Regulation
3.4 Empirical Model
This section presents the empirical models thematically based on the study objectives. Section 3.4.1 presents the empirical model for estimating the level of bank competition in Kenya. Section 3.4.2 presents the empirical model for estimating the speed of adjustment of bank profitability to the competitive norm. section 3.4.3 concludes by presenting the empirical model of estimating the effect of changes in the competitive landscape on bank profitability.
3.4.1 Level of Bank Competition in Kenya
48
the level of persistence of profitability in the sector was estimated first. In the estimation of the level of persistence of profitability only the dynamic component is considered (Yurtoglu, 2004). According to Yurtoglu (2004), persistence profit is entirely a pattern of firm level profitability over time. This is consistent with literature such as Gschwandtner (2003);Yurtoglu, (2004);Gschwandtner (2005);Cable and Gschwandtner (2008) and Goddard et al. (2011). Therefore, the present study used the dynamic component only to estimate the level of profit persistence and therefore competition.
The persistence of profit estimating equation 3.6 was modelled and operationalized on a simple 𝐴𝑅(1). However, profits of all firms slowly converge with the profitability at one point being directly related to its past profit values even extending the time span far into the past (Pakes, 1987). Assuming the furthest past of 𝑝 periods, equation 3.6 was expressed as an 𝐴𝑅(𝑝) process as shown in equation 3.10.
1 1 2 2 3 3
...
it it it it p it p
u
it
(3.10)The short run industry wide level of persistence of profits was given by the sum of coefficients of the lags of profits as shown in 3.11 and as put forward by (Gschwandtner, 2005)
1
p i i
(3.11)49
lies between zero and one (Yurtoglu, 2004). A value of
close to zero implies high or strong level of competition while a value close to 1 implies low or weak competition. In literature, Gschwandtner (2003);Yurtoglu, (2004);Gschwandtner(2005); Cable and Gschwandtner (2008) and Goddard et al. (2011), values of
greater than 0.5 (50 per cent) are interpreted as high while values greater than 0.5 (50 per cent) are interpreted as low competition (Yurtoglu, 2004; Gschwandtner, 2005). In this study, the level of competition was given by:, 50% , 50% , 50% Low Moderate High Level of competition
(3.12)
Further, given 3.10, the level of competition as depicted in 3.12 erodes short run rents to the long run projected profit rate given by the unconditional expectation of equation 3.10 as shown in equation 3.13.
1 1 p i i LPPR
(3.13)The long run projected profit rate in equation 3.13 is that level of bank profitability that will never be eroded by bank competition and will persist indefinitely.
3.4.2 The Speed of Adjustment of Bank profitability to the Competitive Norm
50
generalization of the persistence of profit estimating equation to an 𝐴𝑅(𝑝) process, the speed of adjustment estimating equation 3.8was generalized to fit the 𝐴𝑅(𝑝) process. Specifically, the speed of adjustment was given by equation 3.14 as put forth by Gschwandtner (2005) as:
1 1
P i i
SOA
(3.14)The summation of i lies between zero and one (Goddard et al., 2011). Therefore, the speed of adjustment also lies between zero and one. If the speed of adjustment is greater than 50 per cent, short run rents converge fast to the competitive norm (Gschwandtner, 2005). However, if speed of adjustment is less than 50 per cent, then short run rents converge slowly to the competitive norm (Gschwandtner, 2005). If the speed of adjustment is equal to 50 per cent it implies that short run rents converge moderately to the competitive norm.
The half-life of the estimated SOA was given by
ln(0.5)
ln(1
)
HL
SOA
(3.15)51
3.4.3 Effect of Changes in the Competitive Landscape on Bank Profitability in
Kenya
The third objective of the study sought to determine the relationship between bank profitability and the competitive landscape in Kenya. Following the innovations theory (Schumpeter, 1943) and the performance dynamics approach (Muller, 1997), bank profitability is modelled as a function of previous levels of profitability, level of technology consolidation and regulation as shown in equation 3.9.
Profitability is not just a function of the dynamic component (previous levels of profitability) and the competitive landscape. According to Cantwell (2000), Mitra-Kahn (2005) and Gudmundsson et al. (2013) profitability is as well determined by risks faced by a firm, the market structure and firm characteristics.
In the context of the present study, the risks faced by commercial banks were either macro or micro in nature. According to Chronopoulos et al. (2013) and Flamini et al. (2009), the macro risks relevant to banks are movements in macro variables such as inflation and economic growth. In terms of micro risks, the most relevant to banks according to Chronopoulos et al. (2013) and Flamini et al. (2009) are credit, liquidity and capitalization risks.
52
ownership. Product offering manifests in the form of diversification in types of products offered by a bank.
Therefore, other than the determinants of profitability developed in sections 3.3.1 through 3.3.3, the present study considered bank profitability as function of static macro and micro determinants. Mathematically, the equation relating profitability and the competitive environment was extended to incorporate the risks faced by a bank, the market structure and bank characteristics as shown in equation 3.16.
1 2 3
(
,
,
,....,
,
,
,
,
,
,
, ,
,
, ,
)
it
f
it it it it pEG TC INF Con BRE BS D BC OS L BR
(3.16)Where
it j is periodt
j
profitability of banki
j1, 2,3,....,pEG
= Economic growthTC
= Technological changeINF
= InflationCon
= ConsolidationBRE
= Bank risk exposuresBS
= Bank sizeD
= Diversification53
OS
= Ownership structureL
= LiquidityBR
= Body of regulationsEquation 3.16 was parametized and expressed in vector form as in equation 3.17.
1 1 2 2 3 3
...
1 2it it it it p it p
IND
tX
it iu
it
(3.17)Where:
IND
is a vector of variables capturing industry characteristics and economy wide conditions as put forward in section 3.3.4. These characteristics consist of economic growth, technological change (proxied by the log of number of ATMs) inflation and consolidation as proxied by bank concentration using Herinfindahl-Hirschman Index (HHI).it
X
is a vector of bank characteristics which as informed by section 3.3.4 include bank risk exposures, bank size, diversification, bank capital, ownership structure, liquidity and body of regulationsi
is individual bank specific effects which could be random or fixedi
54
The models as specified in 3.16 and 3.17 are short run models since they depict partial adjustment process in bank profitability. Models with partial adjustments (dynamic models) are short run models (Baltagi, 2005). Therefore, model 3.17 captures only the short run effect of changes in the competitive landscape on bank profitability. To capture the long run effect the models were transformed into long run models by dropping the dynamic component (Baltagi, 2005; Verbeek, 2004). As such the long run specification of equation 3.16 was
(
,
,
,
,
,
, ,
,
, ,
)
it
f EG TC INF Con BRE BS D BC OS L BR
(3.18)Where profitability is considered to be a function of the static determinants only. The variables remain as defined in 3.16. When parametized, equation 3.18 becomes
0 1 2
it
IND
tX
it iu
it
(3.19)The variables remain as defined in 3.17.
To capture the short run effect of technological change on bank profitability in the Kenyan banking sector, the coefficient of log of the number of ATMs (growth in technology) in equation 3.17was interpreted. To get the long run effect of technological change on bank profitability in the Kenyan banking sector, the coefficient of log of the number of ATMs (growth in technology) in equation 3.19 was interpreted.
55
industry. To examine the long run effect of consolidation on profitability in the Kenyan banking sector, the coefficient of HHI index in equation 3.19 was interpreted.
To establish the effect of regulatory changes on bank profitability in the Kenyan banking sector, a dummy variable representing body of regulations (𝐵𝑅) was introduced in model 3.17. The introduction is based on the fact that banks block or enhance competition in form of patents that block imitation and encourage dominance or through compliance to new rules that keep off new entrants (Muller, 1977). The variable
𝐵𝑅takes a value of one when the regulations are in force and zero otherwise. The effect of regulation is assumed to be in the short run and acts together and through the dynamic component (lagged profits) (Chronopoulos et al., 2013). Therefore, 𝐵𝑅was interacted with previous period‟s profitability to examine its influence on persistence of previous period profits. Equation 3.20 shows introduction of 𝐵𝑅 in equation 3.17.
4 5 6
1 1
( )
p p
it j it j t j j it j t it i it
j j
BR BR IND X u
(3.20)Simplifying 3.20 yields:
4 5 6 1
( )
p
it j j j it j t t it i it
j
BR BR IND X u
(3.21)The coefficient of interest in equation 3.21 is
1
( )
p
j j j
j
BR
. When the regulation is in56
1 1
p p
j j
j j
(3.22)The variables remain as defined in equation 3.17.
To get the effect of the body of regulations on bank profitability the signage of
1
p j j
inequation 3.22 was considered. If the overall effect was negative, the 𝐵𝑅 would have enhanced competition and reduced profitability. If the sign was positive the regulation would have reduced competition and enhanced bank profitability. During the period 2001 to 2014, the key regulatory change with a direct influence on bank profitability was the amendment of the banking Act (Cap 488). The amendment progressively increased the core capital requirement from KES250 million in 2008 to KES1 billion in 2012.
The amendment triggered four mergers and one acquisition. The mergers were between Prime Capital & Credit Ltd and Prime Bank Ltd; CFC Bank Ltd and Stanbic Bank Ltd; and Equatorial Commercial Bank and Southern Credit Banking Corporation and finally between Savings and Loans limited and Kenya Commercial Bank. The consolidation activities reduced the number of commercial banks from 45 in 2008 to 43 in 2012 (CBK, 2012). Therefore, 𝐵𝑅took a value of zero before 2008 and a value of one from 2009 onwards. The coefficient of 𝐵𝑅 captured the effect of progressive increase of core capital requirement from KES250 million in 2008 to KES1 billion on bank profitability.
57
Table 3.1 presents the definition and measurement of dependent and independent variables that were used in the study.
Table 3.1: Definition and Measurement of Variables
Variable Definition Measurement
Profits, it Returns on Assets (ROA) of bank
i
in yeart