Scholarship@Western
Scholarship@Western
Electronic Thesis and Dissertation Repository
11-15-2017 1:45 PM
Design and Evaluation of Neurosurgical Training Simulator
Design and Evaluation of Neurosurgical Training Simulator
Trinette L. Wright Supervisor Roy Eagelson
The University of Western Ontario Co-Supervisor Sandrine de Ribaupierre
The University of Western Ontario
Graduate Program in Biomedical Engineering
A thesis submitted in partial fulfillment of the requirements for the degree in Master of Engineering Science
© Trinette L. Wright 2017
Follow this and additional works at: https://ir.lib.uwo.ca/etd
Part of the Biomedical Commons, Biomedical Devices and Instrumentation Commons, and the
Medical Education Commons
Recommended Citation Recommended Citation
Wright, Trinette L., "Design and Evaluation of Neurosurgical Training Simulator" (2017). Electronic Thesis and Dissertation Repository. 5115.
https://ir.lib.uwo.ca/etd/5115
This Dissertation/Thesis is brought to you for free and open access by Scholarship@Western. It has been accepted for inclusion in Electronic Thesis and Dissertation Repository by an authorized administrator of
i
Surgical simulators are becoming more important in surgical training. Consumer smartphone
technology has improved to allow deployment of VR applications and are now being targeted
for medical training simulators. A surgical simulator has been designed using a smartphone,
Google cardboard 3D glasses, and the Leap Motion (LM) hand controller. Two expert and 16
novice users were tasked with completing the same pointing tasks using both the LM and the
medical simulator NeuroTouch. The novice users had an accuracy of 0.2717 bits (SD 0.3899)
and the experts had an accuracy of 0.0925 bits (SD 0.1210) while using the NeuroTouch.
Novices and experts improved their accuracy to 0.3585 bits (SD 0.4474) and 0.4581 bits (SD
0.3501) while using the LM. There were some tracking problems with the AR display and
LM. Users were intrigued by the AR display and most preferred the LM, as they found it to
have better usability.
Keywords
Augmented reality, virtual reality, Leap Motion, Unity3d, Google cardboard, NeuroTouch,
ii
Co-Authorship Statement (where applicable)
This thesis is presented in the integrated article format, I wish to acknowledge the work of
co-authors.
Chapter 2 co-authors:
Ryan Armstrong assisted in the development and testing of the application. He also
contributed to the writing of the manuscript. Roy Eagleson and Sandrine de Ribaupierre
assisted in the study design, and in the review of the manuscript.
Chapter 3 co-authors:
Roy Eagleson and Sandrine de Ribaupierre assisted in the study design, and in the review of
the manuscript.
Chapter 4 co-authors:
Roy Eagleson and Sandrine de Ribaupierre assisted in the study design and testing, and in the
iii
Acknowledgments (if any)
I would like to acknowledge my supervisors and advisory committee for their guidance and
iv
Table of Contents
Abstract ... i
Co-Authorship Statement (where applicable) ... ii
Acknowledgments (if any) ... iii
Table of Contents ... iv
List of Tables (where applicable) ... vii
List of Figures (where applicable) ... viii
Chapter 1 ... 1
1 Introduction ... 1
1.1 Surgical Training ... 1
1.1.1 Surgical Training Simulators ... 2
1.2 Ventriculosmy Procedures ... 2
1.3 Virtual Reality and Display ... 3
1.3.1 Virtual Reality Environments ... 3
1.3.2 Head Mounted Display ... 3
1.4 Virtual Realty Medical Simulators ... 5
1.5 Measures of Performance ... 5
1.6 Research Question ... 7
Chapter 2 ... 8
2 Medical Simulation System Using Google Cardboard and Vuforia ... 8
2.1 Introduction ... 8
2.2 Methods... 10
2.3 Results ... 15
2.4 Discussion ... 16
v
Chapter 3 ... 18
3 Targeting Performance of Leap Motion In An Augmented Reality Environment ... 18
3.1 Introduction ... 18
3.2 Methods... 20
3.2.1 Sphere Targeting Tasks... 21
3.2.2 Shape Tracing Tasks ... 25
3.3 Results ... 28
3.3.1 Sphere Targeting ... 28
3.3.2 Shape Tracing ... 33
3.4 Discussion ... 48
3.4.1 Sphere Targeting Tasks... 48
3.4.2 Shape Tracing Tasks ... 49
3.5 Conclusion ... 50
Chapter 4 ... 51
4 Leap Motion Simulator Design and Evaluation ... 51
4.1 Introduction ... 51
4.2 Methods... 52
4.3 Results ... 60
4.4 Discussion ... 73
4.5 Conclusion ... 74
Chapter 5 ... 75
5 Conclusion ... 75
5.1 Simulator design ... 76
5.1.1 HMD ... 76
vi
5.1.3 Leap Motion ... 77
5.1.4 VR and AR Environment ... 77
5.2 Future Directions ... 78
References ... 79
vii
List of Tables (where applicable)
Table 1: Average targeting accuracy and task completion times by participant. ... 15
Table 2: Average time, average combined distance and average distance in each direction for
all users based on all target tasks. ... 32
Table 3: Average time, average combined distance and average distance in each direction for
viii
List of Figures (where applicable)
Figure 1: Google cardboard 3D glasses contain two optical lenses and a space for the
smartphone at the front. The glasses have an action button to increase the interactive
experience the user has with the virtual environment. ... 4
Figure 2: Image features created by Vuforia. These points are used to calculate the distance and angle between the image and the smartphone camera. ... 9
Figure 3: The duplicated camera view that when used in combination with the Google cardboard 3D glasses, the user is presented with the stereoscopic view. ... 11
Figure 4: The base image for the simulator with the associated virtual mannequin head. ... 11
Figure 5: The tool image and the associated virtual tool. ... 12
Figure 6: The set up of the physical tool with the tool image... 12
Figure 7: A participant placing the virtual tool through the longest axis of the visible ellipsoid. ... 13
Figure 8: The selected position of the tooltip with the purple sphere shown as visual feedback for the user. ... 14
Figure 9: The experimental setup for this simulator. ... 15
Figure 10: The LM controller with the 3D axis labeled. ... 19
Figure 11: The setup of the smartphone with the LM controller. The LM uses a USB connector, so a USB to micro USB converter was needed to connect the LM directly to the Nexus 5. ... 20
Figure 12: Location of all spheres within the AR environment... 21
ix
Figure 14: The virtual robotic hands used in the application. The virtual hands mimic the
movements of the users hands when held above the LM. ... 23
Figure 15: The setup for the sphere targeting tasks with a participant. ... 23
Figure 16: The screen view of the application as seen by the participants. The arrows at the
top of the screen as for switching between spheres and the green button at the bottom of the
screen records the position of the virtual index finger when pressed. ... 25
Figure 17: The first three shapes the participants were asked to trace. ... 25
Figure 18: Examples of the change in orientation, position and size for the three different
shapes that were presented to the participants. ... 26
Figure 19: The base image for all shapes. A) The image selected. B) The image and a circle
from a Unity scene. C) The same scene when run through the application on the smartphone.
... 26
Figure 20: The view of the first tracing task to the user. When the participant was ready to
start tracing, they pressed it and began tracing. The colour of the button changed to indicate
the position information of the index finger was being recorded. The arrows at the top of the
screen allowed the user to move between shapes. ... 27
Figure 21: The information recorded from Unity. The path of the index finger is shown in
yellow with the outside edge of the sphere shown in blue. The corners of the base image are
shown in red. ... 28
Figure 22: The distance from the center of the sphere to the fingertip for all participants.
Correct fingertip positions are shown in blue. ... 29
Figure 23: The task completion times by user. ... 30
Figure 24: The distance from the sphere center to the fingertip position in the x direction
x
Figure 25: The distance from the sphere center to the fingertip position in the y direction
(height direction). ... 32
Figure 26: The distance from the sphere center to the fingertip position in the z direction
(depth direction). ... 32
Figure 27: The fingertip path split into before the record button had been pressed, in yellow,
and after the record button had been pressed, in purple. The outside edge of the shape was
shown in blue with the corners of the base image shown in red. ... 328
Figure 28: The fingertip path after the record button has been pressed for a “good” trace. ... 35
Figure 29: The fingertip path after the record button has been pressed for a “poor” trace. ... 35
Figure 30: The distance from the center over time. A) The “good” trace in blue, the
calculated edge of the circle in red. B) The “poor” trace in blue, the calculated edge of the
circle in red. ... 36
Figure 31: The maximum distance for this “good” trace was the top yellow line and the
minimum distance was the bottom yellow line... 37
Figure 32: The maximum distance for this “poor” trace was the top yellow line and the
minimum distance was the bottom yellow line. The bias was the difference between the
minimum and the edge of the circle, as shown in red. ... 37
Figure 33: The speed and accuracy of circle tracing for all participants ... 39
Figure 34: The circle tracing times for all participants ... 40
Figure 35: The fingertip path of a “good” trace after the record button has been pressed. The
participants path is shown in yellow, the outside edge of the square is shown in blue and the
corners of the base image are shown in red. ... 40
Figure 36: The distances between the fingertip and the outside edge of the square for the
xi
Figure 37: The fingertip path of a “poor” trace after the record button had been pressed. The
participants path is shown in yellow, the outside edge of the square is shown in blue and the
corners of the base image are shown in red. ... 42
Figure 38: The distances between the fingertip and the outside edge for the square for the
“poor” trace. ... 42
Figure 39: The speed and accuracy of each square traced by side for all participants ... 43
Figure 40: The square tracing times for all participants. ... 44
Figure 41: The fingertip path after the record button had been pressed for a “good” trace. The
fingertip path is shown in yellow, the outside edge of the triangle is shown in blue and the
corners of the base image are shown in red. ... 44
Figure 42: The distance between the fingertip position and the outside edge of side one of the
triangle for the “good” trace. ... 45
Figure 43: The fingertip path after the record button has been pressed for a “poor” trace. The
fingertip path can be seen in yellow, the outside edge of the triangle can be seen in blue and
the corners of the base image can be seen in red. ... 45
Figure 44: The distances between the fingertip position and the outside edge of the triangle
for the “poor” trace. ... 46
Figure 45: The speed and accuracy for the triangle traced by side for all participants.. ... 47
Figure 46: The triangle tracing times for all participants. ... 48
Figure 47: The multi-image cube for overlaying the virtual objects on to the physical
simulator. ... 52
Figure 48: The transparent virtual head overlaid with the physical head. ... 53
Figure 49: The stereoscopic view of the simulator through the Google Cardboard glasses. .. 54
xii
Figure 51: The NeuroTouch tool had to be placed on the physical skull and orientation so that
the trajectory from the end of the tool would pass through the longest axis of the visible
ellipsoid. ... 56
Figure 52: The LM virtual hands could pass through the virtual head so the index finger could be placed through the ellipsoid. ... 56
Figure 53: The interface of the program used to copy the position and location of the NeuroTouch tooltip and the task completion time. ... 57
Figure 54: An example of one of the ventricles with the right anterior horn highlighted in red. ... 57
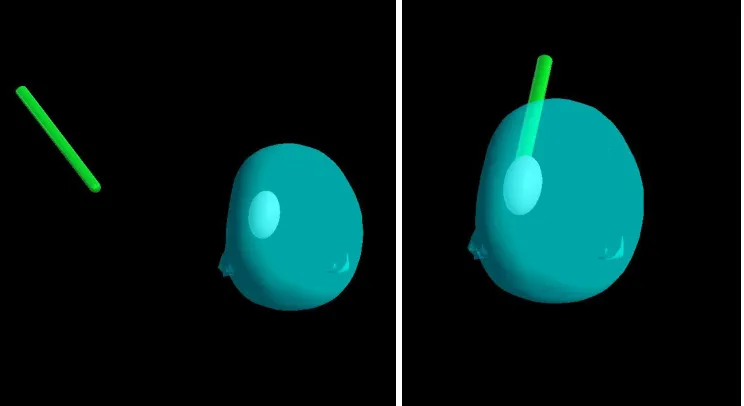
Figure 55: An example of how a user would place the NeuroTouch tool so that the trajectory from the tooltip would pass through the highlighted region of the ventricle... 58
Figure 56: An example of how a user would place the LM index finger so that it passes through the highlighted region of the ventricle... 59
Figure 57: The setup of the NeuroTouch. ... 59
Figure 58: The setup of the LM. ... 60
Figure 59: An example of a “correct” trajectory through the right anterior horn. ... 60
Figure 60: An example of a “correct” trajectory and its center through the right anterior horn. ... 61
Figure 61: An example of a “good” participant trajectory through the right anterior horn using the NeuroTouch. ... 62
Figure 62: An example of a “poor” participant trajectory through the right anterior horn using the NeuroTouch. ... 62
xiii
Figure 64: An example of a “poor” participant NeuroTouch trajectory in red with the
“correct” trajectory in gold. ... 63
Figure 65: The entire path a participant moved their index finger, in red, before selecting the final trajectory. ... 63
Figure 66: An example of a “good” participant trajectory through the right anterior horn using the LM. ... 64
Figure 67: An example of a “poor” participant trajectory through the right anterior horn using the LM. ... 64
Figure 68: An example of a “good” participant LM trajectory in red with the “correct” trajectory in gold. ... 65
Figure 69: An example of a “poor” participant LM trajectory in red with the “correct” trajectory in gold. ... 65
Figure 70: Novice distance performance for the NeuroTouch. ... 66
Figure 71: Expert distance performance for the NeuroTouch. ... 66
Figure 72: Novice angle performance for the NeuroTouch. ... 67
Figure 73: Expert angle performance for the NeuroTouch. ... 68
Figure 74: Novice distance performance for the LM... 69
Figure 75: Expert distance performance for the LM. ... 69
Figure 76: Novice angle performance for the LM. ... 70
Figure 77: Expert angle performance for the LM. ... 71
Figure 78: The average novice task completion times for both NeuroTouch and LM. ... 72
Chapter 1
1
Introduction
The use of surgical simulators as a method of training is a growing field of research.
Computer graphics are improving rapidly, which aids in the creation of more realistic
simulators. Virtual and augmented reality (VR and AR respectively) are areas being
explored for the creation of new simulators. The technology used in the display of VR is
also experiencing rapid advancement, leading to more commercially available and
user-friendly devices. Some companies are taking advantage of the technology contained
within smartphones, a device many consumers now own, to create light weight head
mounted displays (HMD) for virtual environments. The purpose of this research is to use
the advancements in consumer technology to create a medical simulator and assess both
its performance and usability.
1.1
Surgical Training
Surgical training is a very important area of study, as designing a training program that
requires fewer hours but does not negatively affect the skills acquisition by students is
incredibly difficult. There have been ethical and safety concerns raised about some of the
traditional training methods [1][2][3]. These include concerns about patient safety and the
ethical use of cadavers in procedure training [2]. Training with cadavers also has a
disadvantage in that performing procedures in this environment is not the same as
performing these same procedures on a real patient [3]. Surgical training must help students
with acquiring the skills they need, ensure high retention of those skills, and must help with
transferring those skills to the trainees’ future working environment. Additional resources
to help with training are beneficial as they improve patient safety, enhance the training of
residents and surgeons, and reduce surgical error [4]. In addition, surgical procedures are
becoming more complex, so additional training methods are advantageous. Surgical
simulators have been gaining acceptance in this field, as they provide educators with an
1.1.1
Surgical Training simulators
Surgical training simulators have been around for many years, but owing to technological
advances, they are becoming more accessible and accurate. Factors such as graphics,
haptics, and tissue deformation all affect the realism of the simulator, so there have been
many research studies focusing on investigating these areas [5][6][7][8]. Simulators can be
used to teach and practice procedures before students and residents preform them on live
patients [1]. Simulators can offer students feedback on their performance and can be used
to track skill acquisition and improvement [4]. Simulators will be an important facet for
training in new and emerging areas of medicine, such as robotic and minimally invasive
surgery [1]. Surgical trainers are very expensive which, unfortunately limits the educational
institutions that can provide these systems to students [9]. This is often due to proprietary
hardware contained within the devices [10]. Much of the cost of these simulators is due to
the high-resolution displays that are needed to provide the immersive environment.
Immersive environments have been seen to improve skill retention for spatial tasks and
have been found to reliably assess and train surgical skills [11][12]. Additionally,
interactive 3D models have been found to aid in trainees’ skill and knowledge acquisition
[13]. Stereoscopic displays aid in the immersive and interactive environments, and afford
many benefits in the medical domain.
1.2
Ventriculosmy Procedures
Many types of procedures can be simulated using training simulators. Endoscopic Third
Ventriculostomy (ETV) is a neurological procedure that residents frequently perform [14][
15]. The procedure is usually performed without medical imaging guidance and is done at
a patient’s bedside. It is important to place the catheter correctly into the ventricle so that
pressure is relieved and prevents any lasting neurological damage [16][15]. There have
been many ETV simulators designed, specifically one that has been developed by the
National Research Council of Canada (NRC) is the NeuroTouch device [17]. Over 20
Canadian research hospitals worked in partnership with the NRC to develop the
NeuroTouch [17]. The NeuroTouch device uses a mechanical arm in combination with
graphics for simulation of several types of procedures. Although this system is very
1.3
Virtual Reality and Display
1.3.1
Virtual Reality Environments
VR and AR are areas that have been greatly impacted by technological advances in recent
years [19][20]. While VR is made completely of virtual objects in a virtual environment,
AR overlays virtual objects onto the real world as seen through a camera [21][22]. These
technological advances have increased accessibility for developers and reduced costs for
consumers [19][20]. A number of video game platforms have been created that aid in the
development of VR and AR applications. The most popular platforms are Unreal, Valve
and Unity [23]. These platforms allow for the development of easily deployable virtual
applications. They have also improved the environment around developing these
applications, which means more developers are able to create virtual environments. In
particular, Unity has some advantages including cross platform development [24][25]. This
means applications can be created and deployed on a wide range of devices from iOS, to
Android and Windows [24][25]. This is very appealing to developers, as separate
applications for the systems do not need to be developed. Unity is also advantageous as it
allows for the integration of different devices into the environment. Different types of
interaction methods can be used such as image tracking, and applications can be developed
that mix virtual and augmented reality environments. Other devices such as different
displays and controllers may also be integrated into the Unity environments.
1.3.2
Head Mounted Display
The viewing of virtual reality is moving away from the traditional method of viewing
using a large screen, towards a more immersive method of Head-Mounted Displays
(HMD) [26]. HMDs improve the user experience over the traditional method by allowing
the user to be surrounded by the virtual environment while providing users the freedom to
easily move through the virtual world [27][28]. HMDs should have good resolution, a
wide field of view, low latency, contain positional and rotational sensors, and be
relatively light [28][29], as these parameters affect the immersive experience of the
device [28]. Advances in technology such as screen resolution and positional tracking
displays used for VR were either a dual projection system or a costly headset. Tracking of
head movements provided additional difficulties, as an optical or electromagnetically
tracked system was needed [30]. There are several popular devices that are now
commercially available including the Oculus Rift, HTC Vive, and the Microsoft
HoloLens. These are HMDs that developers can specifically develop and deploy new
virtual environments on. These are untethered devices; therefore, all hardware, including
sensors and camera, is contained within the device [31]. Most of these devices were
developed by the video game industry; however, their use as medical training tools and
simulators is something that is currently being explored. An issue with these devices is
they are still expensive for most consumers. Companies such as Google and Samsung
have recently designed different HMDs that use a consumer’s smartphone [32]. Virtual
reality environments can be designed and deployed using most smartphones
[20][32][33][34]. The user would need to purchase an inexpensive set of 3D glasses to be
able to view the environments [20][32][33][34]. The smartphone can be placed in the
glasses and the user can wear them like the previously mentioned HMDs (Fig. 1).
Figure 1: Google cardboard 3D glasses contain two optical lenses and a space for the
smartphone at the front. The glasses have an action button to increase the
These types of systems are easier for consumers to purchase and use, as most people have
a smartphone that is powerful enough to run the VR applications. There has also been a
lot of advancement in the technology, particularly with respect to the graphics, display
and positional sensors within the phones, which has led to more powerful gyroscopes that
help make applications much more immersive for the users [35]. The google cardboard
glasses contain optical lenses with an outer shell that holds the smartphone in place to
uses the phone as the display. However, the glasses limit the amount of interaction that
can occur between the user and the VR environment. Some interaction can be done using
the action button contained on the glasses. Another method of creating this interaction is
to combine the glasses with another input method. One of the more popular interaction
methods is the hands and body free method [36]. There are a number of devices that can
be used to achieve this including the Leap Motion hand controller [37]. Although the use
of smartphones as a display for virtual environments has some advantages, there are some
limitations. The main limitation is the field of view, which is much smaller for
smartphones as compared to systems that contain a display [31]. They also require a
different method for providing a stereoscopic view of the virtual environment.
1.4
Virtual Realty Medical Simulators
Mobile phones are beginning to be targeted by developers for medical simulators [37].
There have been previous attempts to lower the cost of these immersive virtual training
simulators. HMDs have improved greatly to the point where they are capable of displaying
high resolution images such as CT and MRI scans [27]. Immersive virtual environments
have been developed for purposes such as anatomical education and surgical planning
[27][38][10]. With more affordable and powerful smartphones being developed, the
smartphone is becoming a very appealing platform for the development of surgical
simulators by developers and educators.
1.5
Measures of Performance
For simulators to be an effective training tool, they must provide feedback to the users
about their performance and be designed so that users can easily interact with them [39].
HCIs it is important to predict how a user will interact with the device [39]. A common
method of measuring performance of an HCI is using Fitts’ Law. Fitts’ Law is most easily
described as being the trade-off between speed and accuracy when performing a targeting
task [41] and is used as a quantitative measure for describing the HCI [40]. The Fitts’ Law
relationship shows that as a user is faster completing a targeting task, they become more
inaccurate [40].
T = 𝑎 + 𝑏 ∗ 𝑙𝑜𝑔2( 𝐴
𝑊+ 1) (1)
T is the time it takes to complete the pointing task, a and b are empirically determined
constants, A is distance between the starting point and the target, and W is the width of the
target [40]. The index of performance (ID) is the measure of how difficult a task is to
complete and is described by:
I𝐷 = 𝑙𝑜𝑔2(𝐴
𝑊+ 1) (2)
The more difficult a task is, the higher the value of the ID will be [40]. However, Fitts’
Law only addresses movement in 2 dimensions. Fitts’ Law can be modified so that it is
predictive of movement through a tunnel instead of movement between two points:
T = 𝑎 + 𝑏 ∗𝐴
𝑊 (3)
With the ID as:
I𝐷 = 𝐴
𝑊 (4)
This is because the difficulty of traveling through this tunnel is related to the relationship
between A/W and the logarithm of A/W [40]. When using it to compare movements in 3
dimensions, such as those in a surgical simulator, a modified equation is needed [40]. These
types of 3D movements have presented some different challenges then those in 2D [42]. In
3D, objects are more commonly used than points, so Fitts’ Law can be modified so that the
instead of the width of the target [43][42]. These concepts will be used when calculating
the performance of users while they are using a 3D simulator.
1.6
Research Question
The purpose of this research is to design an affordable, easily accessible and robust virtual
reality simulator for neurosurgical procedures, specifically EVT procedures. To make this
simulator affordable and highly accessible for students, the simulator should run on
commercially available, inexpensive hardware and software. Most students have access to
a smartphone, which makes it the ideal choice for a virtual reality display. This will also
reduce the cost of the simulator as students will not need to purchase an additional device.
They will need a pair of 3D glasses that the smartphone will fit in. Fortunately, due to the
popularity of the Google cardboard glasses, the cost of a pair of these glasses is relatively
inexpensive. The simulator should also record all movements completed by the users. This
will aid in assessing the performance of the students, and the overall usability of the
simulator. The simulator should be robust and have high repeatability as students would be
using it as a training tool. Performance evaluation will be done using a modified Fitts’ Law
equation as all tasks the users will complete will be in 3D. Different tasks have been
designed that will test the performance of the simulator. Users will be asked to complete
simple pointing and tracing tasks to achieve this. The simulator will then be tested against
the NeuroTouch medical simulator to assess the performance with that of a commercially
available simulator. The next three chapters describe the evolution of the proposed
Chapter 2
2
Medical Simulation System Using Google Cardboard
and Vuforia
An affordable virtual reality simulator has been designed using the video game design
engine Unity and the image tracking software Vuforia. This system has been implemented
using the Google Cardboard 3D glasses for stereoscopic vision. The simulator was assessed
by creating ellipsoid targeting tasks. This comprised of placing a virtual tool through the
longest axis of each ellipsoid. The system was tested using eight participants and the overall
system performance was measured by user targeting accuracy.
2.1
Introduction
The purpose of this initial study was to design a simulator that is low cost and easily
accessible for all users. HMDs are the cost common way for virtual environments to be
displayed [26]. Technological advances and prevalence of smartphones have made them a
good platform for developing low cost, easily accessible environments [22]. Unity3d is a
popular video game design engine that has been used to develop all virtual environments.
This program allows for cross platform development, which is advantageous for this
application as it can be developed and released for many different mobile devices, such as
Android and iOS [24][25]. Unity also allows for integration with other programs, such as
image tracking. Image tracking is a popular option that has been added to VR
environments. Image tracking requires an image to be loaded into the VR environment
during development and a set of virtual objects are associated with this image. To view
these objects when running the application, this image must be physically placed within
the field of view of the camera embedded within the smartphone. This can be done by
printing the image. Vuforia was used, a very popular image tracking library, and can be
directly integrated with Unity [22]. Integrating Vuforia with Unity requires the software
development kit (SDK) package to be imported and no additional programming is required.
When the physical image is detected by the smartphone application, all associated virtual
and the angle between the two [44]. Vuforia creates image features and uses these in its
calculations (Fig. 2).
Figure 2: Image features created by Vuforia. These points are used to calculate the
distance and angle between the image and the smartphone camera.
These calculations are done so that when the virtual objects are overlaid, they are at the
correct scale and angle to the user [44]. If the application loses the image tracking, such as
when the image is not within the camera field of view or if the user is too far away for the
application to distinguish the needed features, the virtual objects will no longer be
displayed. To have the objects reappear, the user would have the bring the image back into
the camera field of view and hold the smartphone close enough that the above features can
be found by Vuforia’s algorithm.
The overall research goal is to create a neurosurgical training simulator so a virtual
mannequin head has been included in the simulator. All the tasks that the users were asked
to complete were contained within the head to give it the neurosurgical context. It also
tasks can be divided into several basic tasks with a main task being the selection of a
position or of a trajectory within the anatomical setting. Ellipsoids were used as the
targeting shape for the tasks as some neurological structures can be abstracted into simpler
shapes. Ellipsoids are also advantageous when assessing a trajectory targeting task as the
user can be asked to target the shape through the longest axis. The accuracy of the user’s
ability to target this axis can be more easily calculated using this shape. The simulator was
designed to use pointing tasks and was evaluated by assessing the usability and the
accuracy of the participants to correctly place a tool through the longest axis of the
ellipsoids.
2.2
Methods
The simulator has been developed using Unity3d (version 5) with an android smartphone
as the HMD. The LG Nexus 5 and Samsung Galaxy Alpha were specifically chosen for
their availability and affordability. Neither of these smartphones contain the most recent
hardware and software releases. Most users would not have access to the newest
smartphone release so these phones are a more realistic representation of what most users
would have. This application was integrated with the Google cardboard glasses so that the
virtual environment would be seen by the users in 3D. This integration was done by
importing the Google Cardboard SDK in to Unity3d. Google cardboard duplicates the view
of the camera so that when viewed with the cardboard glasses, it appears stereoscopic to
the user (Fig. 3)[32]. The simulator has been design so that users can interact with the
virtual objects. A simple pointer tool has been designed to achieve this. The tool allows
users to select the trajectory and position to complete the tasks presented to them. Vuforia
is capable of tracking multiple images, so two images for the simulator: one for the base of
Figure 3: The duplicated camera view that when used in combination with the
Google cardboard 3D glasses, the user is presented with the stereoscopic view.
Figure 4: The base image for the simulator with the associated virtual mannequin
Figure 5: The tool image and the associated virtual tool.
To make the simulator feel as natural as possible, the tool image was attached to a pen.
This was done to improve the comfort of the tool in the users’ hands and the image was
duplicated on both sides (Fig. 6). This was done to maximize the amount of freedom the
participants had in moving the tool.
Figure 6: The setup of the physical tool with the tool image.
All the targeting tasks consisted of locating a visible ellipsoid within the virtual head. The
ellipsoid and the tip touched the opposite edge of the ellipsoid (Fig. 7). The users were told
that they were being timed for each task but that they should complete the tasks as
accurately as possible.
Figure 7: A participant placing the virtual tool through the longest axis of the visible
ellipsoid.
When the participant decided the tool was in the correct position, they pressed the action
button on the Google Cardboard glasses and a purple sphere appeared (Fig. 8). The action
button simulates a tap on the screen which then triggers a script included in the Unity
application that makes the sphere visible to the user. The purple sphere appeared in the
position of the tooltip to give the participants visual feedback on their selected tooltip
Figure 8: The selected position of the tooltip with the purple sphere shown as visual
feedback for the user.
A total of 15 ellipsoids were created using the 3D creation program Blender. The ellipsoids
varied in size, location and orientation. They were then imported into Unity and duplicated
so participants completed the same 15 ellipsoid targeting tasks twice for a total of 30 tasks.
The setup for this experiment consisted of the participants placing the base image in front
Figure 9: The experimental setup for this simulator.
When the action button is pressed, the amount of time it took the participant to complete
the task and if the tooltip was touching the ellipsoid edge were recorded. This was done by
a script that was written C# and was integrated with the Unity application. A total of eight
participants were recruited for this study. The participants completed a Likert style
questionnaire on conclusion of the tasks to provide quantitative feedback.
2.3
Results
The average accuracy for all participants was 62% and the average task completion time
was 23.79 s (SD 24.80 s). The individual accuracies and task completion times can be seen
in Table 1.
Table 1: Average targeting accuracy and task completion times by participant.
Participant Targeting Accuracy Task Time (s)
1 70% 26.32
3 60% 80.46
4 15.79% 40.18
5 86.67% 2.25
6 83.33% 5.3
7 83.33% 2.9
8 86.67% 10.09
The questionnaires did not report any strong views from the participants. The scale used in
the questionnaire ranged from one to seven with seven as the most positive response. The
participants felt the environment’s visual aspects were immersive, average of 5.12, and that
there was a natural feel to the input apparatus, average of 5.13. The participants felt
compelled by the objects moving through the environment, average of 5.25, but only
slightly felt they were able to explore the environment visually, average of 3.63.
2.4
Discussion
There were no clear trends observed in the accuracy and completion times. There was low
variance between individual participant task completion times but high variance between
participants. This indicates that the size of the ellipsoid did not affect how the participant
targeted the shape. The accuracy and task completion time were more reliant on the method
each participant took to completing the tasks. There were cases where the tool image
blocked the base image and would cause the image tracking to be lost. When this happened,
the mannequin head and ellipsoid would disappear. To resume tracking, the participant
would have to either move themselves to a different position so that both the base and tool
images were within the field of view of the camera or move the tool image away from the
base image. Both cases would cause the task completion time to be longer. Some of the
participants felt that this interruption in the task had a negative impact on their performance
and on the immersive environment of the simulator. This disruption could be a source of
noise within the data which would explain why the results are indistinct. Although the
ellipsoids varied in size, location and orientation, there may not have been enough variation
between them due to the limited space within the mannequin head. Using an image for the
tool made it difficult to avoid occlusion of the base image, and the 2D nature of the image
made the tool difficult to continuously track. Participants had to be conscious of the angle
camera. This lead to participants holding the tool in orientations that did not feel natural.
The participants hand and arm also contributed to the base image occlusion issue.
2.5
Conclusion
This study shows that a low-cost simulator was developed that has the potential to be used
in surgical training and education. The results indicate that the simulator functions as
intended but further advances in robustness are needed. In using multiple images for the
various parts of the simulator, usability of the simulator was affected so further research
into different interaction devices is needed to make improvements to this simulator. This
device would need to allow the user to interact with the virtual objects while continuing to
operate on the mobile platform. This will increase the cost of the simulator as users will
need access to additional hardware; however, the improvements to usability should justify
Chapter 3
3
Targeting Performance of Leap Motion In An
Augmented Reality Environment
This chapter will assess the usability of the Leap Motion (LM) controller as a user input
device on a mobile platform using an AR environment. This assessment comprised of
participants using a pair of virtual hands to complete a series of tasks: the first being a set
of pointing tasks, and the second a set of tracing tasks. For the first set of tasks, participants
located virtual spheres and placed the index finger of one virtual hand in the center of each
sphere. For the second set of tasks, participants traced the outside edge of various shapes.
This interaction between the participant and the virtual objects was achieved using the LM.
A total of seven participants completed the 15 sphere targeting tasks followed by 15 shape
tracing tasks. The performance accuracy of each participant while completing these tasks
was done using a Fitts’ Law methodology and was used to assess the usability and
robustness of the system.
3.1
Introduction
In the previous study, image tracking was used for both the simulator and the interactive
tool. Some users had difficulty completing the targeting tasks, as the tool image would
block the base image, and this would cause the image tracking to fail. When this
happened the virtual objects disappeared, which required the participants to move the tool
image so that tracking for both images could resume. Using the knowledge gained from
the previous study, a different device was selected for interacting with the virtual objects.
The LM controller was chosen for this study, as it did not cause image occlusion while
Figure 10: The LM controller with the 3D axis labeled.
The LM controller uses three infrared sensors and two infrared cameras to detect the
position and orientation of the users hands when held over the controller [45][46][47]. It
detects the individual finger positions and has a fingertip positional accuracy of 0.01 mm
[48]. The operational field of view (FOV) for the controller is 25 mm to 600 mm above
the controller with a range of 150° [45][46][47]. The LM controller may be connected to
a computer or a mobile device using a USB cable. To run the controller using a
smartphone, a special SDK package was installed onto the smartphone. This SDK
package allows the LM to communicate with the AR application. The controller does not
work on all smartphones available as it does require the smartphone to have enough
power to run the application and the controller simultaneously. There is no other external
power supply that can be used to run the controller and because of this, only smartphones
that have an 800+ snapdragon processor will be able to successfully run the LM and all
the associated applications. The LG Nexus 5 selected in the previous study has a
snapdragon 800 processor, so it met the hardware requirements for the LM controller. X Z
3.2
Methods
The AR environment for this study was developed using Unity3d (version 5.2.2). AR
provides a more enhanced environment as the users have the ability to use the context of
the real world when interacting with the virtual objects [22]. Image tracking for the
virtual objects was done with Vuforia (version 5.06). This was utilized since the tracking
on one image worked well from the previous study. All the spheres and shapes used in
both parts of this study were loaded into the Unity3d program so that their locations and
orientations were associated with the base image. The system was deployed on the LG
Nexus 5 with the LM directly connected to the phone (Fig. 11).
Figure 21: The setup of the smartphone with the LM controller. The LM uses a USB
connector, so a USB to micro USB converter was needed to connect the LM directly
to the Nexus 5.
This study consisted of two parts: the first part participants were instructed to place the
tip of a virtual index finger within a sphere, and the second part participants were
instructed to trace the outside edge of different shapes with the tip of the virtual index
finger. All seven participants completed the study in the same order: first they completed
conducted in this order so that all participants could learn how to use the system by
completing relatively simple tasks, then move on to complete the more difficult tasks.
The gender and handedness of the seven participants were recorded. Three participants
were female and four were male, while two were left handed, one female and one male.
The same spheres and shapes were used for all participants in the same order to ensure
equality of task difficulty. The unit of measure that Unity3d uses for the virtual
environment is a Unity unit (uu). For both parts of this study, 1 unity unit is equal to 216
mm.
3.2.1
Sphere Targeting Tasks
The first part of the study was used to determine how well participants could target
simple spheres using the LM. A total of 15 sphere targeting tasks were designed with the
spheres appearing in the same random locations for all participants (Fig. 12). The sphere
size was the same for all tasks and only one sphere was visible to the participant for each
task.
The sphere positions were selected so that they would test the range of the LM. Figure 13
shows the base image that was selected, the virtual scene that was created in Unity3d
with one of the spheres shown, as well as how that scene was presented to the
participants when the application was running on the smartphone.
A) B) C)
Figure 43: The base image for all spheres. A) The image that was selected. B) The
image in a Unity scene with a sphere. C) The view of the same scene when run on
the smartphone.
The participants interacted with the virtual objects by using virtual hands (Fig. 14). The
application used the positional and rotational information from the LM to calculate where
the virtual hands should be within the AR environment shown to the participants. These
Figure 54: The virtual robotic hands used in the application. The virtual hands
mimic the movements of the users’ hands when held above the LM.
The image tracking required the camera to have an unobstructed view of the image for
continuous tracking. If the participants used their hands to interact with the virtual
spheres, image occlusion is possible and therefore cause tracking loss, so the virtual
hands provided the users with a means of interacting virtually, while always maintaining
continuous image tracking. The base image was printed and placed on a flat surface. The
participants were seated and could choose which hand they would use with the LM
controller. All the participants chose to use their dominate hand, and the LM was placed
such that the participant’s hand could be easily held above the controller (Fig. 15).
The participants were instructed to move about the space to determine the exact location
of the sphere, then to place the tip of the virtual index finger within the center of this
sphere. They were informed that they were being timed but should complete the tasks as
accurately as possible. When the participant felt they had placed the index finger
correctly, they pressed the button at the bottom of the screen and then move onto the next
task by pressing the button in the top right-hand corner of the screen (Fig. 16). The screen
interface was designed so that the participants could easily interact with all of the buttons
Figure 76: The screen view of the application as seen by the participants. The
arrows at the top of the screen as for switching between spheres and the green
button at the bottom of the screen records the position of the virtual index finger
when pressed.
The application was designed so that it recorded the position of the tip of the virtual index
finger for the duration of the task, and the time it took each participant to complete the
task. The timer started when the new sphere became visible and finished when the user
clicked the position button. The software to do this was written using C# and was directly
integrated with Unity3d.
3.2.2
Shape Tracing Tasks
The second part of this study was used to determine how well participants could trace the
outside edge of virtual shapes. To do this, three different shapes: squares, triangles and
circles, were used. Each shape was employed in five tasks for a total of 15 tasks. During
the first three tasks, the participants were shown each of the shapes in the center of the
screen (Fig. 17).
Figure 87: The first three shapes the participants were asked to trace.
For the remaining tasks, the order, size, position and orientation of the shapes were changed
within the AR environment (Fig. 18). This was done to increase the difficulty from the
Figure 98: Examples of the change in orientation, position and size for the three
different shapes that were presented to the participants.
The base image used for the sphere targeting tasks was used for these tasks. All the shapes
were associated with the base image in Unity3d (Fig. 19).
A) B) C)
Figure 109: The base image for all shapes. A) The image selected. B) The image and
a circle from a Unity scene. C) The same scene when run through the application on
the smartphone.
The LM setup was arranged the same, with the participants using a virtual hand to interact
with the virtual shapes. The same experimental design was used, with the base image being
placed in front of the seated participants and the LM placed on the same side as the hand
the participant selected. All of the participants again chose to use their dominate hand and
were instructed to explore the AR environment. Participants were instructed to press the
button at the bottom of the screen when they were ready to start tracing the shape (Fig. 20).
the tip of the virtual hands as close to the outside edge of the shape as possible, while still
touching the shape. Once they had completed tracing, the participant pressed the button at
the bottom again before moving on to the next shape by pressing the buttons at the top of
the screen. They were again informed that they were being timed while completing the
tasks but they should complete the tasks as accurately as possible.
Figure 20: The view of the first tracing task to the user. When the participant was
ready to start tracing, they pressed it and began tracing. The colour of the button
changed to indicate the position information of the index finger was being recorded.
The arrows at the top of the screen allowed the user to move between shapes.
The data for the position of the tip of the virtual index finger, the state of the record button
and the time were recorded. The timer started when the shape became visible to the
finished tracing. The fingertip position was recorded during the entire length of the task.
The software to do this was written in C# and integrated with Unity3d.
3.3
Results
The results were analyzed from both parts separately using a Fitts’ Law approach.
3.3.1
Sphere Targeting
The position of the index finger was recorded for the duration of the task, so that the exact
approach the user took to place their fingertip could be observed (Fig. 21).
Figure 211: The information recorded from Unity. The path of the index finger is
shown in yellow with the outside edge of the sphere shown in blue. The corners of
the base image are shown in red.
The radius of each sphere was 0.0516 uu. The participant was considered to be accurate if
they placed their fingertip inside the sphere. All distance calculations were performed using
the center location of each sphere and the user selected position of the fingertip. This
error was first calculated in all three directions. The participants’ accuracy was calculated
using:
Accuracy = log2(1 + 1
𝑒𝑟𝑟𝑜𝑟) (5)
The speed of each completed task was calculated using:
𝑆𝑝𝑒𝑒𝑑 = 1
𝑡𝑖𝑚𝑒 (6)
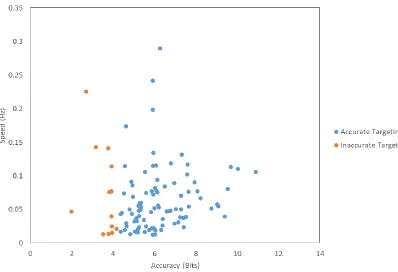
With time as the individual task completion time. The average task completion speed was
0.0647 Hz (SD 0.0493 Hz) and the average task accuracy was 4.0159 bits (SD 1.2860 bits)
of all participants (Fig. 22).
Figure 22: The speed and accuracy of sphere targeting for all participants. Correct
fingertip positions are shown in blue.
For the 105 fingertip positions selected by the participants, only 54 were accurate. The
average task completion time for all participants was 25.1831 s (SD 18.5018 s). The task
Figure 23: The task completion times by user.
As these targeting tasks require spatial reasoning, the error between the sphere center and
the fingertip was calculated in each individual direction to determine if some sphere
locations were more difficult for participants. Equation (5) and (6) were once again used
to calculate the accuracy in each direction and the task completion speed. Of the three
directions, the most accurate was the x direction, the width direction, with an average
accuracy of 5.9122 bits (SD 1.6016 bits) (Fig. 24). The second most accurate was the y
direction, the height direction, with an average accuracy of 5.8156 bits (SD 2.1596 bits)
(Fig. 25). The z direction, the depth direction, was the least accurate with an average
Figure 24: The speed and accuracy in the x direction (width direction) for all
Figure 25: The speed and accuracy in the y direction (height direction) for all
participants.
Figure 26: The speed and accuracy in the z direction (depth direction) for all
participants.
Table 1 shows the average time, average distance error in three directions, and the
average distance error in each of three directions for each user. The averages were
computed using participant data from all 15 tasks.
Table 2: Average time, average combined distance and average distance in each
direction for all users based on all target tasks.
User Average Time (s)
Avg Distance
(unity units)
Avg X Distance
(unity units)
Avg Y Distance
(unity units)
Avg Z Distance
(unity units)
1 12.5905 0.280038 0.044904 0.215482 0.168116
3 31.6582 0.041199 0.015622 0.017227 0.029653
4 40.06133 0.098245 0.038541 0.057432 0.056077
5 31.75773 0.077861 0.027337 0.024154 0.058247
6 31.45233 0.184395 0.021842 0.030927 0.177719
7 38.3646 0.135926 0.056961 0.040854 0.105796
3.3.2
Shape Tracing
The results from this study were analyzed by the task shape type. The fingertip path was
separated into two components: the first was before the participant pressed the “Record Position” button, and the second was after the initial button press. This first section was
recorded to observe what the participants did in preparation for tracing. Overall, this initial
position data showed the users identifying the hand orientation needed to make tracing the
shape easier and then moving their hand to the starting position. Figure 27 shows this
separated fingertip positional data for the first three tasks for one participant with the
Figure 27: The fingertip path split into before the record button had been pressed,
in yellow, and after the record button had been pressed, in purple. The outside edge
of the shape was shown in blue with the corners of the base image shown in red.
3.3.2.1
Circle Tracing
The tracing of the circles was analyzed by calculating the distance from the center of the
circle to the position of the index finger. Figure 28 shows the typical path of a user when
Figure 28: The fingertip path after the record button has been pressed for a “good”
trace.
Not all users were successful in tracing the outside edge as seen in figure 29 which was
considered a “poor” trace.
Figure 29: The fingertip path after the record button has been pressed for a “poor”
trace.
The ideal path for the user to have traced would have been the outside edge of the circle.
Figure 30 shows the distance from the center for both the “good” and “poor” trace with the
A) B)
Figure 30: The distance from the center over time. A) The “good” trace in blue, the
calculated edge of the circle in red. B) The “poor” trace in blue, the calculated edge
of the circle in red.
A modified equation (3), which describes a user’s path through a tunnel, was used to calculate each participant’s performance for each circle. The Fitts’ Law equation for a
tunnel was used:
𝑡 = 1
𝐼𝑃∗ 𝐴
𝜎 (7)
Where t is time, IP is the index of performance, A is the circumference of the task circle,
Figure 31: The maximum distance for this “good” trace was the top yellow line and
the minimum distance was the bottom yellow line.
Some users showed a clear bias in their tracing of the circles. For these participants, the σ
was calculated in the same manner, however the difference between the edge of the circle
and the minimum value was used as the bias (Fig. 32).
Figure 32: The maximum distance for this “poor” trace was the top yellow line and
the minimum distance was the bottom yellow line. The bias was the difference
between the minimum and the edge of the circle, as shown in red.
The error for all participants was calculated as:
𝑒𝑟𝑟𝑜𝑟 =𝐴
𝜎+ 𝑏𝑖𝑎𝑠 (8)
If the participant did not show a bias, then the bias was equal to zero. The results for each
Table 3: Average time, average combined distance and average distance in each
direction for all users based on all target tasks.
User
Circle 1 Circle 2 Circle 3 Circle 4 Circle 5
σ Bias σ Bias σ Bias σ Bias σ Bias
1 0.1176 0 0.2077 0 0.3244 0 0.1271 0.1737 0.1682 0.4995
2
0.0537 0 0.0593 0 0.1209 0 0.0377 0.0040
(<) 0.2450 0
3 0.1227 0 0.1316 0 0.0725 0 0.0837 0 0.0702 0
4 0.2074 0 0.0947 0 0.0794 0 0.0809 0 - -
5 0.2013 0 0.3437 0.0991 0.4392 0 0.3194 0 0.2425 0
6 0.0892 0 0.1179 0 0.0618 0 0.1781 0.2491 0.5111 0.0659
7 0.2018 0 0.2634 0.1715 0.1164 0 0.0834 0.2591 0.0605 0
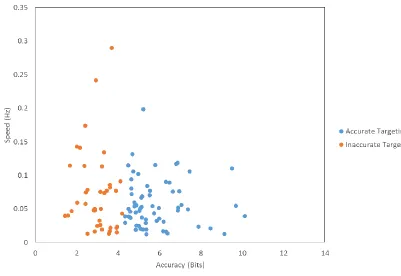
The accuracy for each task was calculated using equation (5) and the error calculated from
equation (8). The speed was calculated using equation (6). The speed and accuracy results
for all participants can be seen in Figure 33. The average speed was 0.1234 Hz (SD 0.0864
Figure 33: The speed and accuracy of circle tracing for all participants.
The average circle tracing time was 10.6751 s. The circle tracing times by participant can
Figure 34: The circle tracing times for all participants.
3.3.2.2
Square Tracing
The tracing of the squares was analyzed by splitting the path into each individual side and
calculating the distance between the fingertip position and the edge of the side. Figure 35
shows the path of a “good” trace.
Figure 35: The fingertip path of a “good” trace after the record button has been
pressed. The participant’s path is shown in yellow, the outside edge of the square is
The participants’ path was split into the four sides of the square and the distance was
calculated between the fingertip position and that side edge of the square. Figures 36 shows
this distance for each side of the square for the “good” trace.
Figure 36: The distances between the fingertip and the outside edge of the square for the “good” trace.
Figure 37: The fingertip path of a “poor” trace after the record button had been
pressed. The participant’s path is shown in yellow, the outside edge of the square is
shown in blue and the corners of the base image are shown in red.
Figures 38 shows the distances between the fingertip position and outside edge of the shape
by side for the “poor” trace.
Figure 38: The distances between the fingertip and the outside edge for the square for the “poor” trace.
A modified Fitts’ Law equation was used for this analysis. Each point error was
calculated as the distance away from the closest point on that side of the square. The
average of these distance errors was calculated and was considered the error for that side
of the square. Equation (5) was used to calculate the accuracy with the average error used
as the error and equation (6) was used to calculate the speed of tracing for that side. The
speed and accuracy for all participants can be seen in Figure 39. The average speed was
Figure 39: The speed and accuracy of each square traced by side for all
participants.
The average time per side was 3.2336 s. The square tracing times by participant can be
Figure 40: The square tracing times for all participants.
3.3.2.3
Triangle Tracing Results
Similar analysis was completed for the triangle shape tracing. The fingertip path was split
into each side of the triangle and the distance was calculated between the fingertip position
and the outside edge of the side. Figure 41 shows a typical “good” triangle trace.
Figure 412: The fingertip path after the record button had been pressed for a “good” trace. The fingertip path is shown in yellow, the outside edge of the triangle
Figures 42 shows the distances calculated for each side of the triangle for the “good” trace.
Figure 42: The distance between the fingertip position and the outside edge of side one of the triangle for the “good” trace.
A typical fingertip path for a “poor” triangle trace can be seen in figure 43.
Figure 43: The fingertip path after the record button has been pressed for a “poor”
trace. The fingertip path can be seen in yellow, the outside edge of the triangle can
be seen in blue and the corners of the base image can be seen in red.
Figures 44 shows the distances calculated between the fingertip path and each side of the
Figure 44: The distances between the fingertip position and the outside edge of the triangle for the “poor” trace.
The distance errors were calculated similarly to that of the square with the average
distance error per side calculated. Equation (5) was again used to calculate the accuracy
of each side of the triangle with the speed calculated using equation (6) and the tracing
time for each side. The speed and accuracy for all participants can be seen in Figure 45.
The average speed was 0.3183 Hz (SD 0.1599 Hz) and the average accuracy was 3.5962
Figure 45: The speed and accuracy for the triangle traced by side for all
participants.
The average time per side was 4.0196 s. The triangle tracing times by participant can be
Figure 46: The triangle tracing times for all participants.
3.4
Discussion
3.4.1
Sphere Targeting Tasks
These results show that participants were less accurate if they completed the tasks
quickly. It was observed that four of the participants’ task completion times deceased as
they completed more tasks, however this was not observed for the remaining participants.
Five of the participants experienced some tracking issues with the system. These tracking
issues were both with the base image and with the LM. This lead to longer completion
times, as the participants would either have to move the smartphone in towards the image
to pick up the image tracking or place their hand directly over top of the controller and
hold it there until the hand tracking resumed. Once the tracking resumed, the participants
could then complete the task. This effect was observed in Figure 14. Participants 4 and 7
both experienced tracking loss on several tasks. The image tracking loss occurred due to
participant movement to a position located too far away from the image, whereas the LM