ISSN 2286-4822 www.euacademic.org
Impact Factor: 3.1 (UIF) DRJI Value: 5.9 (B+)
Analysis of Financial Statement of Hindustan
Petroleum Corporation Ltd.
HUDA SALHE MEFTEN Student, Department of Financial Accountancy
Joseph School of Business Studies Shiats, Allahabad, UP, India
Ministry of Education The Directorate General of Financial Officer
MANISH ROY TIRKEY Assistant Professor Joseph School of Business Studies Shiats, Allahabad, UP, India
Abstract:
This study is conducted from 2008-2011 and various ratios were calculated and on the basis of that ratios it is found that the position of HPCL has strong solvency position as all the solvency ratios are favorable. The net profit for the year 2010-2011 is excellent and it is 8 times past year indicating reduction in operating expenses and large proportion of net sales available to the shareholders of company.
Key words: Balance sheet, companies, Ratio analysis.
1. Introduction
is the immense use in making decisions through analysis and interpretation of financial statements.Financial analysis is “the process of identifying the financial strengths and weaknesses of the firm by properly establishing relationship between the items of the balance sheet and the profit and loss account.” There are many techniques which may be used for analyzing the financial statements. These techniques may be classified as follows:
(A) Accounting Techniques (B) Statistical Techniques (C) Mathematical Techniques
Accounting Techniques:
Accounting techniques or tool which may use for financial analysis are many such as ratio analysis, common-size statement analysis, trend analysis, comparative statement analysis, value added analysis etc. The users pick up the techniques to suit their requirements and also on the basis of data available to them. The accounting techniques which are proposed to be used for the analysis of financial statements of Oil Companies are being discussed here.
Ratio Analysis:
financial ratios are commonly used (1) Liquidity ratios, (2) Profitability ratios, (30 Activity ratios, and (4) Leverage ratios.
Financial Statements:
Financial statements are summaries of the operating, financing, and investment activities of a business. Financial statements should provide information useful to both investors and creditors in making credit, investment, and other business decisions. And this usefulness means that investors and creditors can use these statements to predict, compare, and evaluate the amount, timing, and uncertainty of potential cash flows. In other words, financial statements provide the information needed to assess a company‘s future earnings and therefore the cash flows expected to result from those earnings. In this chapter, we discuss the four basic financial statements: the balance sheet, the income statement, the statement of cash flows, and the statement of shareholders‘ equity. The analysis of financial statements is provided in Part Six of this book.
2. Review of Literature
KalluRao, (1993) has made a study intercompany financial analysis of tea industry-retrospect and prospect. An attempt has been made in this study to analyze the important variables of tea industry and projected future trends regarding sales and profit for the next 10 year periods, with a view to help the policy makers to take appropriate decisions. Various financial ratios have been calculated for analyzing the financial health of the industry.
correlation and multiple regression analysis on working capital and profitability rations. They concluded through correlation and regression analysis that liquid ratio, inventory turnover ratio, receivables turnover ratio and cash turnover ratio had influenced the profitability of sugar industry in Tamil Nadu.
Key Sengupta, (1998) studied the performance of the fertilizers industry in India. Analysis of cost functions and cobb-Douglas production function have been made to study the performance of the industry, the results of which reveal that the industry is subject to the law of increasing costs .The findings get further support from the examination of the production function ,which reveals that the average productivity of labour exceeds its marginal productivity.
Sidhu and Gurpreet Bhatia, (1998) studied the factors affecting profitability in Indian textile industry. In this study an attempt was made to identify the major determinants of profitability in Indian textile industry with the help of empirical data taken from Bombay Stock Exchange Directory for the year 1983. To find out the factors affecting profitability, regression analysis had been applied. From the analysis, there was no clear-cut relationship between current profitability and capital intensity.
Vishnu Kanta Purohit, (1998) in ‘Profitability in Indian Industries: An analysis of firm size and profitability’ examined the relation between size and profitability in Indian industries. The study highlights the following two common conclusions. Firstly, though the average profitability of firms does not seem to vary significantly with their size and the variability of profit rates declines with size. Secondly, the average growth rates of firms do not seem to vary significantly with their size but the variability of growth rates only.
which are relevant in distinguish between profit making units and loss making units in Indian paper industry. The study indicates that model has correctly classified 82.14 percent of units selected as profit making and loss marking. The study also shows that inventory turnover ratio, interest coverage ratio, net profit to total assets and earning per share are the most important indicators of financial performance. The study also suggests that the results of MDA can be used as predictor of future profitability / sickness.
Raghunatha Reddy and Padma, (2005) in their study, an attempt has been made to study the impact of mergers on corporate performance. It compares the pre and post-merger operating performance of the corporations involved in merger to identify their financial characteristics. Empirical research on share price performance suggests that acquiring firm generally earns positive returns prior to announcement, but less that the market portfolio in the post liberalizations period in general and analysis of the pre and post-merger operating performance of the acquiring firm.
Mallik and Debasish Mukherjee, (2006) have studied the performance of leasing industry in West Bengal. This empirical study conducted covering fourteen leasing financing companies in West Bengal. An attempt was made to ascertain the profitability and to make a comparative analysis of profitability of the selected companies. With the help of ratio analysis performance of the selected units was evaluated. The findings of the study indicated good performance of leasing industry in West Bengal over the period of the study.
dispersion of the series for each industry over the study period. Findings of the study showed that the declining trend of profitability was proof of adverse effect of various controls on prices, output, expansion and investment etc., exerted by government on these industries over time.
Objective of the Study
1. To obtain a true insight into financial position of the company.
2. To draw the correct picture of the financial operations of the company in terms of liquidity, solvency, turnover, profitability etc.
3. Research Methodology
This study is based on the secondary data about Hindustan Petroleum Corporation Ltd for a detailed study of its financial statements, documents and system ratios and finally to recognize and determine the position of the company. The sources of collecting the primary data was through interviews, observation and questionnaire, however the secondary one was collected from the financial statements already available to the employees of the company and some of which was published.
Data Analysis:
Table 1.Current Ratio: -
Formula 2008-2009 2009-2010 2010-2011
Current Assets/Current Liabilities 0.93 0 .74
Figure 1. Current Ratio
Significance: -
This ratio is calculated for knowing short term solvency of the organization. This ratio indicates the solvency of the business i.e. ability to meet the liabilities of the business as and when they fall due. this ratio is known as 2:1 ratio. However it depends upon the nature of industry. The standard Current Ratio applicable to the Indian industries is 1.33:1.
Table. 2. Fixed Assets Turnover
Formula 2008-2009 2009-2010 2010-2011
Net sales/Fixed Assets
6.22 4.32 4.53
Figure 2. Fixed Assets Turnover
fully utilized. It is an important measure of the efficient and profit earning capacity of the business. Normally standard ratio is taken as five times.
The financial year 2008-2009 had so good fixed asset turnover ratio.
Table 3. Working Capital Turnover Ratio:
Formula
2008-2009 2009-2010 2010-2011
Net sales/Working Capital 8.63 8.48 3.33
Figure 3. Working Capital Turnover Ratio
This ratio signifies achievement of maximum sales with less investment in working capital. As such higher the ratio better will be the situation.
Table.4.Current Asset Turnover Ratio: -
Formula 2008-2009 2009-2010 2010-2011
Net sales/Current Asset
4.11 3.23 3.78
Figure 4. Current Asset Turnover Ratio
This ratio indicates capability of the organization in efficient use of current assets. This ratio indicates whether current assets are fully utilized. It indicates the sales generated per rupee of investment in current assets. In 2008-2009 it was good in comparison to other years.
Table 5.Debt-Equity Ratio: -
Formula 2008-2009 2009-2010 2010-2011
External Liabilities/Shareholders Fund
2.12 1.84 1.99
Figure 5. Debt-Equity Ratio
It is a measure of financial strength of a concern. Lower the ratio greater the security available to the creditors. A satisfactory current ratio and ample working capital may not always be a guarantee against insolvency if the total liabilities are inordinately large.
Table 6.Proprietary Ratio: -
Formula 2008-2009 2009-2010 2010-2011
Total Assets*100/Owners Fund 61.38 51 56.93
Figure 6. Proprietary Ratio
Financial year 2008-09 had good proprietary ratio as it indicates assets are financed to the extent of 69% by the owner’s funds and the balance is financed by the outsiders. The year 2009-10 had fall in proprietary ratio but in the year 2010-11 the company has improved due to rise in reserve and surplus due to appreciable profits in the last financial year.
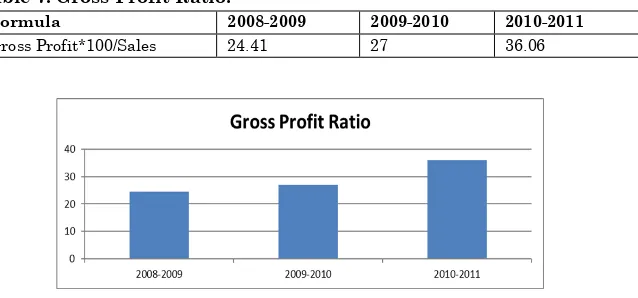
Table 7. Gross Profit Ratio:
Formula 2008-2009 2009-2010 2010-2011
Gross Profit*100/Sales 24.41 27 36.06
Figure 7. Gross Profit Ratio
This ratio indicates the degree to which selling prices of goods per unit may decline without resulting in losses on operations for the firm. The company is growing at a constant rate as far as gross profit is concerned which is appreciable indicating efficiency in production of goods at relatively lower costs.
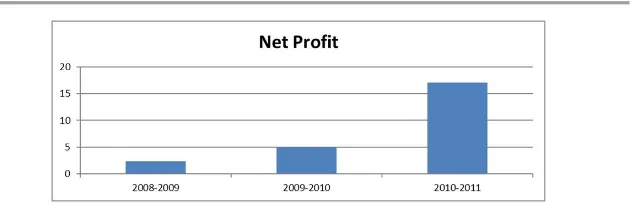
Table 8.Net Profit Ratio: -
Formula 2008-2009 2009-2010 2010-2011
Net Profit(after taxes)*100/Sales
Figure 8. Net Profit Ratio
The company has improved its net profits by 8 times in the year 2010-2011 from the 2008-2009 which is appreciable which shows considerable proportion of net sales to the owners and shareholders after all costs, charges and expenses including income tax, have been deducted.
Table 9.Return on Assets: -
Formula 2008-2009 2009-2010 2010-2011
Net Profit*100/Assets 316 341 370
Figure 9. Return on Assets
4. Findings:
1. The financial year 2008-2009 had so good fixed asset turnover ratio.
2. In 2008-2009 current asset turnover ratio was good in comparison to other years.
3. In 2008-2009 Capital turnover ratio was good.
4. Financial year 2008-2009 had good proprietary ratio as it indicates assets are financed to the extent of 69% by the owner’s funds and the balance is financed by the outsiders. The year 2009-2010 had fall in proprietary ratio but in the year 2010-2011 the company has improved due to rise in reserve and surplus due to appreciable profits in the last financial year.
5. Conclusion:
The company has got excellent gross profit ratio and the trend is rising which is appreciable indicating efficiency in production cost. The net profit for the year 2010-2011 is excellent and it is 8 times past year indicating reduction in operating expenses and large proportion of net sales available to the shareholders of company.
REFERENCES:
Kallu Rao, P. (1993). Inter Company Financial Analysis of Tea Industry Retrospect and Prospect, Finance India, Vol. VII, No.3, pp.587-602.
Vijayakumar, A. and Venkatachalam, A. (1995) Working Capital and Profitability – An Empirical Analysis, The Management Accountant, Vol. 15, No.3, pp. 748-750. Key, Sengupta (1998). An empirical exploration of the
econometric analysis, ArthaVijnana, Vol.XL, No.3, pp.252-262
Sidhu, H.S. and Gurpreet Bhatia, (1998). Factors affecting in Indian Textile Industry, The Indian Economic Journal, pp. 137-143.
Vishnu, Kanta Purohit (1998). Profitability in Indian Industries, New Delhi: Gayatri Publications.
Aggarwal, N. and Singla, S.K. (2001). How to develop a single index for financial performance, Indian Management, Vol.12, No.5, pp.59-62.
Raghunatha Reddy, D. and Padma, S. (2005). Pre and Post Merger financial performance of selected companies, Indian Journal of Accounting, Vol. XXXV (2), pp. 29-38. Mallik and Debasish Mukherjee (2006). Performance of leasing
industry in West Bengal, The Management Accountant, pp.393-298
Manor Selvi, A. and VijayaKumar. A (2007). Structure of Profit Rates in Indian Automobile Industry-A Comparison, the Management Accountant, pp.813-816.