A combined DFT/topological analysis approach
for modeling disordered solid electrolytes
Pavel Zolotarev1,2, Nadezhda Nekrasova2, Andrey Golov1,2, and Roman Eremin1,2,*
1Samara Center for Theoretical Materials Science, Samara University, Samara, Russia
2Samara Center for Theoretical Materials Science, Samara State Technical University, Samara, Russia
Abstract. In the scope of this study, the Ag2S·CdS·3SnS2 solid electrolyte disordered in the Cd/Sn sublattice is explored by means of the approach involving configurational space (CS) setting and first-principles calculations. Within the density functional theory calculations on the CS, the absolute differences in Ag vacancy formation energies up to 2.6 eV/cell were obtained for possible Cd/Sn dispositions. Subsequently, silver ion migration was modeled using the nudged elastic band method. The migration energies in the range of 0.250 to 2.993 eV/cell were obtained. By application of topological descriptors, namely, the relative disposition of Cd atoms and the number of Cd atoms in the vicinity of Ag vacancy, the reliable correlations were obtained between the Cd/Sn relative disposition and the calculated energy characteristics.
1 Introduction
Understanding the diffusion mechanisms in solid electrolytes is crucial for optimizing the performance of crystalline ion conductors and batteries [1]. Both experimental and computational approaches are used to investigate the ion transport that helps to improve performance of solid electrolytes. It was shown earlier that superionic state of promising solid electrolytes arises at high temperatures when the structure of these materials is significantly disordered [2]. Furthermore, electrolytes with enhanced ionic conductivity can be obtained by heterovalent metal atom substitution in the sublattice of migrating ion or in the frame sublattice, which also results in a structure disorder [2,3].
Among computational techniques, the methods of parametric force fields and density functional theory (DFT) have been widely applied for studying ion migration processes [4]. However, direct application of these techniques for a comprehensive study of doped and disordered structures is complicated due to high complexity of the model configurational space (CS). On the one hand, it is possible to simulate a limited number of configurations with the subsequent analysis of structures with the lowest total energy [2,5]. The significant drawback of this method is neglecting a contribution of the rest configurations. On the other hand, full CS sampling based on the topological approach coupled with massive DFT calculations was proposed earlier for cathode materials [6].
The aim of this work is to extend the latter mentioned approach to the modeling disordered solid electrolytes. The Ag2S·CdS·3SnS2 (ICSD code 152767) structure [7] was previously selected by means of the topological approach during screening for the promising Ag solid electrolytes. The structure has only one independent transition of Ag ion that allows one to elucidate directly an influence of the framework composition (Cd/Sn) on the Ag migration barriers.
2 Methods
2.1 Configurational space setting
The crystal structure of Ag2S·CdS·3SnS2 [7] shown in Fig.1a is highly symmetric (Fd-3m) that leads to a single Ag migration pathway between the 8a sites in the structure composing a three-periodic migration map. In order to set CS, the Supercell program [8] was used. For evaluation of vacancy formation energies and equilibrium model cell size, all independent Cd, Sn and single Ag vacancy dispositions in the structure were considered (CS#1).
Fig.1. Snapshots of (a) the Ag2S·CdS·3SnS2 crystal structure with cadmium (green) / tin (navy) disorder and (b) the Ag2S·CdS·3SnS2 CS#2 entry showing initial and final positions (orange) of a certain silver migration pathway. Silver and sulfur ions are depicted in light gray and yellow, respectively.
For the subsequent migration energy calculations by means of the nudged elastic band (NEB) method, the CS was set accounting for different initial and final positions of migrating ion (marked Ag ions). Next, the configurations, which have the relative disposition of the marked ions corresponding to the migration pathway (dAg-Ag ≈ 4.66 Å) as shown in Fig.1b, were only used in the NEB calculations (CS#2).
2.2 Vacancy formation energies and migration barrier calculations
equilibrium cell parameters for the subsequent NEB calculations were calculated based on the Boltzmann averaging and the obtained DFT-relaxed CS as described elsewhere [6].
Based on the CS#2 set, the calculations on the ionic transport properties were performed by application of the NEB method as implemented in the CP2K package [10]. The DZVP-MOLOPT basis sets and the QuickStep electron structure calculations routine were used together with the Goddecker-Tetter-Hutter pseudopotentials and the PBE exchange-correlation functional. Three-dimensional periodic boundary conditions were applied. The standard NEB calculations were performed with energy cutoff value of 400 Ry. For each independent pathway modeled, eight replicas were calculated and additional relaxation of the pathway endpoints was performed. The migration energy, Em, was determined as the
difference between the maximum value of the total energy profile along the pathway and the minimum energy among the whole set of profiles calculated. This procedure allows to account energy losses during Ag transitions involving formation of energetically unfavorable vacancies in the structure with all possible Cd/Sn dispositions.
2.3 Topological analysis
In order to elucidate the structure-properties relation for the CSs studied, we introduced the following topological descriptors: (1) relative disposition of Cd atoms and (2) number of Cd atoms in the vicinity (through one sulfur atom) of the Ag vacancy position. For each CS entry, the introduced descriptor values were calculated using the ToposPro package [11]. The relative position of Cd atoms in the Sn sublattice is denoted by the internal ToposPro notation for the graphs, NDn-k, where N is a sequence of coordination numbers of all independent nodes; D encodes the dimensionality of a fragment (M, C for 0D and 1D, respectively); n enumerates non-isomorphic graphs with a given ND sequence; k is the number of vertices in 0D graphs. For example, 1,6M7-1 describes the CdS6 finite octahedral fragment, while 1,2,6C1 encodes the topology of chain of edge-sharing CdS6 octahedra.
3 Results
3.1 Configurational spaces: statistics and DFT-based modeling
Fig. 2. (a) Distribution of vacancy formation energies for CS#1 (b) Energy profiles corresponding to the pathways with the minimal (0.250 eV/cell, green line) and maximal (2.993 eV/cell, red line) Em
values. For the latter mentioned pathway, the energy profile after subtraction of the minimal energy along the transition (gray dashed line) is depicted. The atom color scheme is the same as in Fig.1.
As one can see in Fig.2b, the obtained results on the differences in the vacancy formation energies correlate well for the both DFT models applied. It is worth noting for the pathway with the highest Em value of 2.993 eV/cell, that the difference in vacancy
formation energies (ca. 2.25 eV/cell) contributes significantly to this value, whereas the energy barrier along the pathway do not exceed 0.75 eV/cell (see Fig.2b, dash line). Taking into account the migration energy values for the independent silver ion transitions, the Em
mean value of 1.117 eV/cell (at 300 K) was obtained within the Boltzmann averaging.
3.2 Structure/energy correlations
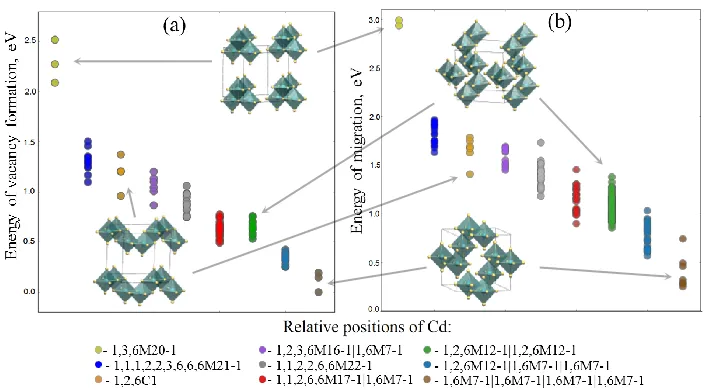
It was found that the disposition of Cd ions in the modeled cell correlates well with both the vacancy formation and ion migration characteristics as shown in Fig. 3.
The lower vacancy formation and migration energies correspond to the structures with a more homogeneous distribution of cadmium atoms and vice versa as illustrated in Fig.2b. The second descriptor encoding a presence of Cd near Ag vacancy or migration path correlates with neither vacancy formation nor ion migration energies.
4 Conclusions and remarks
In conclusion, the approach originally proposed for the cathode material modeling [6] has been extended in this research to model thermodynamic properties of solid electrolytes and ionic transport. The proposed approach can be extended also for investigations of the system with migration ion sublattice disordering. On one hand, wide energy spreading both for single vacancy thermodynamics and ionic transport was obtained for the studied compound. This observation highlights the fact that for many complex systems the full CS modeling can be complicated and be crucial for calculating reliable properties. On the other hand, the results obtained in this work clearly demonstrate advantages of CS consideration in combination with geometrical-topological and DFT approaches. Furthermore, selection of a proper set of geometrical-topological descriptors leading to strong correlations between structure and energy properties of ion transport allows one to reduce CS size for complex systems within the machine learning algorithms [12]. Thus, for the case of disordered structures, the proposed approach can be considered as an extension of the topology-based search algorithms for prospective solid electrolytes [13-15].
We are obliged to computational facilities of the ‘Zeolite’ supercomputer of Samara Center for Theoretical Materials Science (Samara University). The study was supported by the Ministry of Education and Science of the Russian Federation (project No.3.6588.2017/9.10) and the Russian Foundation for Basic Researches (project No.18-33-00477).
References
1. Parfitt D. et al. Appl. Phys. Rev. 4, 031305 (2017).
2. Proskurnina N.V. et al. J. Phys. Chem. C. 121, 21128–21135 (2017). 3. Geiger C.A. et al. Inorg. Chem. 50, 1089–1097 (2011).
4. Islam M.S., Fisher C.A. J. Chem. Soc. Rev. 43, 185–204 (2014).
5. Meier K., Laino T., Curioni A. J. Phys. Chem. C. 118, 6668–6679 (2014). 6. Eremin R.A. et al. J. Phys. Chem. C. 121, 28293−28305 (2017).
7. Parasyuk O.V. et al. J. Alloys Compd. 399, 173–177 (2005).
8. Okhotnikov K., Charpentier T., Cadars S. J. Cheminform. 8, 17 (2016). 9. Kresse G., Furthmüller J. Phys. Rev. B. 54, 11169–11186 (1996). 10. Hutter J. et al. Wiley Interdiscip. Rev. Comput. Mol. Sci. 4, 15–25 (2014).
11. Blatov V.A., Shevchenko A.P., Proserpio D.M. Cryst. Growth Des. 14, 3576–3586 (2014).