www.ijiset.com
Dielectric and Optical Properties Of The Fish Skin And Scales
E.M. Gojayev 1, N.S.Nabiev2, S.Sh.Kahramanov1, Sh.V.Alieva1
1. Azerbaijan Technical University
2. Baku State University
GEM -Statement of the problem and discuss the results. KSSh- participate in study the frequency
dependence of dielectric properties of scales and skin of fish. NNS -experimental study fluorescence
spectra of scales and skin of fish. AShV. Preparation of measuring equipment, sample preparation
and participation studies of dielectric properties and participate in the discussion of the results.
SUMMARY
In this paper presents the results of investigation the frequency dependence of electrical capacitance, permittivity, and dielectric loss of skin and scales of fish in 0-1000kHz range. According to the experimental results were calculated real and imaginary parts of the dielectric constant, refraction and reflection coefficients and the effective surface charge density. The results of a study of the spectra of fluorescence of the skin and scales of fish also presented.
Keywords: skin and scales of fish, the real and imaginary parts of the dielectric constant, refraction and reflection coefficients, fluorescence spectra.
INTRODUCTION
It is known that a large proportion of commercial fish waste is mainly the skin, which is the real activity of fish processing enterprises mainly directed to the production of fodder flour. The fish skin refers to the collagen-containing raw materials, looking to get the adjustable natural structures having a wide range of applications in the food industry and other sectors of the economy. On the other hand, gelatin, obtained by processing collagen containing of raw material is hydrolyzed collagen solution. It has a number of characteristics and it is a unique substance, which has a chemical and amino acid composition and has a specific physical and chemical characteristics. Therefore, gelatin is widely used in food industry, medicine, cosmetics and other industries [1-3]. On the other hand, the use of collagen actuality no doubt as inherently collagen - protein of the connective tissue. The proteins of the connective tissue in the latter being considered as a valuable source of dietary fiber, according to their compositions are not inferior land-based sources of ballast substances [4, 5].The unique physical - chemical characteristics inherent to proteins allow the use of collagen in different areas of human activity. The methods of radiation polymerization have been developed to produce collagen implants of various kinds, mainly for the treatment of affected areas of
the skin, and for creating prostheses by irradiating a mixture of monomers or polymers with collagen. Implants are well compatible with blood and do not cause inflammation. Implants are used in surgery and can be used as substrates in biotechnology. From the collagen material can produce membranes, monolayers and multilayer structures. Films (monolayer, multilayer, three-dimensional matrices), [6] prepared from collagen materials are among the most interesting materials in terms of both practical use and theoretical research. First of all, such films are of interest for biomedical applications [7]. Among other things, the surface of these films can be modified in accordance with various applications [8], collagen films containing nanorods and nanowires (for example, carbon nanotubes or silver / gold nanowires) and other additives (for example, sulfone liquid crystals) to change their optical and electromagnetic properties. In [9], a magnetically controlled system for microprocessing was presented. A similar system can be used to attach magnetic particles to the collagen material. Collagen films can be formed on various substrates: plastic, plastic, glass, metal or various biological materials. The studies allowed accumulating extensive experience in the use of various types of collagen preparations, they showed that collagen can be implanted into various organs and this does not lead to immunological rejection. Covering the surface of chips and parts of microelectronic technology implanted in the body of living organisms with a collagen film will allow achieving biocompatibility and preventing their rejection as a foreign body. Recently, in [10], it has been shown how to effectively use the piezoelectric properties of carp scales by attaching gold contacts to it, to obtain a miniature alternative energy generator that can be used for implanted electronic monitoring devices and devices that control the intake of the drug into the body. To identify special properties and wide use of collagen-containing materials, skin and fish scales in practice, their wider and more comprehensive study is necessary.
It is known that the emission spectrum wears information about the molecular structure and the nature of the material. The shape of the fluorescence
www.ijiset.com spectrum does not depend on the wavelength of the
excitation light, since the emission is generated by the lowest of the excited states. The fluorescence spectrum is often a "mirror reflection" of the absorption spectrum. Fixing the emission monochromator and scanning monochromator excitation can be obtained by fluorescence excitation spectrum. Excitation spectrum is the dependence of the emission intensity at a given wavelength by scanning wavelength of the exciting light. Can be carried out and simultaneous scanning of both monochromators and obtain spectra of synchronous scanning. A characteristic property of the fluorescence spectrum (SF) is a high resolution, accompanied by processes related to the chemical composition of the sample, the elements of the structure and other dynamic changes. SF has a fairly short range of time, as through 10-8sec after light absorption begins fluorescence. After this time, all processes take place at the molecular level, nonradioactive energy transfer and the exchange of charges and energies between the components is reflected in the fluorescence spectra, in the results of short-term dynamic processes in the study of static properties and properties, as well as processes that are identified with light signal detected by narrow luminescence bands [11].
In view above stated, the purpose of this paper is to investigation the frequency dependence of electrical capacitance, permittivity, dielectric losses, coefficients of refraction, reflection, effective surface charge density and luminescence spectra of the skin and scales of fish.
EXPERIMENTAL TECHNIQUE
In order for determine the permittivity (ε) skin and scales of fish measured the electrical capacitance (C) of samples. Permittivity of the material is calculated from the measured capacitance, the thickness of the samples and the electrode area. The permittivity (ε) is calculated by the formula:
S
Cd
0
ε
ε
=
,
where, C is the measured electrical capacitance of
the sample, F;
ε
0 = 8,85 10-12F/m; d-diameter of thesample, m; S - area of the sample, m2. Dissipation factor is measured directly. Thus, for each of the selected samples measured capacitance and dielectric loss tangent corresponding to the frequencies - 1 kHs. The sample was mounted between two electrodes in the measuring cell. The sample was then heated in a cell using a heater which is mounted in the cover with a constant speed of 2K/min. The sample temperature
was recorded by using a thermocouple, a temperature meter, and dielectric loss and dielectric constant at a measuring bridge E7-8. Heating with a constant velocity is achieved using three-LATR-system [12].
Figure. 1. Block diagram of the apparatus for measuring temperature dependences of dielectric constant and dielectric losses: 1 - measuring cell, 2 - sample, 3 - thermocouple, 4 - heater, 5 - immittance meter,6- thermometer, 7 - three-phase auto-regulated system.
Research luminescent properties of fish scales were performed using spectrofluorimeter Cary Eclipse. The device is versatile for studying the spectral properties of samples of different nature. The device is focused on the use of biological and materials science applications. The excitation source is a pulsed xenon lamp, with specification-80 flashes per second, 75 kW equivalent powers under the peak. Focusing optics is Schwarzschild collector. Using the construction Czerny - Turner monochromator and controlled horizontal slot. There are six selectable slits: 1.5, 2.5, 5, 10, 20, 10mm. Eclipse includes a monochromator and 2 can be carried out independent of each scanning monochromator. If fixed excitation monochromator scanning emission monochromator
obtained emission spectrum or often called the fluorescence spectrum [11].
www.ijiset.com Figure 2. Diagram of the spectrofluorimeter device:
1 - source; 2 - lenses; 3 - excitation monochromator; 4 - cuvettes for placing the sample; 5 - monochromator for emitted light; 6 - photomultiplier; 7 - recording device
EXPERIMENTAL RESULTS AND DISCUSSION
Studied the frequency dependence of electrical capacitance of the skin and scales of fish (Figure 3.). Studies were conducted in the frequency range of 0 ÷ 103 kHz. As it follows from Fig.3 for the skin of fish, in the frequency range 0.025-1kHz the electrical capacitance decrease from 1837 pF/m to 153pF/m.In the future, with increasing frequency from 1 to 103 kHz there is a slight decrease from 153 to 54 pF/m. In the frequency range 0.025-1kHz a decrease in electrical capacitance of scales fish from 112 pF/m to 35pF/m. With increasing frequency from 1 to 103kHz observed a slight decrease in electrical capacitance from 35pF/m to 31pF/m. In general, the behavior of the electrical capacitance of the skin and scales of fish, depending on the frequency are the same, however, the electrical capacitance of the skin of fish over the entire frequency range is 15 times higher than in the fish scales.
Figure 3. The frequency dependence of electrical capacitance of the skin (1) and scales (2).
Using the experimental data of electrical capacitance by the formula (1) were calculated coefficients of the dielectric constant of the skin and scales of fish in the frequency range 0-106Hz.The calculation results are shown in Figure 4. As shown in Fig. 4 at frequency range 0.025-1000kHz the dielectric constant of fish skin decreases from 4593 to 383, and the dielectric constant of scales decreases from 35 to 11.With the further increase the frequency from 1 kHz to 103 kHz occurs insignificant reduction of the permittivity of the fish skin from 382 to 135, and insignificant reduction of fish scales from 11 to 10.
Reducing the dielectric constant of the skin and scales of fish in this frequency range indicates the relaxation character of permittivity dispersion.This
change may be due to the kinetics of the individual elements of natural composite structures that with increasing frequency beginning to participate in the relaxation process. As a result, there is relatively strong internal field in the skin and scales of fish and it is decrease the dielectric constant. Note that the value of the permittivity of the skin 130 times greater than the dielectric constant of fish scales. However, the behavior of the ε (ω) for the skin and fish scales were not significantly different.
Figure 4. The frequency dependence of the dielectric permittivity of the fish skin (1) and scales (2).
Investigated the frequency dependence of the dielectric loss tangent (
tg
δ
) skin and scales of fish.The result of investigation is provided in Figure 5.As follows from Figure 5, in the frequency range 0.025 ÷ 1 kHz there is a strong decreasing oftg
δ
: for the fish skin this decreasing ranging from 2.48 to 1.02, and for scales from 1.91 to 0.38.In the frequency range of 1 ÷ 1000 kHz this decreasing from 1.02 to 0.12, while for the fish scales from 0.38 to 0.041. In contrast to the electrical capacitance and dielectric constant, dielectric loss of skin and scales of fish do not differ significantly in magnitude and nature of the change, depending from the frequency the same.Figure 5. The frequency dependence of the dielectric loss of fish skin (1) and scales (2).
This behavior of the function C (ω), tgδ (ω) and ε (ω) indicate the nature of the relaxation of the dispersion of the dielectric constant. As relaxations can perform the structural elements of the skin of fish with varying degrees of mobility, as well as a number of yet unknown molecular weight impurities. For the test of natural polymer is characterized by an initial
www.ijiset.com decrease in the dielectric constant, dielectric loss and
electric capacity. It is known that at low frequencies, internal electric fields are distributed accordingly conductivity and high frequencies - respectively the permittivity. Consequently, the decrease in C (ω), tgδ (ω) and ε (ω) by increasing the frequency of the measurement field can be explained by the emergence of relatively strong domestic field in the skin of the fish.
The decrease tgδ with increasing frequency shows that at low frequencies, the main type of dielectric losses are losses on the electrical conductivity. Note that the dispersion curves of ε (ω), C (ω) and tgδ not found.
In this paper, using the experimentally obtained results of electric capacity, the dielectric constant and dielectric loss tangent, electrical
conductivity (
σ
), real (ε
r) and imaginary (ε
i)portion of the dielectric permeability of the fish skin and scales determined by the formulas:
δ
ε
ωε
σ
=
0⋅
tg
;δ
ε
ε
21
tg
r+
=
;δ
ε
ε
i=
r⋅
tg
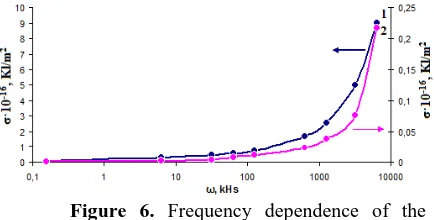
.The results of calculation of the electrical conductivity of scales and skin of fish are shown in Fig. 6. As can be seen from Fig. 6 in the frequency range 0.025 ÷ 100kHz slight increase is observed with respect to the effective charge density. For the above range increases from fish skin 8·10-18 to 1.6·10-16, and for fish scales increases from 9·10-20 to 2·10-18. In the frequency range 100 ÷ 1000kHz
σ
for fish skin increased from 1.6·10-16 to 9·10-16 and for fish scales increased from 2 ·10-18 to 2·10-17. The nature ofσ
changes for the fish scales and skin are the same and do not differ much value.Figure 6. Frequency dependence of the electrical conductivity of fish skin (1) and scales (2).
For the describing the experimental results of optical studies most commonly used refractive index n, absorption coefficient k, and the reflectance R. These values are associated with the microscopic characteristics of matter. Knowing the complex dielectric constant can pinpoint some optical constants. The experimental results of the real and
imaginary parts of the dielectric permeability of the skin and scales of fish in a wide frequency range (0 ÷ 1000kHz) determined their optical constants. These constants are defined by the known formulas [13]:
According [13], the real part of the complex refractive index (refractive index) is given by:
]
)
(
)
(
)
(
[
)
(
ω
21ε
ω
ε
2ω
ε
2ω
i r
r
n
=
+
+
where
ε
i,ε
rthe real and imaginary parts of thepermittivity.
The imaginary part of the complex refractive index (absorption coefficient) is a
]
)
(
)
(
)
(
[
)
(
ω
21ε
ω
ε
2ω
ε
2ω
i r
r
k
=
−
+
+
Then reflectance
)
(
]
1
)
(
[
)
(
]
1
)
(
[
)
(
2 22 2
ω
ω
ω
ω
ω
k
n
k
n
R
+
+
+
−
=
The results of calculations of the real part of the refractive index of the fish skin and scales are shown in Figure 7. It follows from Figure 7 that the frequency range of 0.25 ÷ 1 kHz real part of the refractive index n for the fish skin is reduced from 61 to 18 and for the fish scales from 5 to 3. In the frequency range 5 ÷ 1000kHz real part of the refractive index of the fish skin and scales are practically unchanged. The real part of the refractive index of the fish skin at low frequencies (0.025kHz) 10 times, and at high (1000kHz) 4 times greater than the refractive index of fish scales.
0 10 20 30 40 50 60 70
0,1 1 10 ω,kHs 100 1000 10000
n 0 1 2 3 4 5 6 2 1
Figure. 7. The frequency dependence of the real part of refractive index of the fish skin (1) and scales (2).
The results of calculations of the imaginary part of the refractive index for the fish skin and scales are shown in Figure 8. As it follows from Figure 8. in the frequency range 0.25 ÷ 100 kHz for the scales k varies between 3 and 0.07, and for the fish skin 30 to 1. With further increasing frequency imaginary parts of the refractive index substantially does not change.
www.ijiset.com
0 5 10 15 20 25 30 35
0,1 1 10 100 1000 10000
ω, kHs
k
0 0,5 1 1,5 2 2,5 3 3,5
2 1
Figure 8. The frequency dependence of the imaginary part of the refractive index of the fish skin (1) and scales (2).
The results of calculation of the reflection coefficient R of fish scales and skin is shown in Fig. 9. It follows from Figure 9 that over the entire frequency range of 0 ÷ 1000kHz coefficient fish skin reflectance decreases monotonically 0.9 to 0.7, and the reflection coefficient of the fish scales in the frequency range 0 ÷ 1 kHz slightly decreases with increasing frequency from 1 to 100 kHz R decreases from 0.86 to 0.32 and a further increase in frequency is practically unchanged. It should be noted that the reflection coefficients of the fish skin and scales do not differ greatly in size.
0 0,2 0,4 0,6 0,8 1 1,2
0,1 1 10 100 1000 10000 ω, kHs
R
1
2
Figure. 9. The frequency dependence of the reflection coefficient of the fish scales and skin.
Results of the study of the excitation spectra of the fish skin and scales are shown in Figure 10. The resulting spectrum reflects the characteristic radiation, which is obtained upon excitation with light skin 230nm length of the fish. Different spectrum includes peaks that correspond to some of the skin and scales of fish fluorescence.
As can be seen from fig.10a at signal wavelength excitations 370,00; 388,00; 396.96 and 416.96 nm observed effects of fluorescence at a wavelength of 458.93, 528.95, 541.02, and 568.97 nm, respectively. Peak fluorescence intensity detected in almost all samples comparable to the intensity of the excited signal. So in the excitation wavelength of the fluorescence intensity of the peaks 370.00nm matter 670.59 AU (AU - the atomic unit of energy), and in the excitation wavelength of the fluorescence intensity peaks 388.00nm matter 733.3 AU Accordingly, the wavelength of the fluorescence intensity peaks 396.96nm matter 521.74 AU and in
the excitation wavelength of the fluorescence intensity of the peaks 416.96nm is 163.16 AU
As can be seen from fig.10b for fish scales with the excitation signal wave length of 396.96, 388, 265.93, 253.64 fluorescence observed effects. At a wavelength of 541.02, 528.96, 362.00, 495.97, and note that the intensity of the peaks we have identified almost all excitations increases. So in the excitation wavelength of 396,96nm the fluorescence intensity peaks is 415.79AU and at excitation wavelength of 388nm peak fluorescence intensity is 600 AU. Accordingly, in the wavelength 265.95 nm, the fluorescence intensity of the peaks is 527.78 AU and at excitation wavelength of 253,64nm the fluorescence intensity peaks 633.34 AU.
So investigated fluorescence spectra fish skin and scales in the wavelength range 200-600nm, and found that these materials can be widely used in multi-functional electronic devices and used as a new type of composites with unique properties. Changing the intensity on the one hand due to the uneven distribution of intensity in the spectrum of a xenon lamp, on the other hand to the difference in quantum yield of fluorescence. By comparing the intensity of the excitation signals from the observed fluorescence intensity peaks can be concluded that the investigated material is clearly marked fluorescence properties.
a)
b)
Figure 10.
The fluorescence spectra of
the fish skin (a) and scales (b).www.ijiset.com Note that the effects observed in the
fluorescence spectrum in Kutum fish scales can be operated with a choice of scales from different parts of the fish skin.
REFERENCES
1. G.A.Mamedov, EM Gojayev, AM Maharramov Sh.A.Zeynalov, Studies of surface topography by atomic force and dielectric properties of high density polyethylene compositions and additives TlGaSe2
Electronic Materials Processing, 2011, 47 (6), 94-98. 2 E.M.Godjaev, N.S.Nabiev, Sh.A.Zeynalov, S.S.Osmanova, E.A.Allahyarov, A.G.Gasanova, Studies of the fluorescence spectra and dielectric properties of composites of HDPE + x.% TlGaSe2
Electronic materials Processing, 2013, 49 (3) -18 14. 3. E.M.Gojaev, S.S.Safarova, D.M. Kafarova. K.D.Gyulmamedov, H. R. Akhmedov study surface microrelief and dielectric properties of the compositions of PP + TlIn0, 98Ce0, 02Se2 Electronic
Materials Processing, Chisinau. 2013, 49 (4), 1-5. 4. E.M. Gojayev, A.M. Magerramov, Sh.A. Zeynalov, S.S. Osmanova, E.A. Allahyarov, Crown electrets based on high density polyethylene composites with semiconductor filler Academy of Sciences of the Republic Moldova. Kishinev. Electronic materials processing number 6, (266), 2010.
5. E.M.Godzhaev,K.S.Kahramanov, Sh.V.Alieva, A.B. Naghiyev Guasifractal surface of fish scales, Education News. Applied Chemistry and Biotechnology, 2014, № 1, (6), p.56-61.
6. Gojaev Eldar, Abasov Abbasali, Aliyeva Sharafkxanim, Charuxcev David // The Surface Fractal Structure of Fish Scales / / Open Journal of Inorganic Non-Metallic Materials, 2014,4,7-11. 7. Yakubova O.S., Kitten A.L. / / Journal; Bulletin of Astrakhan State Technical University, 2 Production technology household cleaning products as a source of scales ihtiozhelatina 2004 v.2 c.130 - 135.
8. Bahgat B.A.. Fractal structure of the living and the evolutionary process. Journal of General Biology, Volume 67, 2006. № 4, p.243 -255.
9. Gomez-Guillen М.С., Turnay J., Fernandez-Diaz M. D., Ulmo N., Lizarbe M. A., Montero P. Structural and physical properties of gelatin extracted from different marine species: a comparative study // Food Hydrocolloids. - 2002. - Vol. 54, N 1. - Р. 25-34.