Centre for Advanced Spatial Analysis University College London
1-19 Torrington Place Gower Street
London WC1E 6BT Tel: +44 (0) 171 391 1782 Fax: +44 (0) 171 813 2843 Email: [email protected] http://www.casa.ucl.ac.uk
http://www.casa.ucl.ac.uk/tate.pdf
Date: June 1998 ISSN: 1467-1298
ABSTRACT
New methods for simulating the form of buildings using virtual reality (VR) have suddenly made it possible to link ways in which people use buildings to their geometric layout. VR opens up many different approaches to architectural simulation ranging from agent-based modelling of movement within a building to representing a building as a multi-user world. We demonstrate some of these possibilities using the Tate Gallery on London’s Millbank where we predict the impact of detailed changes on the configuration of rooms and the display of pictures.
In an address to the Architectural Association in 1924, Winston Churchilli said: “There is no doubt
whatsoever about the influence of architecture and structure on human character and action. We
make our buildings and afterwards they make us. They regulate the course of our lives.” The impact
of this insight in architecture is enormous. Where it is possible, people continually adapt buildings
to changing functions, but where the structure of a building is so inflexible as to permit little
change, buildings fail. This is a hard lesson for designers to learn. It has not been helped by the
appearance of computer-aided design (CAD) packages that enable designers to explore how major
changes to the geometry of buildings affect appearance and economy but do little to show how
patterns of building use affect their performance and suitability. Yet most changes in the
environment involve ways in which space is manipulated locally. Users continually reposition
furniture, rearrange objects d’art, and control microclimate while less frequently but nevertheless
quite regularly, redecorate, occasionally modifying walls and windows as they learn what is
affordable and best. In fact, in complex buildings whose function is production, exchange or
entertainment, local arrangements can make an enormous difference to use and profitability as is
evidenced in the importance that supermarkets, museums, hospitals, and schools give to layout. It is
well-known for example that certain brands of good will sell better if they are positioned in a store
to take account of the movements of shoppers and their buying habits.
Hitherto it has been difficult to embody such elements into formal architectural design. CAD has
been largely concerned with representing buildings, not their users. Data on behaviour has been
sparse, rarely linked to the design of prospective use although recently, much better information on
use is beginning to appear from specialised questionnaires as well as passive sources such as closed
circuit TV. However, it is virtual reality (VR) interfaces to digital representations of buildings that
is changing this prospect most. In essence, VR allows both ordinary users as well as expert
designers to enter building environments encoded in conventional CAD form, and to begin to react
to what they see and feel. Such immersion enables us to by-pass the problem of simulating the
is the obvious problem of knowing the extent to which behaviour in the virtual environment is
directly transferable to the real. This real-virtual interaction is by no means the only new approach
to building simulation. Ways of modelling “virtual” users based on micro-simulation in spatial
environments are making substantially headway, drawing on new developments in complexity
theory such as artificial life. Examples such as the Los Alamos Lab’s TRANSIMS traffic model
based on modelling the motion of every vehicle in a city developed for US Federal Highways, and
Chris Langton’s SWARM system developed at Santa Fe illustrate the potential for agent-based
simulation in small-scale environments.
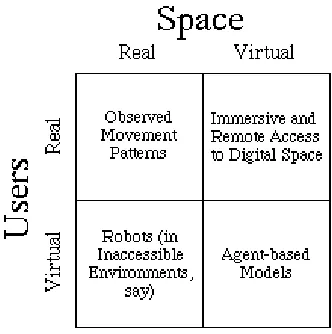
These possibilities can be defined by considering real versus virtual users against real versus virtual
environments (Figure 1).
Figure 1: Concatenating the Real with the Virtual
Our starting point is real users in real environments and in the example of the Tate Gallery that we
use to illustrate these ideas, a detailed survey of the spatial patterns of visitor use forms the raw data
on which such simulations are built. At the opposite extreme, computer models of the way agents
behave in simulated environments define methods for modelling the way virtual users behave in
virtual environments. Real users in virtual environments define the heartland of VR where single or
multiple users enter the virtual environment through various forms of immersion. Virtual users in
real environments - real artificial life as some have called it - is something that we will not discuss
here. These might be robots exploring real environments such as the creatures that inhabit Rodney
Brookes’ Mobile Robot (Mobot) Lab at MIT.
There are other ways of classifying our examples for buildings can be simulated in 2 as well as 3
dimensions; in fact our agent-based models operate in 2-d space with an emphasis here on spatial
behaviour that downplays the third dimension. The distinction between single and multiple users is
also important. Traditional VR is focused around a total immersion in the virtual world, usually
by navigating according to the visual cues prompted by the display. VR however is developing
more remote forms of access. VR theatres and smaller scale equivalents such as CAVES in which
many users can casually interact in conventional ways while being semi-immersed in a virtual
environment, are broadening access. Configuring environments as multi-user worlds accessible over
the net in which real users appear “virtually” as avatars are now being adapted to serious scientific
uses.
These possibilities throw up a variety of opportunities for simulating how users behave in the
spaces defined by buildings, and it is important to note that the ability to represent users in real or
virtual forms changes the emphasis in computer-aided design from a concern for space per se to one
in which the user becomes central. In CAD, users are either absent or remain passive - it is space
that is active - while in VR and agent-based modelling, space has a more dormant role with the user
being the focus of attention. Of course, comprehensive simulations will give equal emphasis to
relationships between users and the space that they occupy, and the challenge in this kind of
modelling is to simulate realistic behaviour which takes account of these interactions.
To illustrate these ideas, we will describe three related but very different approaches to building a
virtual model of the Tate. Starting from the basic data, we will illustrate how the effect of geometry
can be used to explain movement between the various spaces within the gallery by defining the
viewsheds that visitors experience (Figure 1a: real users - real space). This data-driven model based
on the ‘space syntax’ is contrasted with our second set of models based on the behaviour of agents
in digital space (Figure 1d: virtual users - virtual space) where we develop both 2-d and 3-d
versions. We then move to two models where real users can explore the Tate digitally (Figure 1b:
real users - virtual space), first in single user mode where the Tate is encoded as a CAD model and
the user navigates the space using a head-mounted display; and second where the same CAD model
forms a multi-user world accessible by remote users across the net who appear to one another as
avatars and who can communicate their experiences through text-based conversation. With this
wide array of virtuality, we can access any of these versions (with the exception of the
head-mounted display) in the more casual context of the VR theatre although we will not formally
describe such experiences in the examples shown here.
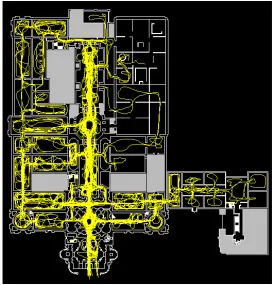
Movements of visitors in the Tate were recorded over a 12 hour period in August 1995. Visitors
were tracked for the first ten minutes after they entered the gallery with a sample of these shown in
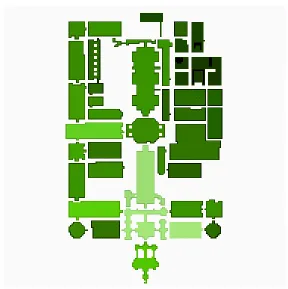
Figure 2 while counts such the average room occupancy over a one hour period shown in Figure 3,
were also made. The comparative geo-metric symmetry of the Tate is clearly broken by visitors
whose paths show a distinct left-handed orientation. This favours the western side of the gallery
which houses the British collection since 1500, in contrast to contemporary art which is housed on
the east. Room occupancy also indicates that the bookshop which is located on the right near the
through the gallery should thus predict the relative asymmetry between the left and right sides, the
dominance of the bookshop, and the lesser used rooms in the gallery’s north east corner.
Our first model has been developed by the Space Syntax group at University College London, and
this suggests that it is the configuration of the spaces and how they are connected that largely
determines movement in complex buildings. This is in contrast to the relative attraction of the
rooms themselves, in this case the art they exhibit.
Figure 2: Walking through the Tate
The grey lines show the paths of visitors for the first 10 minutes after they enter the gallery
Much of our modelling is thus concerned with testing the balance in explaining movement and
occupancy as a function of spatial configuration per se and other features that attract visitors. To
measure such spatial relations, we have computed the geometric extent and area which can be seen
from any point in the gallery, and the geometric links between these “isovists” have been used to
build a measure of connectivity, accessibility, or integration as it is called in the theory of space
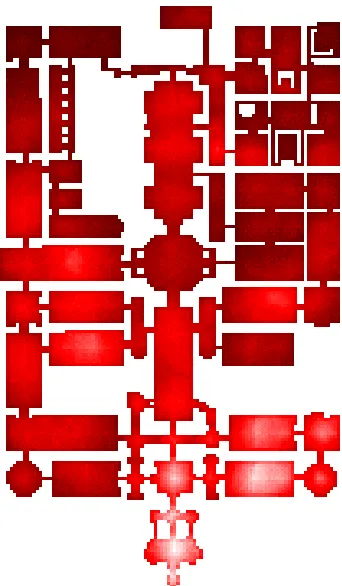
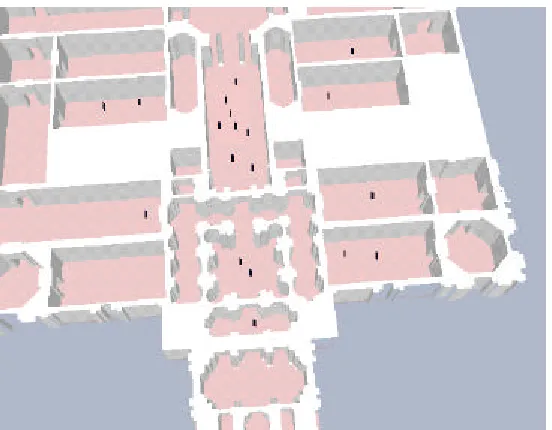
syntax,ii for all points in the space to every other. Figure 4 shows the layout of the gallery coloured
according to the degree of integration where it is immediately clear that the left-handed bias to the
layout is revealed. Over 70 percent of room occupancy can be explained by these integration values
Figure 3: Visitors in the Tate
The scale from dark (low) to light (high) grey indicates the average number of visitors
to different rooms in the gallery during a one hour period
Figure 4: What Visitors Can See in the Gallery
Dark grey through light grey reflects the increasing number of areas
within the gallery that can be seen from each point
The second set of models simulate virtual users in virtual space. The paths of visitors who enter the
geometric obstacles and each other), and the perceived attraction of different spaces measured by
frequency of visit. Agents thus trade-off their local navigation of space against their preferences to
visit different areas, and the focus of explanation is on the way the geometry of the gallery
combines with relative attractions of different spaces to generate observed movementsiii. This model
is heavily parameterised and has been calibrated both externally by ourselves and internally through
agents learning about the spaces that they navigate through. It works in 2-d, predicting multiple
paths through the gallery from which room occupancy is computed and tested against observed
behaviour. In one sense, this model is the most well-developed for making predictions about
changes to room attraction and local geometry. We show the kind of flow densities it generates in
Figure 5. Once again we explain over 70 percent of the variance in observed movements from this
model.
Figure 5: Predicting the Flow of Visitors
Dark grey (low) to white (high) shows the number of persons visiting each square metre
in the gallery during a typical simulation of the agent-based model
This agent-based model is structured around software which embodies the principles of cellular
automata (CA) using StarLogo from MIT’s Media Lab. Its agents are geometrically blind although
they make progress through finding clues to directions in under which to move within their local
neighbourhood. The related model that we have under construction operates in 3-d where agents
distances. Agents make progress through the gallery by focusing on lines of sight and this connects
their behaviour to properties of the geometry which are measured by isovists and the connectivity
between spaces. The model consists of adding agents as objects (with their behaviour encoded
through scripts) to the visualisation package Iris Performer. Agents have remarkable properties of
self-avoidance in this model whose 3-d form can be viewed at many scales from entire motion in
the gallery to the most local detail. Figure 6 shows the model in operation.
Figure 6: Agents Moving in the Gallery
Each dot represents an agent whose behaviour is encoded in a script and whose
motion takes account of the 2-d and 3-d geometric qualities of the space
Our third set of models are based on the traditional ways of developing VR: enabling real users to
enter, navigate and manipulate virtual space. Our first foray into the virtual Tate involved its
encoding in Microstation CAD (used for all subsequent models), its translation into the DVise
software, and its operation in immersive form using a head-mounted display. Individual users enter
this world and are then left to navigate around the rooms stripped of any ornamentation and art. A
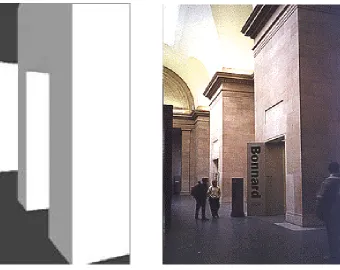
Figure 7: Inside the Virtual Tate
On the left is the virtual imagery of the Tate viewed through the headset alongside the real Tate
The essence of the experiments so far are to evaluate the extent to which the pure geometry of the
space conditions movement. Individual tracks are recorded in the same manner as those recorded
for real users in the real gallery, and those computed for the virtual users (agents) in the virtual
gallery. The variation explained in this world through combining the paths of a dozen users who
have ‘walked’ this virtual Tate is also consistent with observed data. The left-handedness of the
walks and the broken symmetry of room visits observed in real life is once again replicated. A
Figure 8: Paths of Visitors to the Virtual Tate
A series of paths through the gallery produced by visitors immersed in the virtual space
Just as we have a more elaborate agent-based model under construction, we have a more elaborate
multi-user virtual Tate. The CAD layout has been used to form a virtual world (based on the
ActiveWorlds software) which can be entered by users from remote sites over the Internet. Users
enter this virtual Tate whose ground zero is the main entrance. They appear as avatars (in a variety
of forms over which the user has control), and begin their walk in much the same manner as in the
immersive example. However this multi-user world enables visitors to see one other and thus to
generate paths which meet criteria for self-avoidance. Furthermore, users can communicate with
one another through text, which provides opportunities for the evaluation of art objects, and any
other kind of conversation for that matter. We are able to enrich this world in a much more
elaborate fashion that any of our others in that it is easy to put pictures on the walls, record the paths
of visitors, and the frequency of room visits, and even offer questionnaires to visitors so that their
online experiences can be monitored. A birds-eye view of part of the gallery in which a number of
Figure 9: Avatars in the Networked Virtual World of the Tate
Here five visitors have logged on to the virtual Tate from remote locations, they appear as avatars,
can “see” each other and “converse” through text as they view the art exhibited in the gallery
Although we have illustrated many different ways of exploring movement in a complex space, the
question arises as to which, if any, of these approaches are preferable to any other. Each of our
models characterises different features of the gallery through the ways in which users or agents
respond to geometry, to the content of spaces, and to each other. These various worlds constitute a
virtual laboratory in which we are designing a series of experiments to test the factors which
determine movement at a local scale. The agent-based CA model is quite different in detail from the
space syntax model which in turn is quite different from the immersive Tate, yet in these very
different ways, all three account for about the same amount of variance in the observations. But the
choice between them cannot be made on grounds of explanation in this narrow sense for each has
particular characteristics useful for different kinds of prediction. Immersive and network-based
virtual worlds enable the model-builder to get a much stronger handle on the effect of content in
buildings, in this case on the effects of pictures and other art objects on the way people move
through space. Space syntax models which are driven by the definition of isovists enable macro
predictions of the effect of new geometry on movement patterns while agent-based models enable
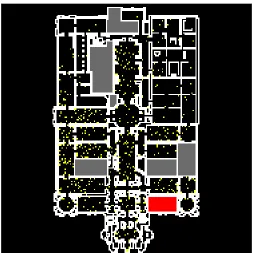
Figure 10: Closing the Bookshop
The white room with the cross hatch is the bookshop, the grey rooms are those closed to the public in August 1995,
while the dots are the positions of 550 “virtual” visitors to the Tate,
once they have reached a “steady state”
Predicting the effects of closing rooms and entrances, of constructing new additions to the gallery,
of changing the use of rooms and exhibiting different types of pictures on the walls, these are some
of the questions that can be asked of these models of the virtual Tate. For example, the impact of
closing the bookshop would clearly shift people into other areas of the gallery but which ones ? Of
course this might reduce the total number of visitors to the Tate too although these models cannot
answer this type of question. We do however show the effect of closing the bookshop as predicted
by the agent-based CA model in Figure 10 and this suggests that the asymmetry of the movement
pattern would be lessened.
Yet there are much more radical changes in prospect at the Tate which these models might predict.
When the New Tate Gallery opens on Bankside in the year 2000, the contemporary collection will
be rehoused there freeing up Millbank to take a more extensive British collection. There are many
questions that we might answer with our models when this happens but the key one is: will the
asymmetry of the existing movement pattern (where the British collection is dominant) disappear
altogether, and will movement through the gallery be substantially more different than it is at
present? The success of this and other complex buildings depend on good answers to these
questions as Winston Churchill presciently described so long ago when the debate over form and
i
Quoted in Stewart Brand (1994) How Buildings Learn: What Happens After They’re Built, Viking Penguin, New York, (footnote 2, page 3).
ii
Integration is a normalised measure of the distance from each node to every other in a symmetric binary graph, where each link between every immediately adjacent isovist is coded as a node, arcs between these nodes being defined if these links intersect one another. A definition and elaboration is given in Bill Hillier (1996) Space is the Machine: A
Configurational Theory of Architecture, Cambridge University Press, Cambridge, UK.
iii
The attraction of each space or room in a building such as an art gallery is hard to measure where room function and what is displayed in each as well as the artistic preferences of the visitors are likely to be highly heterogeneous. We have used measures of actual room usage as a proxy, notwithstanding the circularity of calibrating the model to this same measure. Independent measures however are being developed in related contexts, see for example, Michael Batty (1997) Predicting Where We Walk, Nature, 388, (3 July) 19-20.
Michael Batty, Bin Jiang and Andy Smith are with the Centre for Acvanced Spatial Analysis, Ruth Conroy, Bill Hillier, Jake Desyllas, and Alan Penn are with the Bartlett Graduate School, and Chiron Mottram and Alasdair Turner are with the VR Centre for the Built Environment, all at University College London.